

TeacherAiHasNoWorrie
現在、コンテンツはありません


- 報酬
- いいね
- コメント
- リポスト
- 共有


- 報酬
- いいね
- コメント
- リポスト
- 共有

- 報酬
- いいね
- コメント
- リポスト
- 共有


- 報酬
- いいね
- コメント
- リポスト
- 共有
- 報酬
- 1
- コメント
- リポスト
- 共有
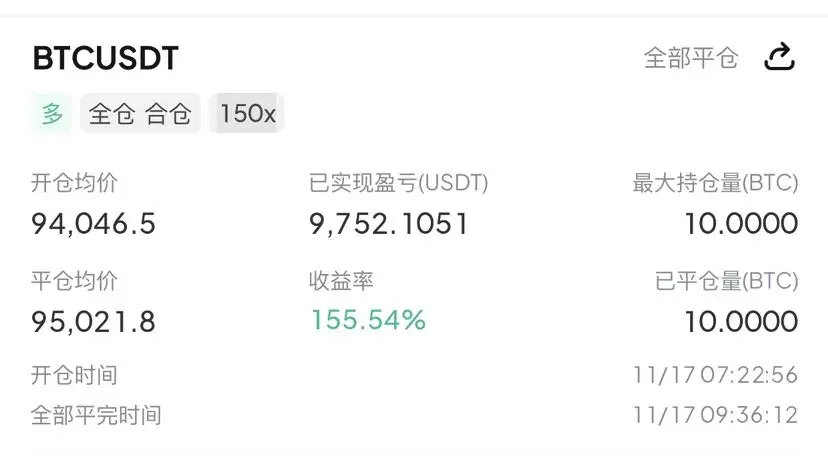
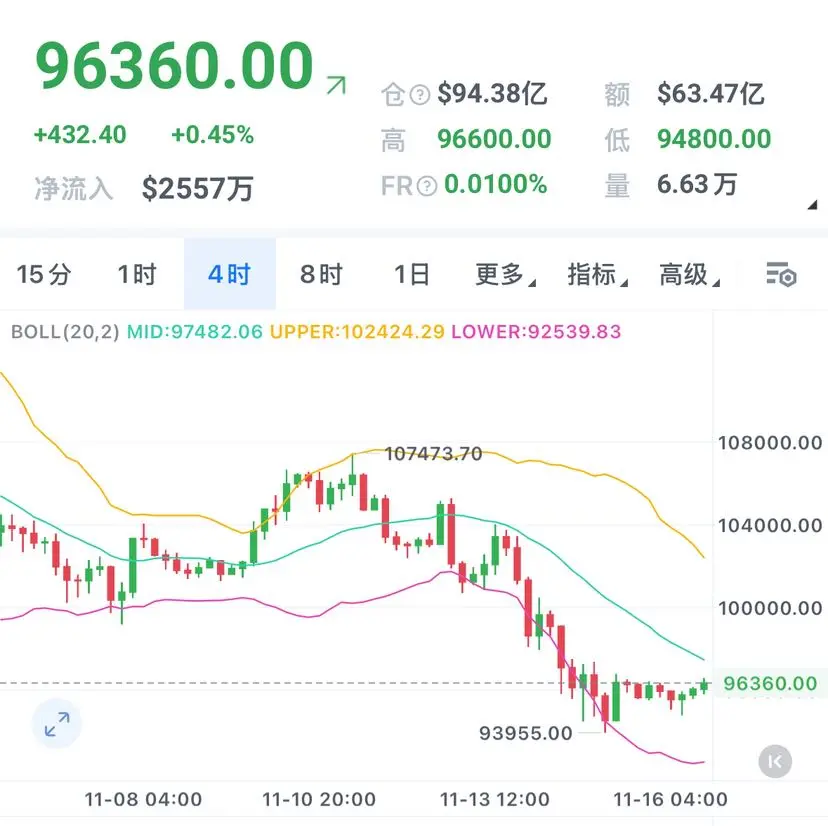
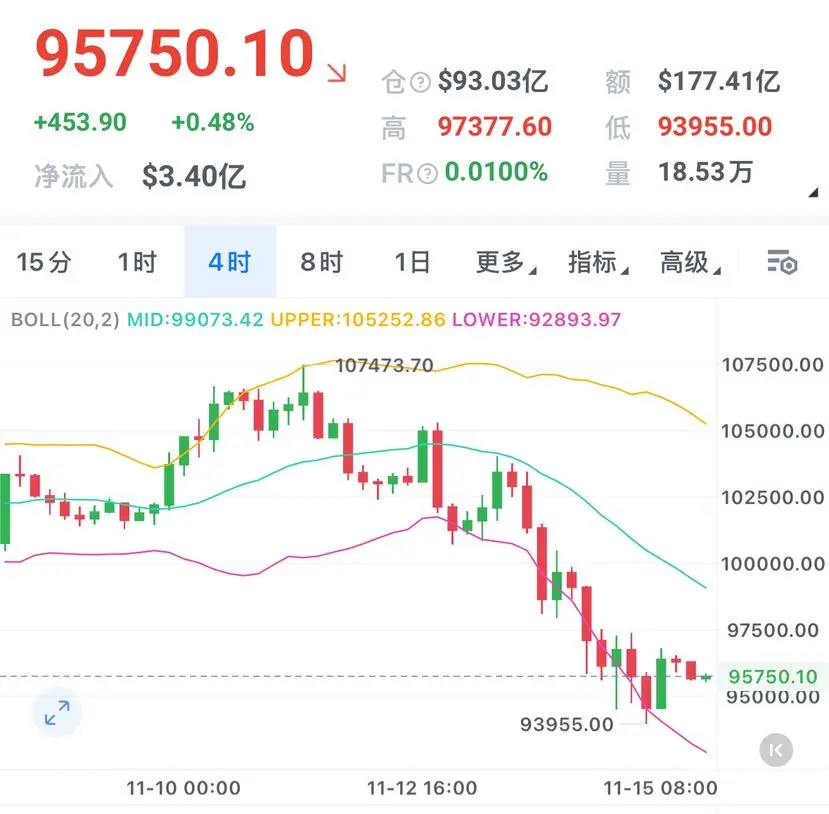
11.17 朝の最新の考え
最近の市場は振動しながら下落しており、高値は継続的に下がり、安値は次々と更新されています。同時に全体のボラティリティの範囲も徐々に狭まっており、市場は弱い整理段階にあります。
テクニカル面では、4時間周期のMACDは依然としてゼロ軸の下で動いており、ヒストグラムは縮小傾向にあるものの、依然として負の値域を維持していることから、弱気のエネルギーは若干減少しているが、強気の有効な反攻エネルギーはまだ形成されていないため、短期的なトレンドは依然として弱気傾向である。
下方では大ビットコイン94000の関門、二ビットコイン3050のラインのサポートの有効性に重点を置く必要があります。サポートが堅固であれば、市場はテクニカルリバウンドを迎える可能性があります。
ビットコイン93500-94300付近で買い、96000-97000を目指す
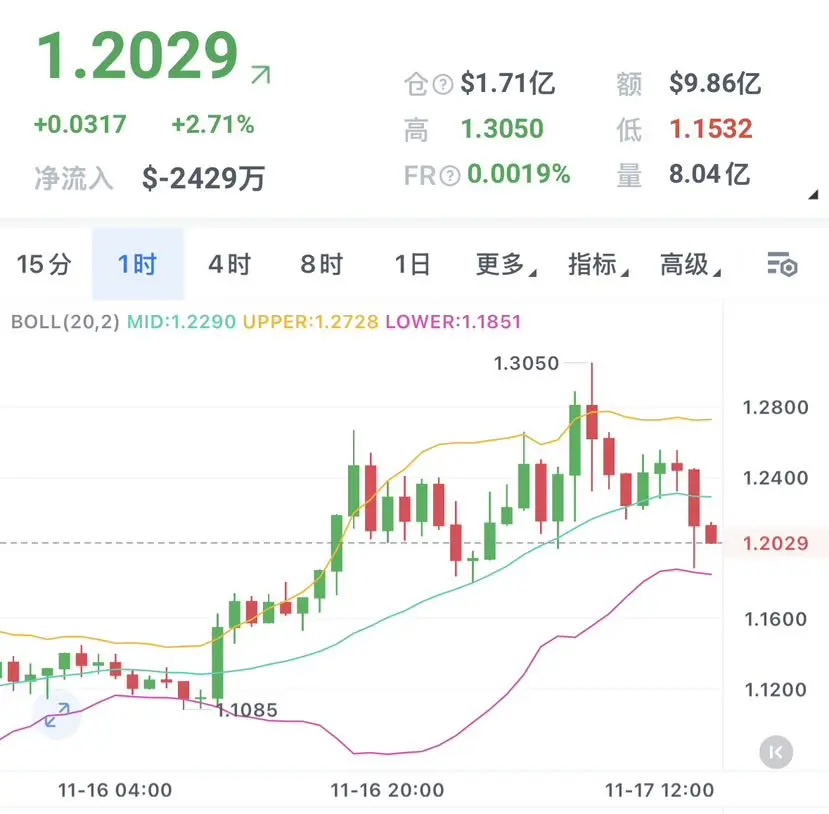
イーサリアム3050-3100付近で買い、3250を目指す
#Gate10月透明度报告出炉 #CoinDesk10月Gate战绩来袭 #美国结束政府停摆
原文表示最近の市場は振動しながら下落しており、高値は継続的に下がり、安値は次々と更新されています。同時に全体のボラティリティの範囲も徐々に狭まっており、市場は弱い整理段階にあります。
テクニカル面では、4時間周期のMACDは依然としてゼロ軸の下で動いており、ヒストグラムは縮小傾向にあるものの、依然として負の値域を維持していることから、弱気のエネルギーは若干減少しているが、強気の有効な反攻エネルギーはまだ形成されていないため、短期的なトレンドは依然として弱気傾向である。
下方では大ビットコイン94000の関門、二ビットコイン3050のラインのサポートの有効性に重点を置く必要があります。サポートが堅固であれば、市場はテクニカルリバウンドを迎える可能性があります。
ビットコイン93500-94300付近で買い、96000-97000を目指す
イーサリアム3050-3100付近で買い、3250を目指す
#Gate10月透明度报告出炉 #CoinDesk10月Gate战绩来袭 #美国结束政府停摆
- 報酬
- いいね
- コメント
- リポスト
- 共有
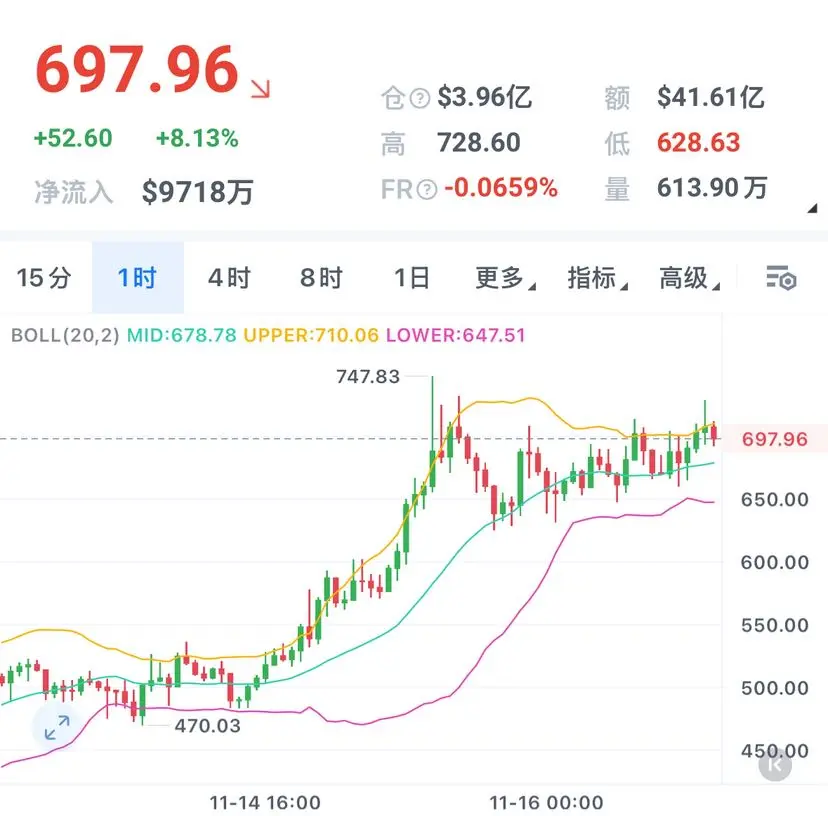
ZECは独自の地位を築き、強さは変わらず、1時間足での価格は747まで急上昇した後、わずかに下落し、現在はサイドウェイの整理段階に入っていますが、全体的には振動しながら上昇するリズムを維持しており、今後の前高値への攻撃の勢いは十分です。
665–670近くで多く、740-775近くを見上げる
#Gate10月透明度报告出炉 #CoinDesk10月Gate战绩来袭 #美国结束政府停摆
原文表示665–670近くで多く、740-775近くを見上げる
#Gate10月透明度报告出炉 #CoinDesk10月Gate战绩来袭 #美国结束政府停摆
- 報酬
- いいね
- コメント
- リポスト
- 共有
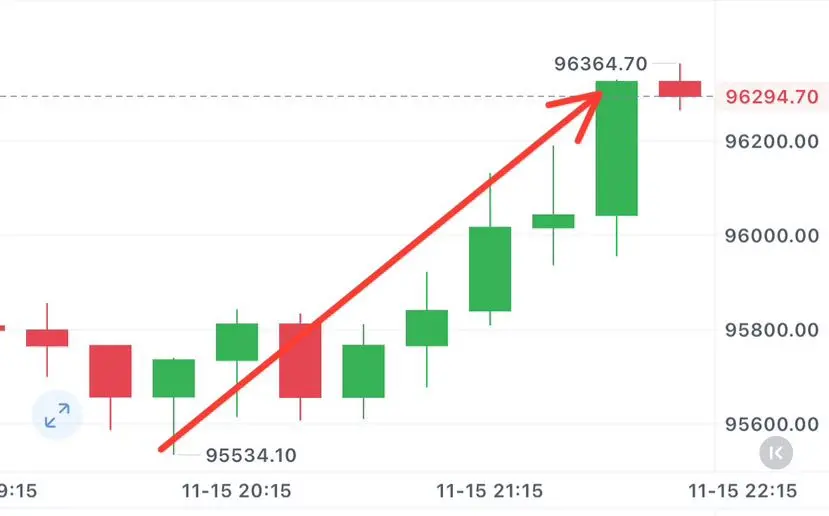
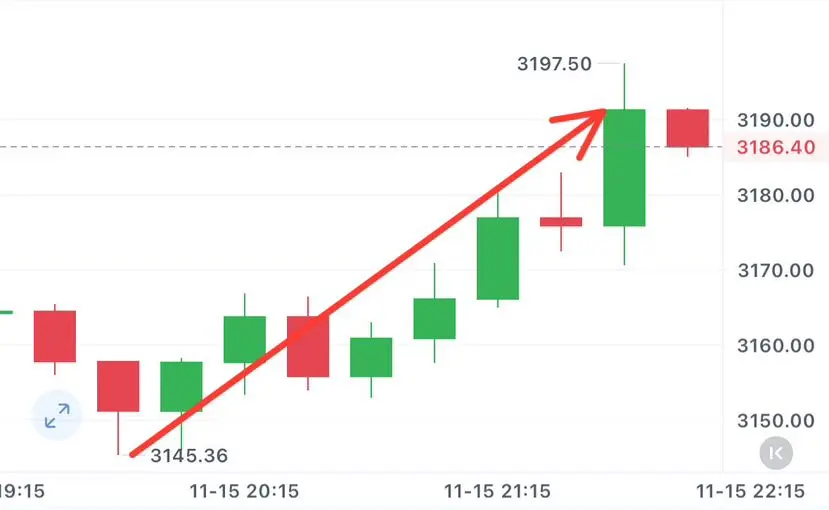
11.16夜の最新の考え
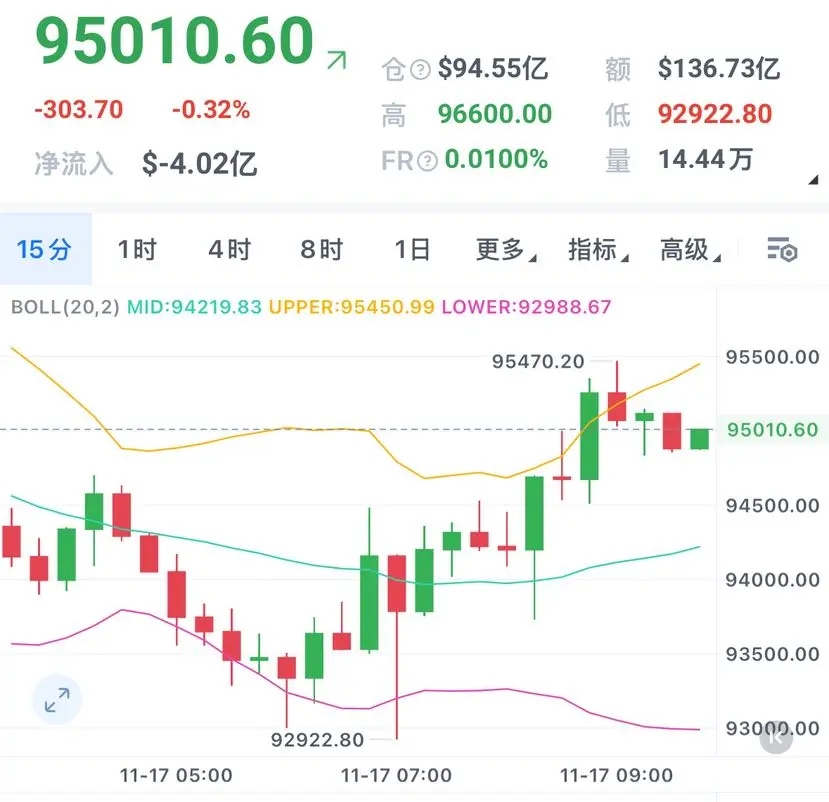
4時間足のチャンネルは安定して運行しており、価格が下落した後に迅速に反発し、ボリュームの調整後にエネルギーが強気の配置に転じ、移動平均線が同時に一貫して上昇している。短期間内に強気が失地を取り戻し、効果的な突破を達成し、上方のチャンネルが開く直前であり、今後の上昇の余地が期待できる。短期的な安定した上昇トレンドが継続し、ボリュームが強気の増加パターンを示し、チャンネルが同時に上昇して拡大し、移動平均線が上向きにカーブしている;この間の小幅な撤退は安定のための力を蓄えるものであり、高値突破への期待が強まっている。
ビットコイン95000-95500付近で買い、96000、97000を目指す
3160-3200の近くで多く、上は3500、3800を見る。
#Gate10月透明度报告出炉 #CoinDesk10月Gate战绩来袭 #美国结束政府停摆
原文表示4時間足のチャンネルは安定して運行しており、価格が下落した後に迅速に反発し、ボリュームの調整後にエネルギーが強気の配置に転じ、移動平均線が同時に一貫して上昇している。短期間内に強気が失地を取り戻し、効果的な突破を達成し、上方のチャンネルが開く直前であり、今後の上昇の余地が期待できる。短期的な安定した上昇トレンドが継続し、ボリュームが強気の増加パターンを示し、チャンネルが同時に上昇して拡大し、移動平均線が上向きにカーブしている;この間の小幅な撤退は安定のための力を蓄えるものであり、高値突破への期待が強まっている。
ビットコイン95000-95500付近で買い、96000、97000を目指す
3160-3200の近くで多く、上は3500、3800を見る。
#Gate10月透明度报告出炉 #CoinDesk10月Gate战绩来袭 #美国结束政府停摆
- 報酬
- いいね
- 3
- リポスト
- 共有
Long-shortEquityStrategyMaster :
:
愛老死は位置に到達しましたので、3500-3800を多く見ることができます。もっと見る
相場はいつもこんなに簡単です。トレンドを正しく選べば、何をしても儲かります。
皆さんが目に見えるように。市場のノイズがどうであれ、私は常に自分のリズムとスタイルを保ち、配置したい友達は直接私に連絡してください。
#Gate10月透明度报告出炉 #CoinDesk10月Gate战绩来袭 #美国结束政府停摆
原文表示皆さんが目に見えるように。市場のノイズがどうであれ、私は常に自分のリズムとスタイルを保ち、配置したい友達は直接私に連絡してください。
#Gate10月透明度报告出炉 #CoinDesk10月Gate战绩来袭 #美国结束政府停摆

- 報酬
- いいね
- コメント
- リポスト
- 共有
発信したばかりで、依然として目を引くスペースを持ち、権威があり、過激に保持し続けることが期待されます!!!
#Gate10月透明度报告出炉 #CoinDesk10月Gate战绩来袭 #美国结束政府停摆
原文表示#Gate10月透明度报告出炉 #CoinDesk10月Gate战绩来袭 #美国结束政府停摆

- 報酬
- いいね
- コメント
- リポスト
- 共有
11.15夜の最新の考え
ビットコインは昨日の夜間に高騰した後、今日の白昼は横ばいの動きを維持しており、深夜には最低で3088、94000に達した後に反発しました。これは以前に強調した3050、94000ラインの重要なサポートの有効性を証明しています。短期的に市場は何度も底を探りましたが破られず、底のサポートがさらに強固になることが期待されます。その後、波動的な反発が大いに予想されます。もし予想外にサポートを下回ると、2850、90000ラインまでさらに下落することになります。破られる前に、破位の方向にレイアウトを行うことはありません。
ビットコインは95200-95600付近でロング、97800付近を目指す。
イーサリアム3130-3150付近で買い、3250付近を目指す
#Gate10月透明度报告出炉 #CoinDesk10月Gate战绩来袭 #美国结束政府停摆
原文表示ビットコインは昨日の夜間に高騰した後、今日の白昼は横ばいの動きを維持しており、深夜には最低で3088、94000に達した後に反発しました。これは以前に強調した3050、94000ラインの重要なサポートの有効性を証明しています。短期的に市場は何度も底を探りましたが破られず、底のサポートがさらに強固になることが期待されます。その後、波動的な反発が大いに予想されます。もし予想外にサポートを下回ると、2850、90000ラインまでさらに下落することになります。破られる前に、破位の方向にレイアウトを行うことはありません。
ビットコインは95200-95600付近でロング、97800付近を目指す。
イーサリアム3130-3150付近で買い、3250付近を目指す
#Gate10月透明度报告出炉 #CoinDesk10月Gate战绩来袭 #美国结束政府停摆
- 報酬
- 4
- 2
- リポスト
- 共有
销魂呐 :
:
強気!もっと見る
- 報酬
- いいね
- コメント
- リポスト
- 共有
この二日間は下落が多く、強気トレーダーも少し落ち込んでいます。
現在の私の考えは反発を見込むことです
ビットコイン95100付近で強気トレーダー、目標98000、99000
イーサリアム3100付近で強気トレーダー、目標3300上方
#Gate10月透明度报告出炉 #CoinDesk10月Gate战绩来袭 #美国结束政府停摆
原文表示現在の私の考えは反発を見込むことです
ビットコイン95100付近で強気トレーダー、目標98000、99000
イーサリアム3100付近で強気トレーダー、目標3300上方
#Gate10月透明度报告出炉 #CoinDesk10月Gate战绩来袭 #美国结束政府停摆

- 報酬
- いいね
- コメント
- リポスト
- 共有