2025 OM Price Prediction: Analyzing Potential Growth Factors and Market Trends
Introduction: OM's Market Position and Investment Value
MANTRA (OM), as a security-first RWA Layer 1 blockchain, has been making significant strides since its inception in 2020. As of 2025, MANTRA's market capitalization has reached $94,428,987, with a circulating supply of approximately 1,117,106,207 tokens, and a price hovering around $0.08453. This asset, often referred to as a "regulatory-compliant blockchain solution," is playing an increasingly crucial role in institutional and developer-focused blockchain applications.
This article will provide a comprehensive analysis of MANTRA's price trends from 2025 to 2030, combining historical patterns, market supply and demand, ecosystem development, and macroeconomic factors to offer professional price predictions and practical investment strategies for investors.
I. OM Price History Review and Current Market Status
OM Historical Price Evolution Trajectory
- 2020: OM launched with an initial price of $0.2, marking the project's entry into the cryptocurrency market.
- 2021: OM reached its all-time high of $8.99 on February 23, 2021, showcasing significant growth and market interest.
- 2023: OM experienced a market downturn, hitting its all-time low of $0.01726188 on October 13, 2023.
OM Current Market Situation
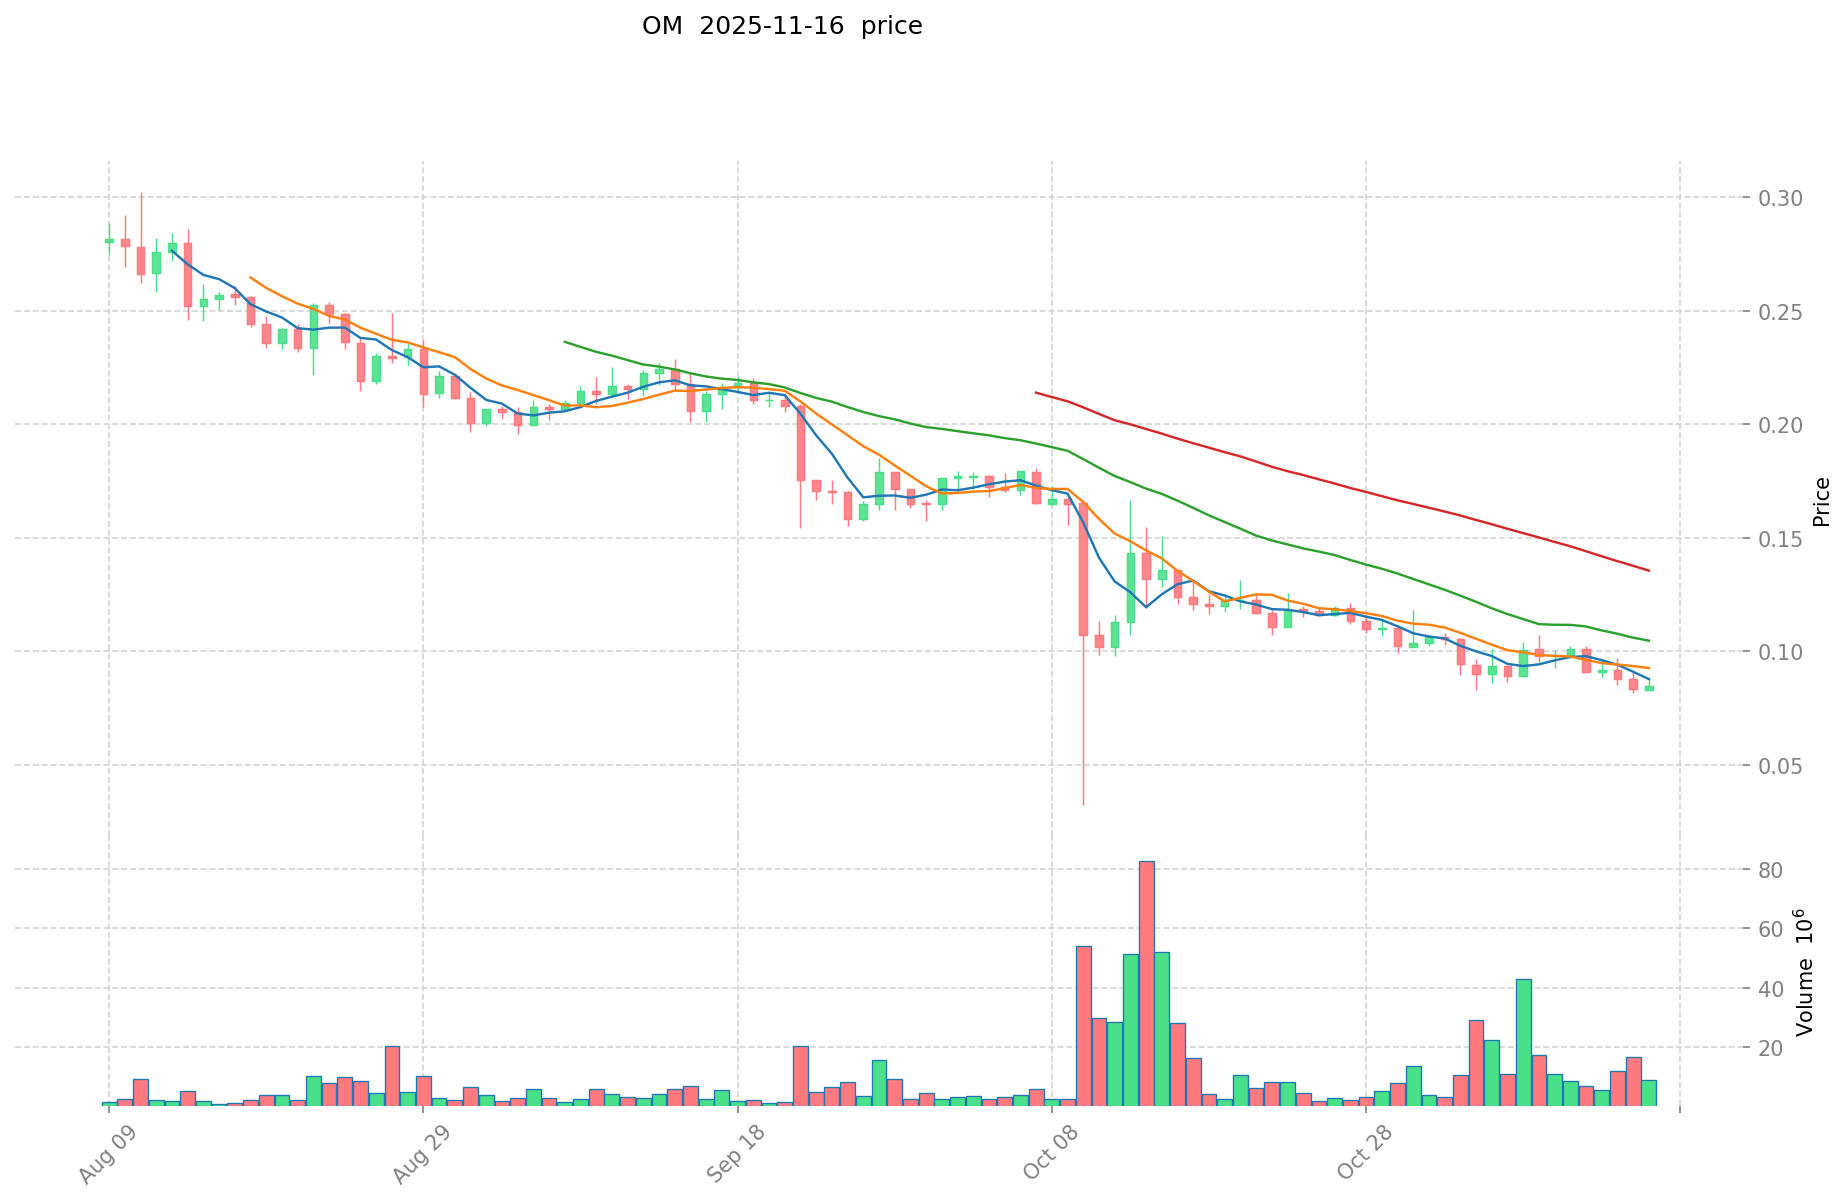
As of November 16, 2025, OM is trading at $0.08453, ranking 391st in the cryptocurrency market. The token has seen a 24-hour decline of 2.79%, with a trading volume of $341,438.46147. OM's market capitalization stands at $94,428,987.72, representing a 0.0042% share of the total cryptocurrency market.
The token is currently experiencing bearish pressure across multiple timeframes. Over the past week, OM has declined by 12.01%, and the 30-day performance shows a significant drop of 30.94%. The yearly performance is particularly stark, with a 96.56% decrease, indicating a challenging long-term trend for the token.
Despite these downward trends, OM has shown a slight positive movement of 0.06% in the last hour, suggesting some short-term buying interest. The token is trading above its all-time low but remains significantly below its all-time high, presenting a mixed picture for investors and traders.
The current circulating supply of OM is 1,117,106,207.55015 tokens, with a total supply of 1,718,988,634.074746. The project has no maximum supply limit, which could potentially impact long-term token value depending on emission rates and demand.
Click to view the current OM market price
OM Market Sentiment Index
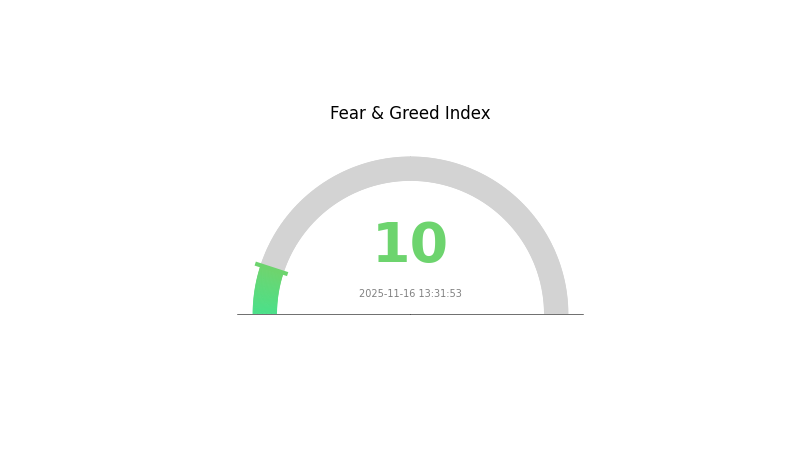
2025-11-16 Fear and Greed Index: 10 (Extreme Fear)
Click to view the current Fear & Greed Index
The crypto market is gripped by extreme fear, with the sentiment index plummeting to 10. This level of pessimism often precedes significant market movements. Historically, such extreme fear has presented buying opportunities for long-term investors. However, caution is advised as market volatility may persist. Traders should consider risk management strategies and avoid making impulsive decisions based solely on emotions. As always, thorough research and diversification remain crucial in navigating these uncertain market conditions.
OM Holdings Distribution
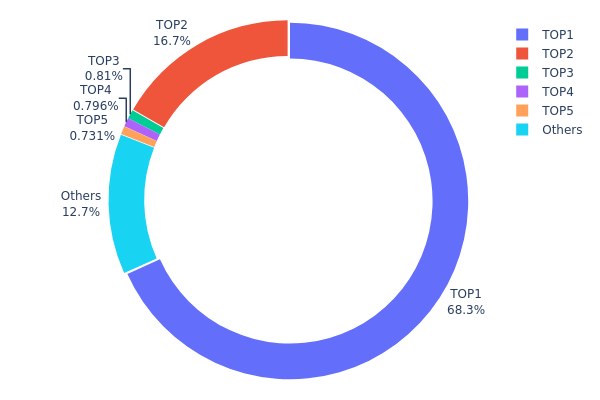
The address holdings distribution data provides critical insights into the concentration of OM tokens across various addresses. Notably, the top address, likely a burn address (0x0000...00dead), holds 68.28% of the total supply, effectively removing these tokens from circulation. The second-largest holder possesses 16.68%, indicating a significant concentration of power.
This distribution pattern reveals a high level of centralization, with the top two addresses controlling 84.96% of the total supply. Such concentration could potentially impact market dynamics, as large movements from these addresses might lead to substantial price volatility. The remaining 15.04% is distributed among other addresses, with the next three largest holders each owning less than 1% of the supply.
This centralized structure suggests a relatively low level of decentralization in OM's on-chain ecosystem. While the large burn address contributes to scarcity, the concentration in the second-largest address may raise concerns about market manipulation risks and overall token distribution fairness.
Click to view the current OM Holdings Distribution
| Top | Address | Holding Qty | Holding (%) |
|---|---|---|---|
| 1 | 0x0000...00dead | 606958.10K | 68.28% |
| 2 | 0x073f...113ad7 | 148307.31K | 16.68% |
| 3 | 0x9e15...feba93 | 7204.21K | 0.81% |
| 4 | 0x85f1...917c79 | 7071.90K | 0.79% |
| 5 | 0x53b9...e4cf5c | 6500.00K | 0.73% |
| - | Others | 112847.37K | 12.71% |
II. Key Factors Affecting OM's Future Price
Macroeconomic Environment
- Impact of Monetary Policy: Major central banks are expected to maintain a cautious approach to interest rates, which could indirectly influence cryptocurrency markets including OM.
- Hedge Against Inflation: As cryptocurrencies gain more mainstream acceptance, OM may be viewed as a potential hedge against inflation, similar to other digital assets.
- Geopolitical Factors: Global political tensions and economic uncertainties could drive investors towards alternative assets like OM as a means of diversification.
Technological Development and Ecosystem Building
- Ecosystem Applications: OM's ecosystem is likely to continue expanding with the development of DApps and other blockchain-based projects, potentially increasing its utility and value proposition.
III. OM Price Prediction for 2025-2030
2025 Outlook
- Conservative prediction: $0.07394 - $0.08402
- Neutral prediction: $0.08402 - $0.09000
- Optimistic prediction: $0.09000 - $0.09746 (requires positive market sentiment and project developments)
2027-2028 Outlook
- Market stage expectation: Potential growth phase with increased volatility
- Price range forecast:
- 2027: $0.07432 - $0.12767
- 2028: $0.08138 - $0.1282
- Key catalysts: Project milestones, market adoption, and overall crypto market trends
2029-2030 Long-term Outlook
- Base scenario: $0.11984 - $0.13062 (assuming steady project growth and market stability)
- Optimistic scenario: $0.14141 - $0.1894 (assuming strong project performance and favorable market conditions)
- Transformative scenario: Above $0.1894 (exceptional project breakthroughs and widespread adoption)
- 2030-12-31: OM $0.13062 (projected average price for 2030)
| 年份 | 预测最高价 | 预测平均价格 | 预测最低价 | 涨跌幅 |
|---|---|---|---|---|
| 2025 | 0.09746 | 0.08402 | 0.07394 | 0 |
| 2026 | 0.09982 | 0.09074 | 0.08257 | 7 |
| 2027 | 0.12767 | 0.09528 | 0.07432 | 12 |
| 2028 | 0.1282 | 0.11148 | 0.08138 | 31 |
| 2029 | 0.14141 | 0.11984 | 0.06471 | 41 |
| 2030 | 0.1894 | 0.13062 | 0.09405 | 54 |
IV. Professional Investment Strategies and Risk Management for OM
OM Investment Methodology
(1) Long-term Holding Strategy
- Suitable for: Conservative investors looking for long-term growth
- Operation suggestions:
- Accumulate OM tokens during market dips
- Set price targets for partial profit-taking
- Store tokens in a secure hardware wallet
(2) Active Trading Strategy
- Technical analysis tools:
- Moving Averages: Use to identify trends and potential entry/exit points
- RSI (Relative Strength Index): Monitor overbought/oversold conditions
- Key points for swing trading:
- Set stop-loss orders to manage downside risk
- Take profits at predetermined resistance levels
OM Risk Management Framework
(1) Asset Allocation Principles
- Conservative investors: 1-3% of crypto portfolio
- Aggressive investors: 5-8% of crypto portfolio
- Professional investors: 10-15% of crypto portfolio
(2) Risk Hedging Solutions
- Diversification: Spread investments across multiple crypto assets
- Stop-loss orders: Implement to limit potential losses
(3) Secure Storage Solutions
- Hot wallet recommendation: Gate web3 Wallet
- Cold storage solution: Hardware wallet for long-term holdings
- Security precautions: Enable two-factor authentication, use strong passwords
V. Potential Risks and Challenges for OM
OM Market Risks
- High volatility: OM price may experience significant fluctuations
- Market sentiment: Influenced by overall crypto market trends
- Competition: Other RWA Layer 1 projects may impact OM's market share
OM Regulatory Risks
- Regulatory uncertainty: Changing regulations may affect OM's operations
- Compliance requirements: Increased regulatory scrutiny in the RWA space
- Cross-border restrictions: Potential limitations on international transactions
OM Technical Risks
- Smart contract vulnerabilities: Potential for exploits or bugs
- Scalability challenges: Ability to handle increased network load
- Interoperability issues: Compatibility with other blockchain networks
VI. Conclusion and Action Recommendations
OM Investment Value Assessment
OM presents a unique value proposition as a security-focused RWA Layer 1 blockchain. While it offers potential for long-term growth, short-term volatility and regulatory uncertainties pose significant risks.
OM Investment Recommendations
✅ Beginners: Start with small investments, focus on learning the technology ✅ Experienced investors: Consider a balanced approach with regular DCA ✅ Institutional investors: Conduct thorough due diligence, monitor regulatory developments
OM Trading Participation Methods
- Spot trading: Buy and sell OM tokens on Gate.com
- Staking: Participate in OM staking programs if available
- DeFi integration: Explore DeFi opportunities within the MANTRA ecosystem
Cryptocurrency investments carry extremely high risks, and this article does not constitute investment advice. Investors should make decisions carefully based on their own risk tolerance and are advised to consult professional financial advisors. Never invest more than you can afford to lose.
FAQ
How high can an Om coin go?
Om coin has potential to reach $10 by 2026, driven by increased adoption and market demand. However, crypto markets are highly volatile and unpredictable.
Is om coin good investment?
Yes, OM coin shows potential for good returns. Its innovative technology and growing adoption in the Web3 space make it an attractive investment option for 2025 and beyond.
What is the future of om crypto?
OM crypto has potential for growth in the Web3 ecosystem. With increasing adoption and technological advancements, it may see higher value and utility by 2025.
What is the highest price OM coin has reached?
Based on historical data, OM coin reached its all-time high price of $0.76 on March 13, 2021.
Share
Content
Introduction: OM's Market Position and Investment Value
I. OM Price History Review and Current Market Status
II. Key Factors Affecting OM's Future Price
III. OM Price Prediction for 2025-2030
IV. Professional Investment Strategies and Risk Management for OM
V. Potential Risks and Challenges for OM
VI. Conclusion and Action Recommendations
FAQ

