2025 RED Price Prediction: Bullish Outlook as Blockchain Adoption Accelerates
Introduction: RED's Market Position and Investment Value
RedStone (RED), as the fastest-growing oracle and a leader in yield-bearing assets, has achieved significant milestones since its inception. As of 2025, RedStone's market capitalization has reached $82,569,633, with a circulating supply of approximately 292,696,325 tokens, and a price hovering around $0.2821. This asset, known as the "Oracle Pioneer in Yield-Bearing Assets," is playing an increasingly crucial role in providing actively validated services with restaking and covering various financial instruments such as LRTs, LSTs, and stablecoins.
This article will comprehensively analyze RedStone's price trends from 2025 to 2030, combining historical patterns, market supply and demand, ecosystem development, and macroeconomic factors to provide investors with professional price predictions and practical investment strategies.
I. RED Price History and Current Market Status
RED Historical Price Evolution
- 2025: Initial launch on September 5, price reached all-time high of $0.9771
- 2025: Market correction in June, price dropped to all-time low of $0.2316
RED Current Market Situation
As of November 17, 2025, RED is trading at $0.2821, experiencing a 3.35% decrease in the last 24 hours. The token's market capitalization stands at $82,569,633, ranking it 419th in the overall cryptocurrency market. RED's trading volume in the past 24 hours is $49,227.79.
RED has shown significant volatility in recent periods:
- 1-hour change: -1.84%
- 7-day change: -15.49%
- 30-day change: -19.45%
- 1-year change: -29.14%
The current price represents a 71.12% decrease from its all-time high and is 21.81% above its all-time low. With a circulating supply of 292,696,325 RED tokens out of a total supply of 1,000,000,000, the token has a circulating ratio of 29.27%.
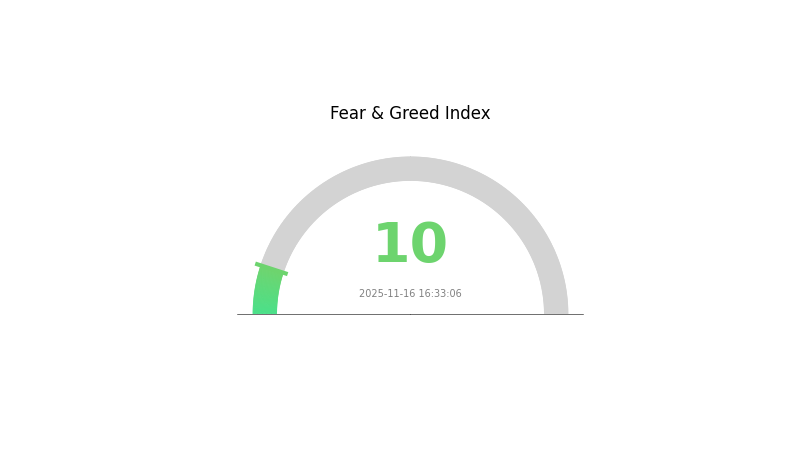
The broader market sentiment, as indicated by the VIX index at 10, suggests an "Extreme Fear" environment, which may be influencing RED's price performance.
Click to view the current RED market price

RED Market Sentiment Indicator
2025-11-16 Fear and Greed Index: 10 (Extreme Fear)
Click to view the current Fear & Greed Index
The crypto market is gripped by extreme fear, with the sentiment index plummeting to a mere 10. This rock-bottom reading suggests widespread pessimism among investors, potentially signaling a market bottoming out. However, savvy traders often view such extreme fear as a contrarian buy signal, following the adage "be greedy when others are fearful." As always, it's crucial to conduct thorough research and manage risk carefully before making any investment decisions in this volatile market environment.
RED Holdings Distribution
The address holdings distribution data provides crucial insights into the concentration of RED tokens among different wallet addresses. Analysis of this data reveals a significant level of centralization within the RED token ecosystem. The top 5 addresses collectively hold 50.79% of the total supply, with the largest holder possessing 13.85% of all tokens.
This concentration pattern raises concerns about potential market manipulation and price volatility. With such a substantial portion of tokens controlled by a small number of addresses, there's an increased risk of large-scale sell-offs or coordinated actions that could dramatically impact RED's market dynamics. The high concentration also suggests a lower degree of decentralization, which may be at odds with the principles of many blockchain projects.
Despite these concerns, it's worth noting that nearly half (49.21%) of the tokens are distributed among other addresses, indicating some level of broader participation. However, the overall structure points to a market that may be susceptible to sudden shifts based on the actions of a few key players, potentially affecting the token's stability and long-term prospects.
Click to view the current RED Holdings Distribution
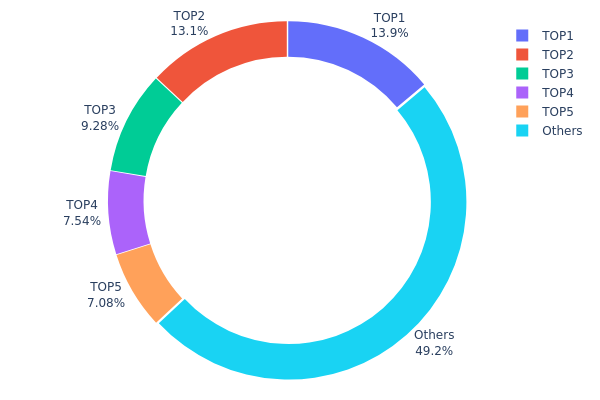
| Top | Address | Holding Qty | Holding (%) |
|---|---|---|---|
| 1 | 0xa77e...d51b2e | 82727.28K | 13.85% |
| 2 | 0xb286...d3a654 | 78000.00K | 13.06% |
| 3 | 0xf39e...892dec | 55374.95K | 9.27% |
| 4 | 0xba54...031ff7 | 45000.00K | 7.53% |
| 5 | 0x7ab8...415a5b | 42278.17K | 7.08% |
| - | Others | 293619.60K | 49.21% |
II. Key Factors Affecting RED's Future Price
Supply Mechanism
- Token Burn: Regular token burning events to reduce supply and potentially increase scarcity.
- Historical Pattern: Previous token burns have generally led to short-term price increases.
- Current Impact: The upcoming token burn is expected to create positive price pressure.
Institutional and Whale Dynamics
- Institutional Holdings: Several major crypto investment firms have been accumulating RED tokens.
- Enterprise Adoption: A number of fintech startups have begun integrating RED into their payment systems.
Macroeconomic Environment
- Monetary Policy Impact: Central banks are expected to maintain a cautious stance, potentially driving investors towards crypto assets.
- Inflation Hedging Properties: RED has shown some correlation with inflation rates, positioning it as a potential hedge.
Technological Development and Ecosystem Building
- Network Upgrade: An upcoming upgrade aims to improve transaction speed and reduce fees.
- Ecosystem Applications: Several DeFi protocols and NFT marketplaces are being developed on the RED network.
III. RED Price Prediction for 2025-2030
2025 Outlook
- Conservative forecast: $0.26133 - $0.28100
- Neutral forecast: $0.28100 - $0.28943
- Optimistic forecast: $0.28943 - $0.30000 (requires broader crypto market recovery)
2027-2028 Outlook
- Market phase expectation: Potential growth phase with increasing adoption
- Price range prediction:
- 2027: $0.25327 - $0.4552
- 2028: $0.31101 - $0.45057
- Key catalysts: Increased utility of RED token, potential partnerships, and overall cryptocurrency market trends
2029-2030 Long-term Outlook
- Base scenario: $0.42465 - $0.49047 (assuming steady growth in RED ecosystem)
- Optimistic scenario: $0.55629 - $0.65232 (with significant adoption and market expansion)
- Transformative scenario: $0.70000 - $0.80000 (with major breakthroughs in RED technology and mass adoption)
- 2030-12-31: RED $0.65232 (potential peak price based on optimistic projections)
| 年份 | 预测最高价 | 预测平均价格 | 预测最低价 | 涨跌幅 |
|---|---|---|---|---|
| 2025 | 0.28943 | 0.281 | 0.26133 | 0 |
| 2026 | 0.3993 | 0.28522 | 0.21962 | 1 |
| 2027 | 0.4552 | 0.34226 | 0.25327 | 21 |
| 2028 | 0.45057 | 0.39873 | 0.31101 | 41 |
| 2029 | 0.55629 | 0.42465 | 0.22506 | 50 |
| 2030 | 0.65232 | 0.49047 | 0.33842 | 73 |
IV. Professional Investment Strategies and Risk Management for RED
RED Investment Methodology
(1) Long-term Holding Strategy
- Suitable for: Long-term investors with high risk tolerance
- Operation suggestions:
- Accumulate RED tokens during market dips
- Set price targets and regularly review portfolio
- Store tokens in secure hardware wallets
(2) Active Trading Strategy
- Technical analysis tools:
- Moving Averages: Monitor short-term and long-term trends
- RSI (Relative Strength Index): Identify overbought or oversold conditions
- Key points for swing trading:
- Monitor oracle market developments and RedStone's partnerships
- Set stop-loss orders to manage downside risk
RED Risk Management Framework
(1) Asset Allocation Principles
- Conservative investors: 1-3% of crypto portfolio
- Aggressive investors: 5-10% of crypto portfolio
- Professional investors: Up to 15% of crypto portfolio
(2) Risk Hedging Solutions
- Diversification: Spread investments across different oracle projects
- Options strategies: Use options to protect against downside risk
(3) Secure Storage Solutions
- Hot wallet recommendation: Gate Web3 wallet
- Cold storage solution: Hardware wallets for long-term holding
- Security precautions: Enable two-factor authentication, use unique passwords
V. Potential Risks and Challenges for RED
RED Market Risks
- Volatility: Cryptocurrency market's inherent price fluctuations
- Competition: Intense competition in the oracle space
- Adoption: Potential challenges in gaining widespread usage
RED Regulatory Risks
- Regulatory uncertainty: Evolving global regulations on cryptocurrencies
- Legal compliance: Potential issues with oracle data usage in different jurisdictions
- Tax implications: Unclear tax treatment of oracle tokens in some countries
RED Technical Risks
- Smart contract vulnerabilities: Potential bugs in the RedStone protocol
- Network congestion: Ethereum network issues affecting RedStone's performance
- Oracle failure: Risk of inaccurate or manipulated data feeds
VI. Conclusion and Action Recommendations
RED Investment Value Assessment
RedStone (RED) shows promise as a fast-growing oracle project with unique features like actively validated services and restaking. However, it faces significant competition and regulatory uncertainties in the evolving blockchain landscape.
RED Investment Recommendations
✅ Beginners: Consider small, experimental positions after thorough research ✅ Experienced investors: Implement dollar-cost averaging strategy with strict risk management ✅ Institutional investors: Evaluate RED as part of a diversified oracle and DeFi portfolio
RED Trading Participation Methods
- Spot trading: Buy and hold RED tokens on Gate.com
- Staking: Participate in RedStone's staking programs if available
- DeFi integration: Use RED tokens in compatible DeFi protocols for additional yield opportunities
Cryptocurrency investments carry extremely high risks, and this article does not constitute investment advice. Investors should make decisions carefully based on their own risk tolerance and are advised to consult professional financial advisors. Never invest more than you can afford to lose.
FAQ
Is red coin a good investment?
Yes, RED coin shows potential for growth in the Web3 space. Its innovative features and increasing adoption make it an attractive investment option for 2025 and beyond.
Which crypto will reach $1000 in 2030?
Bitcoin is the most likely cryptocurrency to reach $1000 by 2030, with Ethereum also having a strong chance. Other potential candidates include Cardano, Solana, and Polkadot, depending on their technological advancements and adoption rates.
What is the future of red crypto?
RED crypto's future looks promising, with potential for significant growth and adoption in the Web3 ecosystem. Its innovative features and strong community support suggest it could become a major player in decentralized finance by 2026.
Is RedStone a good long-term investment?
Yes, RedStone shows potential for long-term growth. Its innovative oracle solutions and partnerships in the DeFi space position it well for future success in the evolving crypto market.
Share
Content
Introduction: RED's Market Position and Investment Value
I. RED Price History and Current Market Status
II. Key Factors Affecting RED's Future Price
III. RED Price Prediction for 2025-2030
IV. Professional Investment Strategies and Risk Management for RED
V. Potential Risks and Challenges for RED
VI. Conclusion and Action Recommendations
FAQ

