2025 RENDER Price Prediction: Analyzing Market Trends and Potential Growth Factors for the Digital Asset
Introduction: RENDER's Market Position and Investment Value
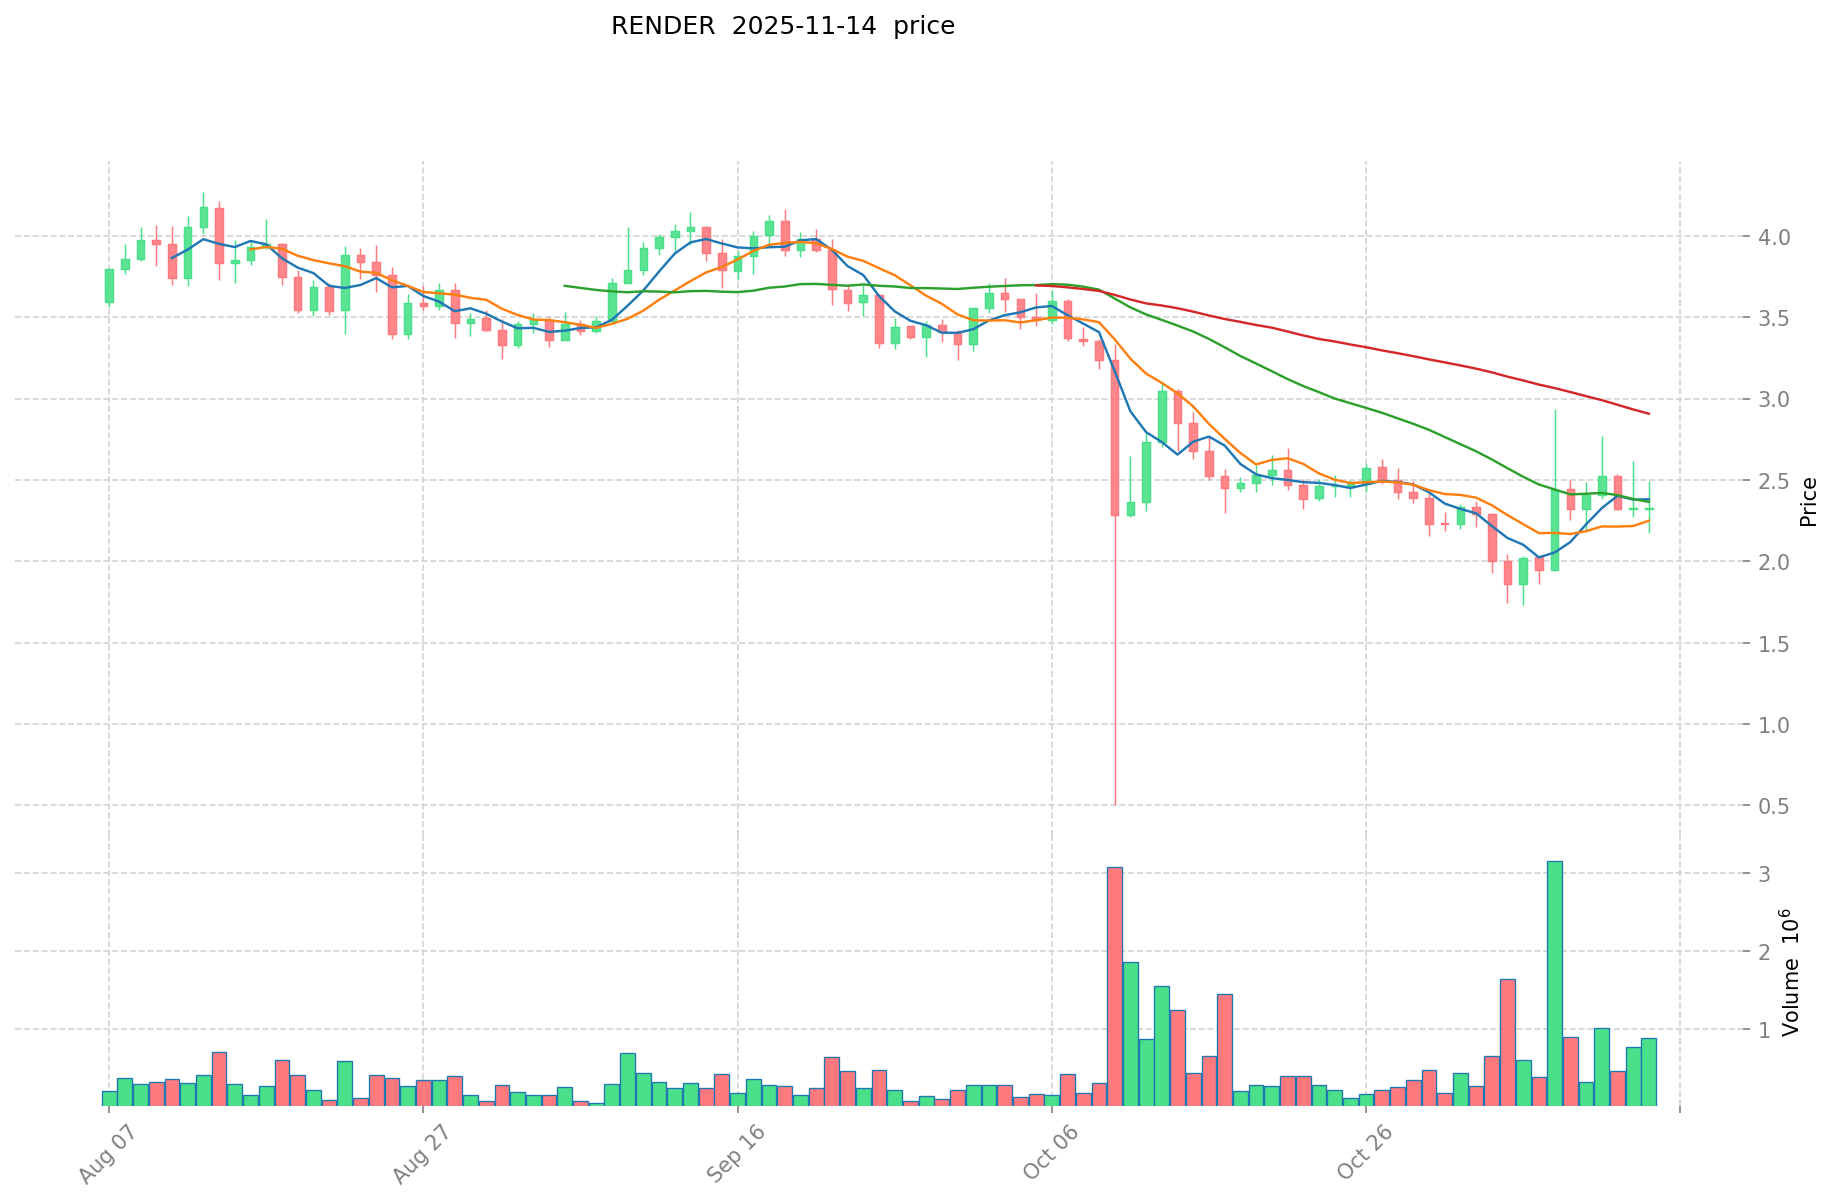
Render Network (RENDER) has established itself as a decentralized GPU rendering platform since its inception. As of 2025, RENDER's market capitalization has reached $1.14 billion, with a circulating supply of approximately 518.58 million tokens and a price hovering around $2.199. This asset, often referred to as the "GPU rendering revolution," is playing an increasingly crucial role in 3D rendering and emerging GPU-intensive applications.
This article will comprehensively analyze RENDER's price trends from 2025 to 2030, considering historical patterns, market supply and demand, ecosystem development, and macroeconomic factors to provide investors with professional price predictions and practical investment strategies.
I. RENDER Price History Review and Current Market Status
RENDER Historical Price Evolution
- 2020: RENDER launched, price fluctuated around $0.04
- 2021: Bull market surge, price reached all-time high of $13.60 on March 18, 2024
- 2025: Market correction, price dropped to current level of $2.20
RENDER Current Market Situation
RENDER is currently trading at $2.199, ranking 82nd by market capitalization. The 24-hour trading volume is $2,068,255.98. RENDER has experienced a slight decline of 0.09% in the past 24 hours. The current price is 83.83% below its all-time high of $13.60, reached on March 18, 2024. The market capitalization stands at $1.14 billion, with a circulating supply of 518,584,616 RENDER tokens. The token's price has seen significant declines across various timeframes, with a 13.66% drop in the past week and an 18.8% decrease over the last month. The long-term performance shows a substantial 68.78% decline over the past year.
Click to view the current RENDER market price
RENDER Market Sentiment Indicator
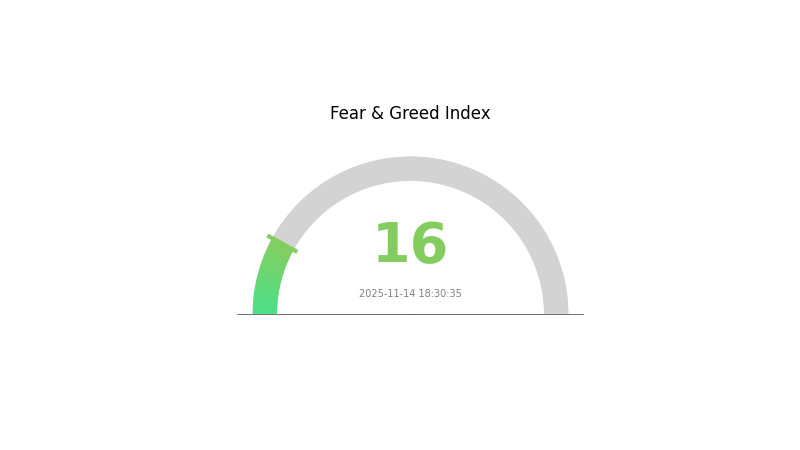
2025-11-14 Fear and Greed Index: 16 (Extreme Fear)
Click to view the current Fear & Greed Index
The crypto market is currently gripped by extreme fear, with the Fear and Greed Index plummeting to 16. This indicates a highly pessimistic sentiment among investors, potentially signaling oversold conditions. While such extreme fear often precedes market bottoms, it's crucial to approach with caution. Savvy traders might see this as an opportunity to accumulate, adhering to the adage "be fearful when others are greedy, and greedy when others are fearful." However, always conduct thorough research and manage risks carefully in these volatile times.
RENDER Holdings Distribution
The address holdings distribution data reveals significant concentration in RENDER token ownership. The top address holds 18.82% of the total supply, while the top 5 addresses collectively control 39.34% of RENDER tokens. This level of concentration indicates a relatively centralized distribution, which could potentially impact market dynamics.
Such concentration may lead to increased volatility and susceptibility to price manipulation. Large holders, often referred to as "whales," have the capacity to influence market movements through substantial buy or sell orders. However, it's noteworthy that 60.66% of tokens are distributed among other addresses, suggesting some level of wider participation in the RENDER ecosystem.
This distribution pattern reflects a moderate level of decentralization, with a balance between major stakeholders and a broader user base. While the concentration in top addresses may raise concerns about market stability, the significant portion held by other addresses indicates a growing ecosystem. Monitoring changes in this distribution over time will be crucial for assessing RENDER's long-term market structure and on-chain stability.
Click to view the current RENDER holdings distribution
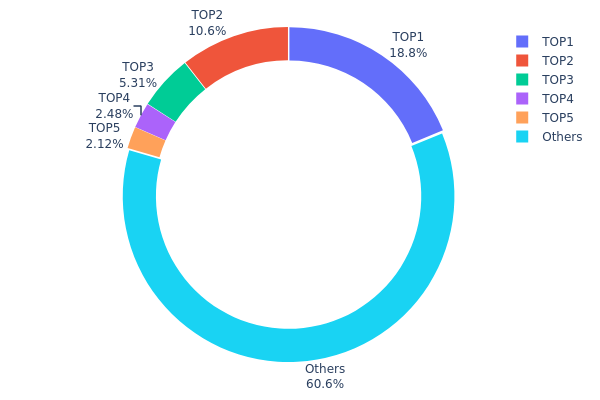
| Top | Address | Holding Qty | Holding (%) |
|---|---|---|---|
| 1 | AZB72t...m2qAdC | 88576.39K | 18.82% |
| 2 | 9WzDXw...YtAWWM | 49937.83K | 10.61% |
| 3 | CPj5Jg...SXKrvv | 25000.04K | 5.31% |
| 4 | AXbamD...PFJPaT | 11687.46K | 2.48% |
| 5 | 3gd3dq...hCkW2u | 9987.43K | 2.12% |
| - | Others | 285411.79K | 60.66% |
II. Key Factors Affecting RENDER's Future Price
Supply Mechanism
- Fixed Supply: RENDER has a fixed maximum supply of 536,870,912 tokens.
- Historical Pattern: The limited supply has historically contributed to price stability and potential appreciation as demand increases.
- Current Impact: As the circulating supply approaches the maximum, scarcity may drive price appreciation if demand remains strong.
Technical Development and Ecosystem Building
- Network Upgrades: Continuous improvements to the Render Network's infrastructure to enhance performance and scalability.
- Ecosystem Applications: Growing adoption in 3D rendering, visual effects, and AI-generated content creation industries.
III. RENDER Price Prediction for 2025-2030
2025 Outlook
- Conservative prediction: $1.55 - $2.00
- Neutral prediction: $2.00 - $2.50
- Optimistic prediction: $2.50 - $3.19 (requires positive market sentiment and increased adoption)
2027 Mid-term Outlook
- Market stage expectation: Potential growth phase with increased volatility
- Price range forecast:
- 2026: $2.34 - $3.09
- 2027: $2.60 - $3.00
- Key catalysts: Technological advancements in rendering technology, expanding use cases in VR/AR industries
2030 Long-term Outlook
- Base scenario: $3.75 - $4.50 (assuming steady market growth and adoption)
- Optimistic scenario: $4.50 - $5.89 (with accelerated adoption in gaming and entertainment sectors)
- Transformative scenario: $5.89+ (breakthroughs in decentralized rendering capabilities)
- 2030-12-31: RENDER $5.89 (potential peak price based on optimistic projections)
| 年份 | 预测最高价 | 预测平均价格 | 预测最低价 | 涨跌幅 |
|---|---|---|---|---|
| 2025 | 3.1901 | 2.185 | 1.55135 | 0 |
| 2026 | 3.09068 | 2.68755 | 2.33817 | 22 |
| 2027 | 3.00468 | 2.88912 | 2.6002 | 31 |
| 2028 | 3.88991 | 2.9469 | 2.41646 | 33 |
| 2029 | 4.81995 | 3.4184 | 3.00819 | 55 |
| 2030 | 5.89042 | 4.11917 | 3.74845 | 87 |
IV. RENDER Professional Investment Strategies and Risk Management
RENDER Investment Methodology
(1) Long-term Holding Strategy
- Suitable for: Long-term investors and believers in decentralized GPU computing
- Operational suggestions:
- Accumulate RENDER tokens during market dips
- Stay updated on Render Network's technological advancements and partnerships
- Store tokens securely in a non-custodial wallet
(2) Active Trading Strategy
- Technical analysis tools:
- Moving Averages: Use to identify trends and potential reversal points
- Relative Strength Index (RSI): Monitor overbought/oversold conditions
- Key points for swing trading:
- Monitor GPU computing demand and industry trends
- Pay attention to major project announcements and upgrades
RENDER Risk Management Framework
(1) Asset Allocation Principles
- Conservative investors: 1-3% of crypto portfolio
- Aggressive investors: 5-10% of crypto portfolio
- Professional investors: Up to 15% of crypto portfolio
(2) Risk Hedging Solutions
- Diversification: Balance RENDER with other crypto and traditional assets
- Stop-loss orders: Set appropriate levels to limit potential losses
(3) Secure Storage Solutions
- Hot wallet recommendation: Gate web3 Wallet
- Cold storage solution: Hardware wallet for long-term holding
- Security precautions: Use two-factor authentication, regular security audits
V. RENDER Potential Risks and Challenges
RENDER Market Risks
- Volatility: Crypto market fluctuations can lead to significant price swings
- Competition: Other decentralized GPU computing projects may emerge
- Adoption risk: Slow uptake by 3D rendering and AI industries could impact growth
RENDER Regulatory Risks
- Uncertain regulations: Changes in crypto regulations could affect RENDER's operations
- Cross-border compliance: Varying international laws may limit global expansion
- Tax implications: Evolving tax laws on crypto assets may impact investors
RENDER Technical Risks
- Network security: Potential vulnerabilities in the decentralized network
- Scalability challenges: Ensuring network can handle increased demand
- Technology obsolescence: Rapid advancements in GPU technology could outpace the network
VI. Conclusion and Action Recommendations
RENDER Investment Value Assessment
RENDER presents a unique value proposition in the decentralized GPU computing space, with potential for long-term growth. However, short-term volatility and adoption challenges pose significant risks.
RENDER Investment Recommendations
✅ Beginners: Start with small positions, focus on learning about the technology ✅ Experienced investors: Consider a balanced approach, combining long-term holding with strategic trading ✅ Institutional investors: Conduct thorough due diligence, potentially explore partnerships with the Render Network
RENDER Trading Participation Methods
- Spot trading: Buy and sell RENDER tokens on Gate.com
- Staking: Participate in staking programs if available to earn passive income
- DeFi integration: Explore decentralized finance options involving RENDER tokens
Cryptocurrency investments carry extremely high risks, and this article does not constitute investment advice. Investors should make decisions carefully based on their own risk tolerance and are advised to consult professional financial advisors. Never invest more than you can afford to lose.
FAQ
Will render reach $100?
While ambitious, $100 is possible for RENDER in the long term with continued adoption and market growth. However, it would require significant industry developments and overall crypto market expansion.
Does render crypto have a future?
Yes, RENDER crypto has a promising future. Its innovative technology and growing adoption in the 3D rendering industry position it well for long-term success and potential value appreciation.
What will render be worth in 2030?
Based on market trends and potential growth, RENDER could reach $15-$20 by 2030, driven by increased adoption of decentralized rendering solutions.
Is render a strong buy?
Yes, Render appears to be a strong buy. Its innovative technology and growing adoption in the Web3 space suggest potential for significant price appreciation in the coming years.
Share
Content
Introduction: RENDER's Market Position and Investment Value
I. RENDER Price History Review and Current Market Status
II. Key Factors Affecting RENDER's Future Price
III. RENDER Price Prediction for 2025-2030
IV. RENDER Professional Investment Strategies and Risk Management
V. RENDER Potential Risks and Challenges
VI. Conclusion and Action Recommendations
FAQ

