AMP vs QNT: The Battle for Cryptocurrency Market Dominance in 2023
Introduction: Investment Comparison of AMP vs QNT
In the cryptocurrency market, the comparison between AMP vs QNT has always been an unavoidable topic for investors. The two not only show significant differences in market cap ranking, application scenarios, and price performance, but also represent different positioning in crypto assets.
AMP (AMP): Since its launch in 2020, it has gained market recognition for its role as a collateral token in the Flexa payment network.
QNT (QNT): Introduced in 2018, it has been hailed as a solution for blockchain interoperability, and is one of the leading projects in enterprise blockchain adoption.
This article will comprehensively analyze the investment value comparison between AMP vs QNT, focusing on historical price trends, supply mechanisms, institutional adoption, technological ecosystems, and future predictions, attempting to answer the question investors care about most:
"Which is the better buy right now?"
I. Price History Comparison and Current Market Status
AMP and QNT Historical Price Trends
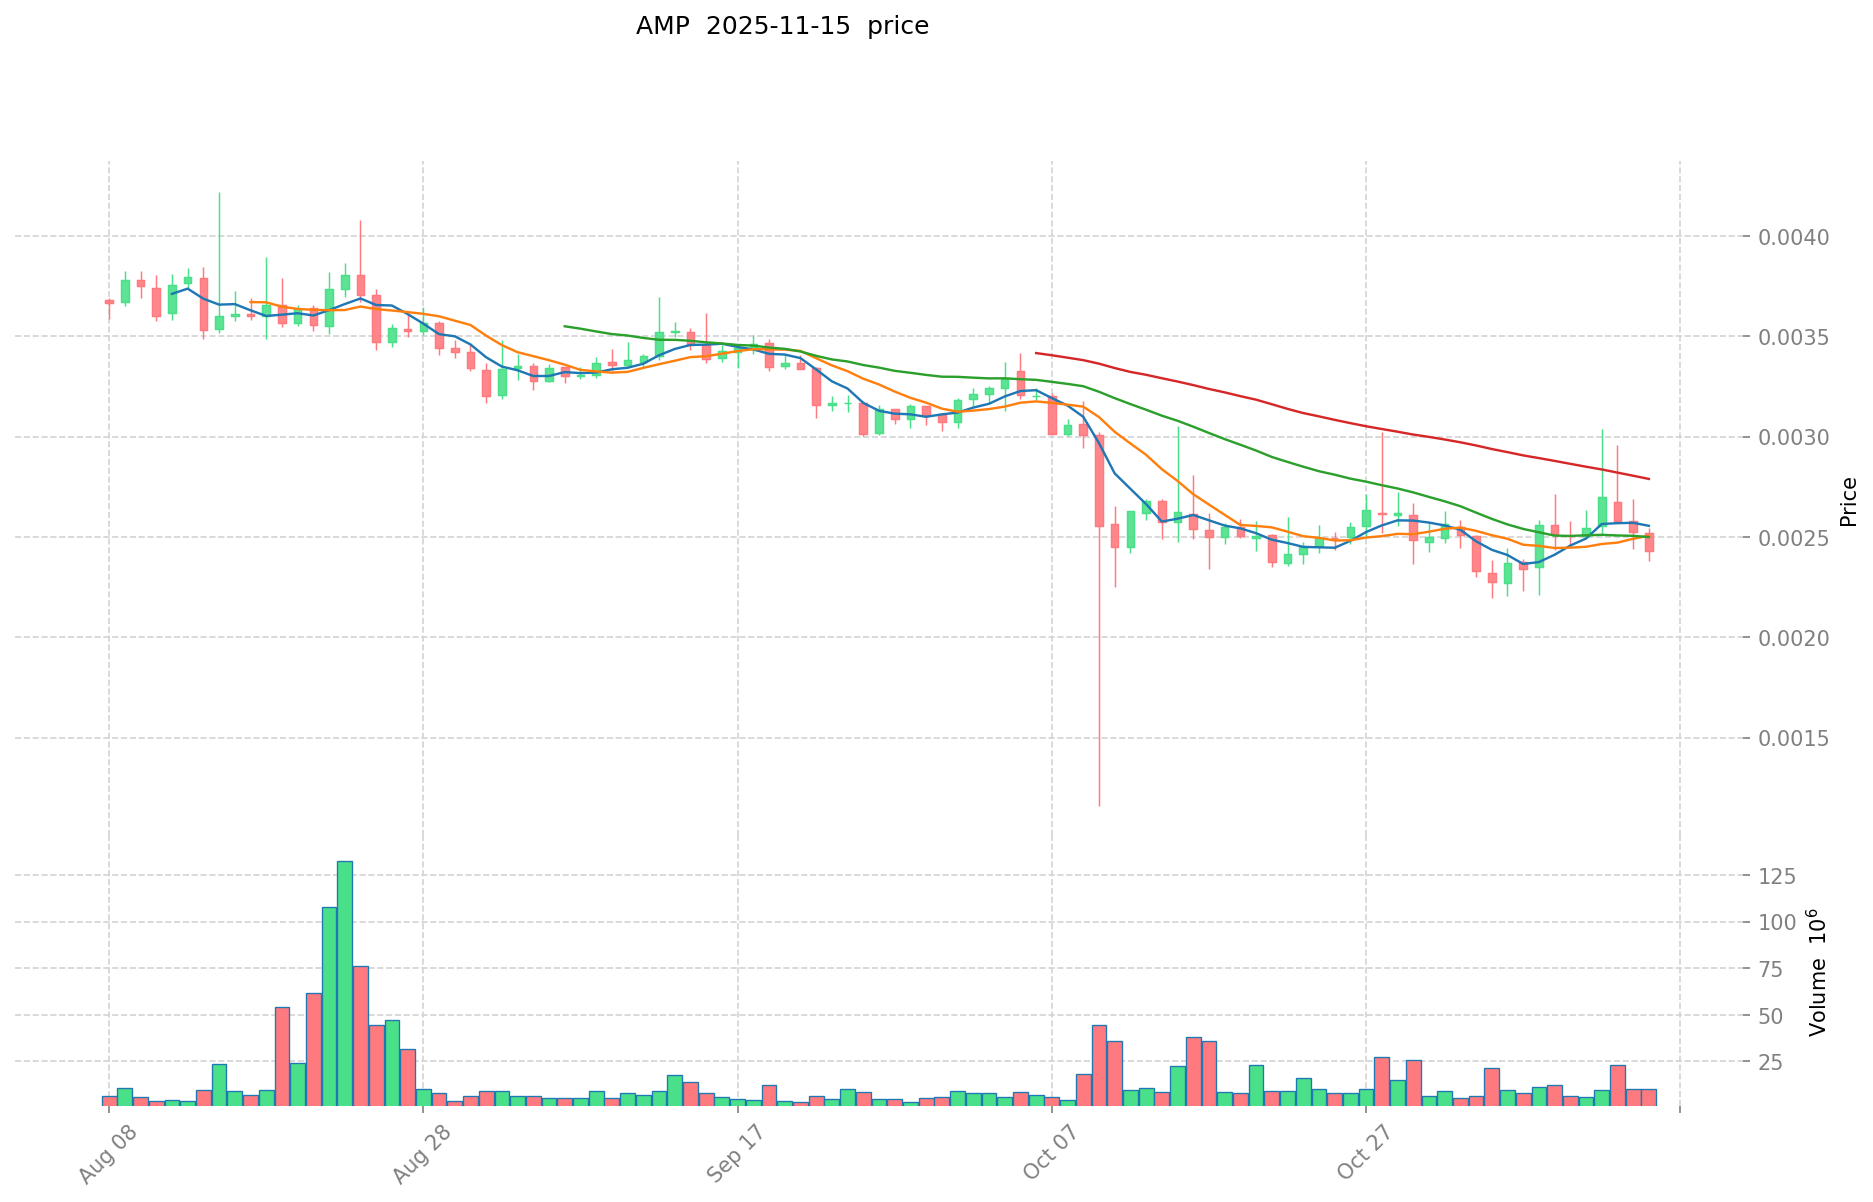
- 2021: AMP reached its all-time high of $0.120813 on June 17, 2021.
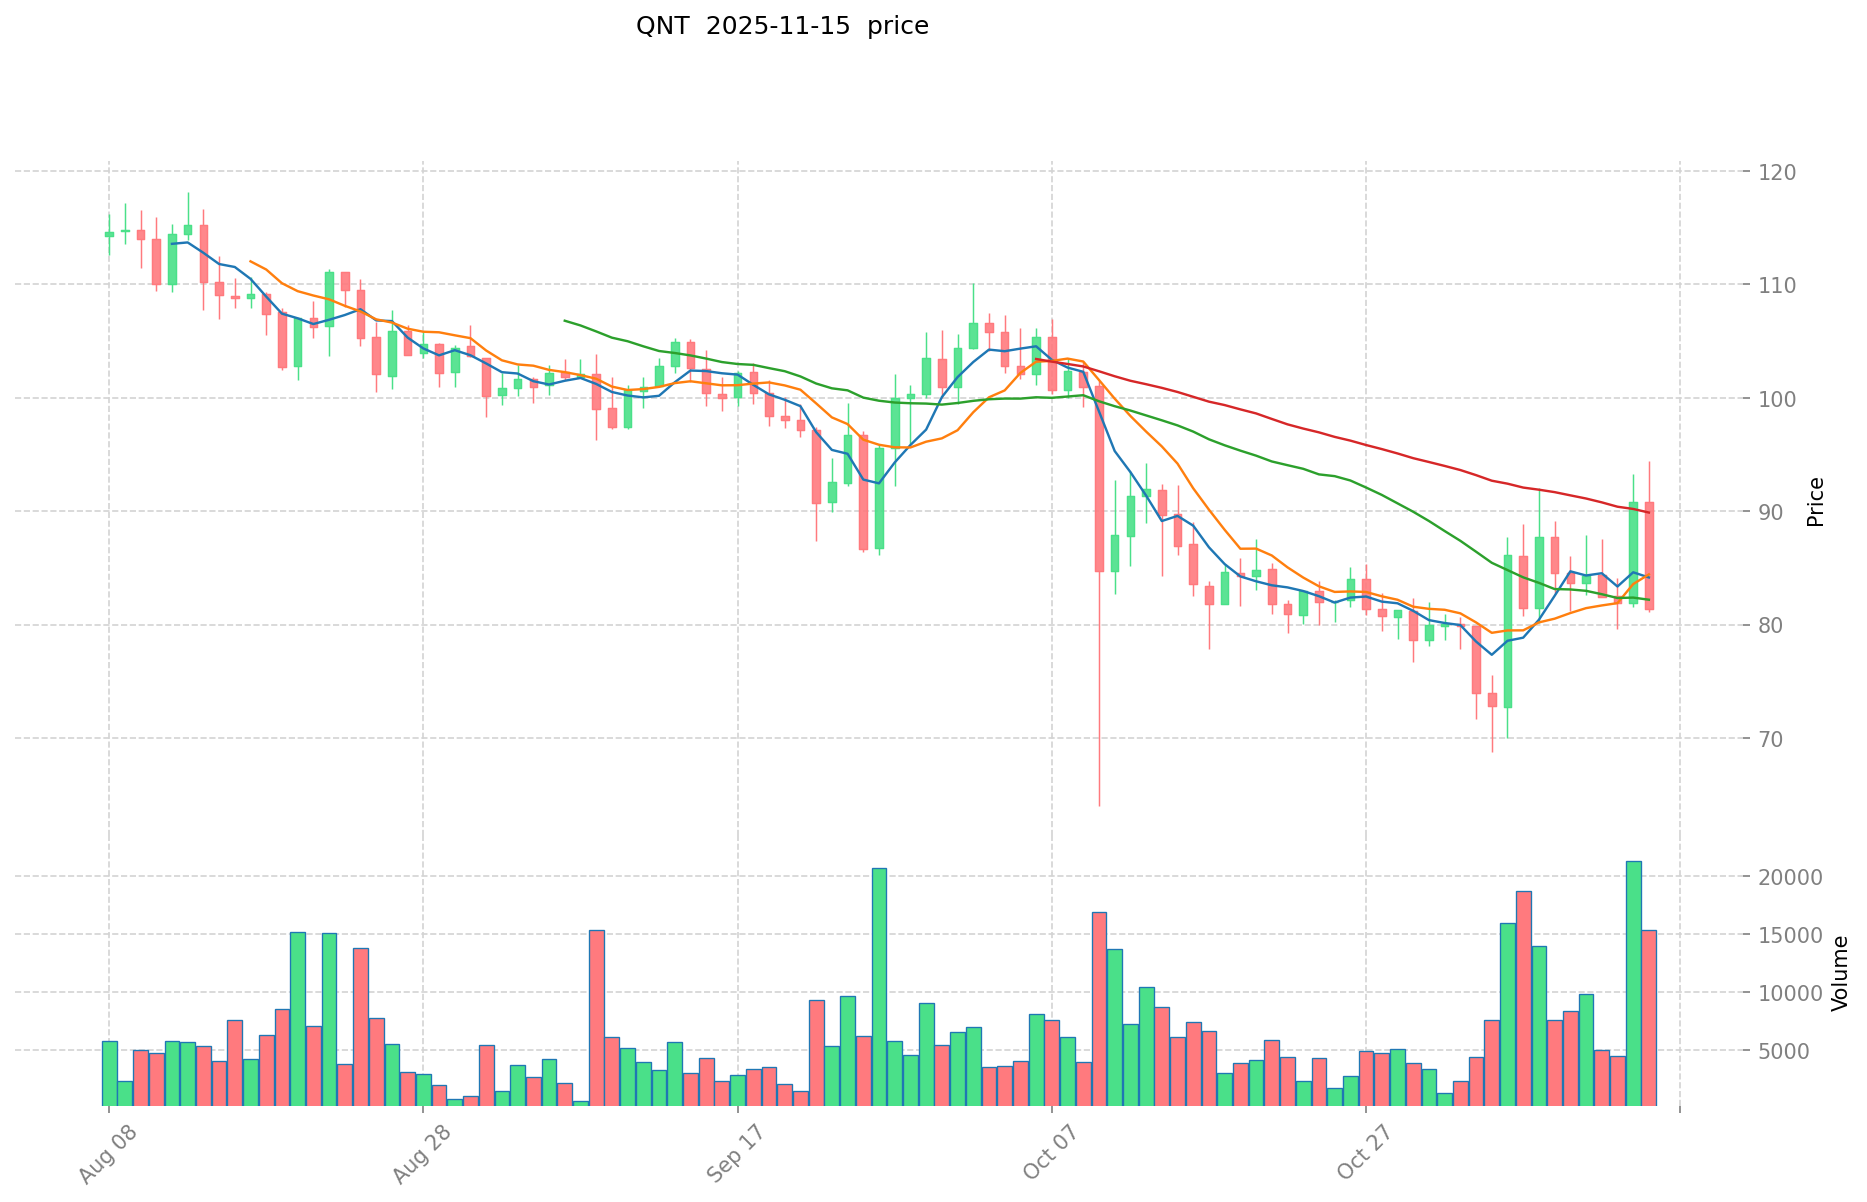
- 2021: QNT hit its all-time high of $427.42 on September 11, 2021.
- Comparative analysis: AMP has fallen from its all-time high to a current price of $0.002454, while QNT has shown more resilience, currently trading at $83.02.
Current Market Situation (2025-11-16)
- AMP current price: $0.002454
- QNT current price: $83.02
- 24-hour trading volume: AMP $33,687.36 vs QNT $470,834.83
- Market Sentiment Index (Fear & Greed Index): 10 (Extreme Fear)
Click to view real-time prices:
- View AMP current price Market Price
- View QNT current price Market Price
II. Core Factors Affecting Investment Value of AMP vs QNT
Supply Mechanism Comparison (Tokenomics)
- AMP: Fixed maximum supply of 100 billion tokens, with approximately 92.5 billion currently in circulation
- QNT: Fixed supply of 14.6 million tokens, with no additional tokens to be created
- 📌 Historical pattern: Fixed supply models like QNT's tend to create stronger scarcity value, while AMP's larger supply requires significant adoption for price appreciation.
Institutional Adoption and Market Applications
- Institutional holdings: QNT appears more favored by institutions due to its enterprise focus and partnerships with major financial organizations
- Enterprise adoption: QNT has stronger positioning in interoperability solutions for financial institutions and central banks, while AMP focuses on collateralization for payments
- Regulatory attitudes: Both tokens have worked within regulatory frameworks, with QNT particularly focused on compliance for institutional adoption
Technical Development and Ecosystem Building
- AMP technical upgrades: Focused on enhancing the Flexa network's payment capabilities and expanding collateralization use cases
- QNT technical development: Continuing to enhance the Overledger OS that connects blockchains to existing networks and multiple DLTs
- Ecosystem comparison: QNT focuses on enterprise blockchain connectivity and interoperability, while AMP targets payment processing and merchant adoption through Flexa
Macroeconomic Factors and Market Cycles
- Inflation resistance: QNT potentially offers stronger inflation resistance due to its limited supply and enterprise adoption strategy
- Macroeconomic monetary policy: Interest rate changes likely affect both tokens, with QNT possibly showing more resilience due to its institutional positioning
- Geopolitical factors: QNT's focus on interoperability positions it well for cross-border transaction needs in various geopolitical scenarios
III. 2025-2030 Price Prediction: AMP vs QNT
Short-term Prediction (2025)
- AMP: Conservative $0.00175176 - $0.002433 | Optimistic $0.002433 - $0.00333321
- QNT: Conservative $74.241 - $82.49 | Optimistic $82.49 - $102.2876
Mid-term Prediction (2027)
- AMP may enter a growth phase, with an estimated price range of $0.002240172585 - $0.0040643131185
- QNT may enter a bullish market, with an estimated price range of $85.575126 - $154.0352268
- Key drivers: Institutional fund inflows, ETFs, ecosystem development
Long-term Prediction (2030)
- AMP: Base scenario $0.004489497875133 - $0.006644456855196 | Optimistic scenario $0.006644456855196+
- QNT: Base scenario $190.61074877845 - $221.108468583002 | Optimistic scenario $221.108468583002+
Disclaimer: This analysis is based on historical data and projections. Cryptocurrency markets are highly volatile and unpredictable. This information should not be construed as financial advice. Always conduct your own research before making investment decisions.
AMP:
| 年份 | 预测最高价 | 预测平均价格 | 预测最低价 | 涨跌幅 |
|---|---|---|---|---|
| 2025 | 0.00333321 | 0.002433 | 0.00175176 | 0 |
| 2026 | 0.0035173881 | 0.002883105 | 0.0015568767 | 17 |
| 2027 | 0.0040643131185 | 0.00320024655 | 0.002240172585 | 30 |
| 2028 | 0.003850216624305 | 0.00363227983425 | 0.00319640625414 | 47 |
| 2029 | 0.005237747520988 | 0.003741248229277 | 0.00351677333552 | 52 |
| 2030 | 0.006644456855196 | 0.004489497875133 | 0.002873278640085 | 82 |
QNT:
| 年份 | 预测最高价 | 预测平均价格 | 预测最低价 | 涨跌幅 |
|---|---|---|---|---|
| 2025 | 102.2876 | 82.49 | 74.241 | 0 |
| 2026 | 135.811536 | 92.3888 | 57.281056 | 11 |
| 2027 | 154.0352268 | 114.100168 | 85.575126 | 37 |
| 2028 | 180.99139149 | 134.0676974 | 122.001604634 | 61 |
| 2029 | 223.6919531119 | 157.529544445 | 94.517726667 | 89 |
| 2030 | 221.108468583002 | 190.61074877845 | 120.0847717304235 | 129 |
IV. Investment Strategy Comparison: AMP vs QNT
Long-term vs Short-term Investment Strategies
- AMP: Suitable for investors focused on payment scenarios and ecosystem potential
- QNT: Suitable for investors seeking stability and anti-inflationary properties
Risk Management and Asset Allocation
- Conservative investors: AMP: 30% vs QNT: 70%
- Aggressive investors: AMP: 60% vs QNT: 40%
- Hedging tools: Stablecoin allocation, options, cross-currency portfolio
V. Potential Risk Comparison
Market Risks
- AMP: High volatility, dependent on Flexa network adoption
- QNT: Sensitive to enterprise blockchain adoption rates
Technical Risks
- AMP: Scalability, network stability
- QNT: Centralization of development, potential security vulnerabilities
Regulatory Risks
- Global regulatory policies may impact both differently, with QNT potentially facing more scrutiny due to its focus on institutional adoption
VI. Conclusion: Which Is the Better Buy?
📌 Investment Value Summary:
- AMP advantages: Payment collateralization use case, potential for widespread adoption
- QNT advantages: Strong institutional focus, limited supply, interoperability solutions
✅ Investment Advice:
- New investors: Consider a balanced approach, leaning towards QNT for its institutional backing
- Experienced investors: Explore a diversified portfolio with both AMP and QNT, adjusting based on risk tolerance
- Institutional investors: QNT may be more aligned with institutional needs and compliance requirements
⚠️ Risk Warning: The cryptocurrency market is highly volatile. This article does not constitute investment advice. None
VII. FAQ
Q1: What are the main differences between AMP and QNT? A: AMP is a collateral token for the Flexa payment network, while QNT is focused on blockchain interoperability. AMP has a larger supply of 100 billion tokens, whereas QNT has a limited supply of 14.6 million tokens. QNT has stronger institutional adoption and enterprise focus, while AMP targets payment processing and merchant adoption.
Q2: Which token has performed better historically? A: QNT has shown more resilience in terms of price performance. While AMP reached its all-time high of $0.120813 in June 2021 and has since fallen significantly, QNT hit its all-time high of $427.42 in September 2021 and has maintained a higher price relative to its peak.
Q3: How do the supply mechanisms of AMP and QNT compare? A: AMP has a fixed maximum supply of 100 billion tokens, with about 92.5 billion currently in circulation. QNT has a fixed supply of 14.6 million tokens, with no additional tokens to be created. QNT's more limited supply tends to create stronger scarcity value.
Q4: What are the key factors affecting the investment value of AMP and QNT? A: Key factors include supply mechanisms, institutional adoption, market applications, technical development, ecosystem building, and macroeconomic factors such as inflation resistance and geopolitical considerations.
Q5: What are the price predictions for AMP and QNT in 2030? A: For AMP, the base scenario predicts a range of $0.004489497875133 - $0.006644456855196, with an optimistic scenario above $0.006644456855196. For QNT, the base scenario predicts a range of $190.61074877845 - $221.108468583002, with an optimistic scenario above $221.108468583002.
Q6: How should investors approach AMP and QNT in terms of risk management? A: Conservative investors might consider allocating 30% to AMP and 70% to QNT, while aggressive investors might allocate 60% to AMP and 40% to QNT. It's also recommended to use hedging tools such as stablecoin allocation, options, and cross-currency portfolio diversification.
Q7: What are the potential risks associated with investing in AMP and QNT? A: AMP faces risks related to high volatility and dependence on Flexa network adoption, as well as scalability and network stability issues. QNT is sensitive to enterprise blockchain adoption rates and may face centralization and security risks. Both tokens could be impacted by changing regulatory policies.
Q8: Which token might be more suitable for different types of investors? A: New investors might consider a balanced approach leaning towards QNT for its institutional backing. Experienced investors could explore a diversified portfolio with both tokens. Institutional investors may find QNT more aligned with their needs and compliance requirements due to its enterprise focus and interoperability solutions.
Share
Content
Introduction: Investment Comparison of AMP vs QNT
I. Price History Comparison and Current Market Status
II. Core Factors Affecting Investment Value of AMP vs QNT
III. 2025-2030 Price Prediction: AMP vs QNT
IV. Investment Strategy Comparison: AMP vs QNT
V. Potential Risk Comparison
VI. Conclusion: Which Is the Better Buy?
VII. FAQ

