BERA vs ENJ: Battle of the Gaming Cryptocurrencies in the Metaverse Era
Introduction: Investment Comparison of BERA vs ENJ
In the cryptocurrency market, the comparison between Berachain (BERA) vs Enjin Coin (ENJ) has been an unavoidable topic for investors. The two not only show significant differences in market cap ranking, application scenarios, and price performance, but also represent different positions in crypto assets.
Berachain (BERA): Since its launch, it has gained market recognition for its high-performance EVM-identical Layer 1 blockchain with Proof-of-Liquidity consensus.
Enjin Coin (ENJ): Launched in 2017, it has been hailed as a pioneer in blockchain gaming and virtual goods, becoming one of the most recognized tokens in the gaming industry.
This article will provide a comprehensive analysis of the investment value comparison between BERA and ENJ, focusing on historical price trends, supply mechanisms, institutional adoption, technological ecosystems, and future predictions, attempting to answer the question investors are most concerned about:
"Which is the better buy right now?"
I. Price History Comparison and Current Market Status
BERA and ENJ Historical Price Trends
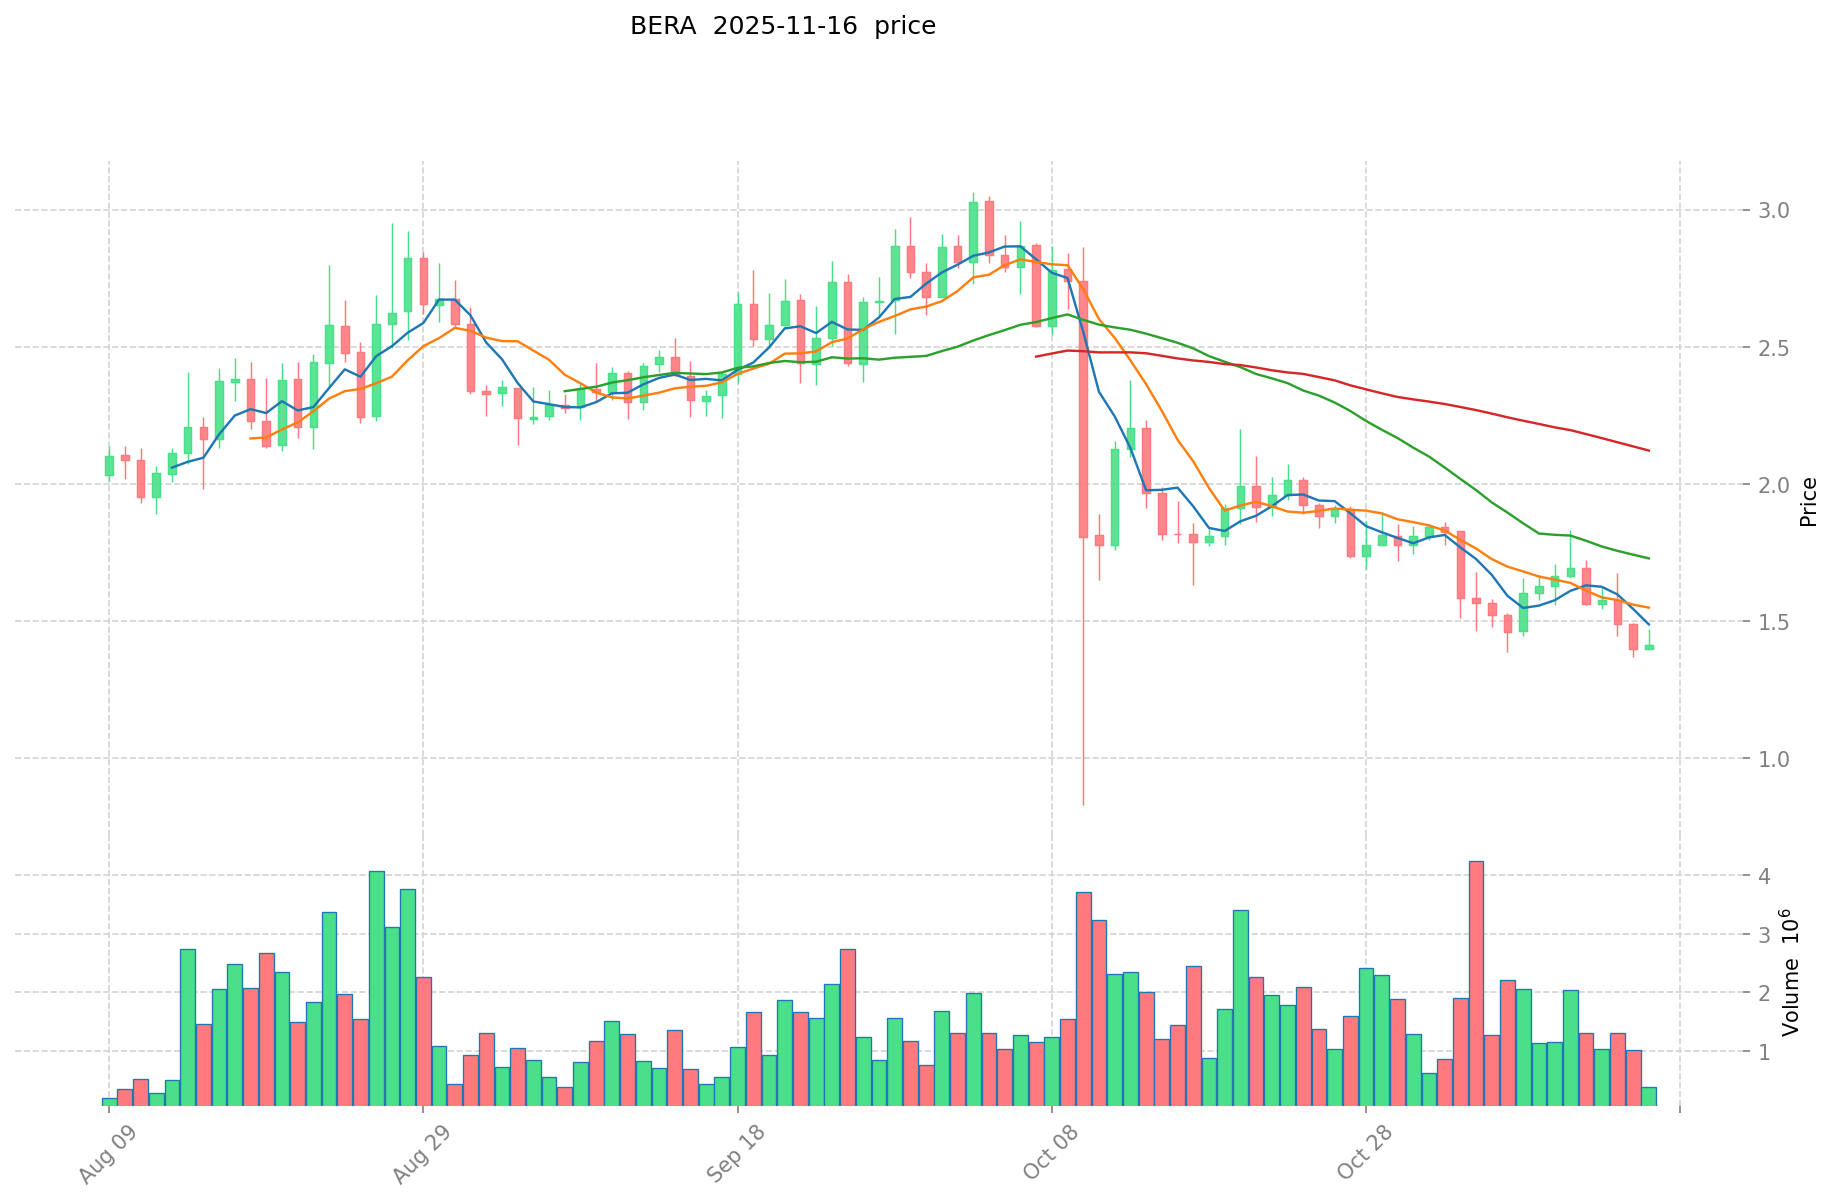
- 2025: BERA reached its all-time high of $15.2 on February 6, 2025, and later dropped to its all-time low of $0.8257 on October 10, 2025.
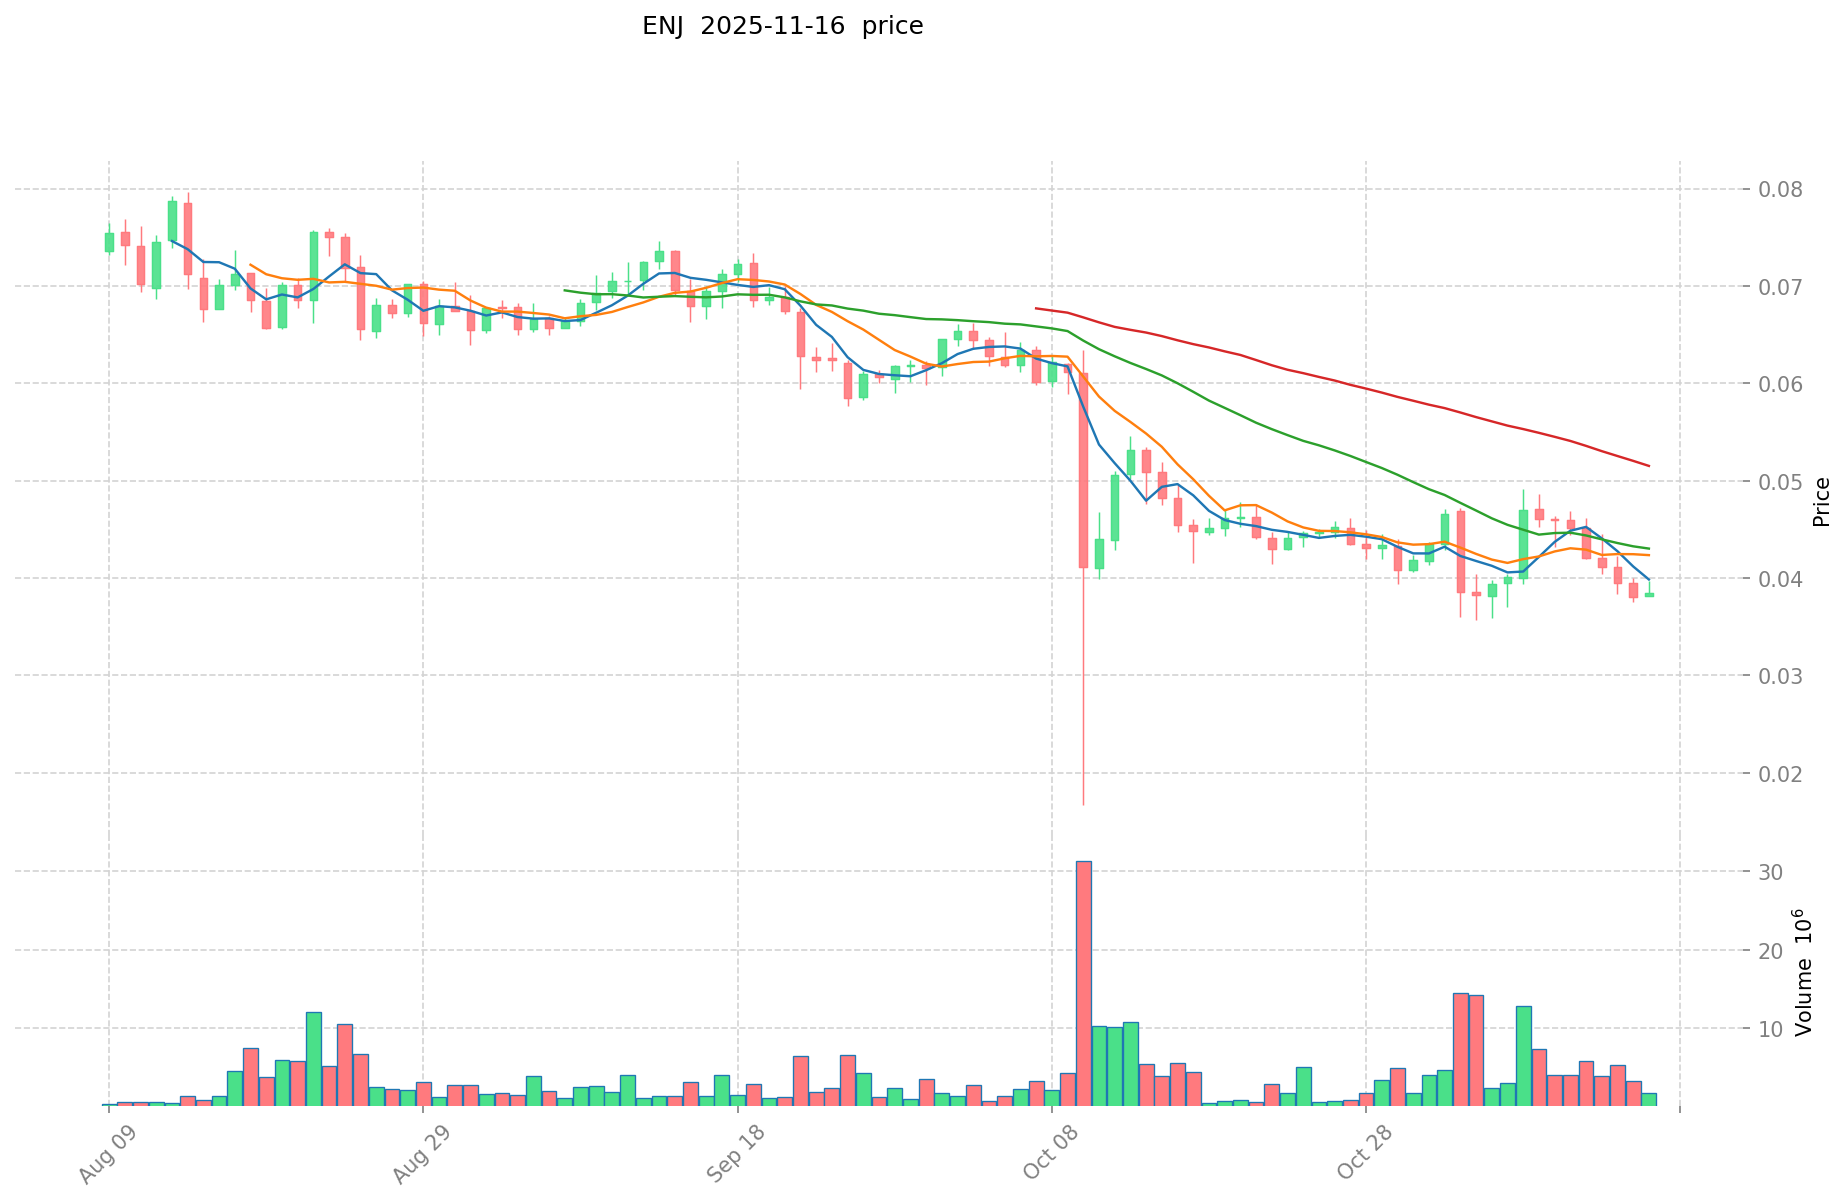
- 2021: ENJ hit its all-time high of $4.82 on November 25, 2021, following the overall cryptocurrency market bull run.
- Comparative analysis: In the recent market cycle, BERA has shown significant volatility, swinging from $15.2 to $0.8257 within a year, while ENJ has experienced a prolonged downtrend since its 2021 peak.
Current Market Situation (2025-11-16)
- BERA current price: $1.4097
- ENJ current price: $0.0381
- 24-hour trading volume: BERA $588,700.89 vs ENJ $83,711.70
- Market Sentiment Index (Fear & Greed Index): 10 (Extreme Fear)
Click to view real-time prices:
- View BERA current price Market Price
- View ENJ current price Market Price
II. Core Factors Affecting Investment Value of BERA vs ENJ
Supply Mechanism Comparison (Tokenomics)
-
BERA: Features a total supply of 10,000,000,000 tokens with a fair distribution model
-
ENJ: Utilizes a deflationary model where tokens are locked in NFTs through the "melting" process, removing them from circulation
-
📌 Historical Pattern: Deflationary models like ENJ's tend to create upward price pressure over time as supply decreases, while BERA's larger fixed supply relies more on adoption metrics for value growth.
Institutional Adoption and Market Applications
- Institutional Holdings: ENJ has attracted more institutional interest due to its longer history and established use cases in the gaming industry
- Enterprise Adoption: ENJ leads in gaming industry integration with its NFT infrastructure, while BERA is gaining traction in the DeFi space
- Regulatory Attitudes: Both tokens face varying regulatory scrutiny across jurisdictions, with ENJ having a longer compliance track record
Technical Development and Ecosystem Building
- BERA Technical Upgrades: Focus on scaling the Berachain ecosystem with EVM compatibility and DeFi applications
- ENJ Technical Development: Continued development of the Enjin platform with emphasis on NFT infrastructure and gaming integrations
- Ecosystem Comparison: ENJ has stronger presence in gaming and NFT markets, while BERA is building a more comprehensive DeFi ecosystem
Macroeconomic Factors and Market Cycles
- Inflation Environment Performance: ENJ's deflationary mechanism potentially provides better protection against inflation
- Macroeconomic Monetary Policy: Both tokens show correlation with broader crypto market reactions to Federal Reserve policies
- Geopolitical Factors: ENJ's gaming focus may provide more stability during geopolitical tensions compared to BERA's DeFi orientation
III. 2025-2030 Price Prediction: BERA vs ENJ
Short-term Prediction (2025)
- BERA: Conservative $1.26 - $1.41 | Optimistic $1.41 - $1.94
- ENJ: Conservative $0.029 - $0.038 | Optimistic $0.038 - $0.047
Mid-term Prediction (2027)
- BERA may enter a growth phase, with an estimated price range of $1.34 - $2.84
- ENJ may enter a moderate growth phase, with an estimated price range of $0.030 - $0.057
- Key drivers: Institutional capital inflow, ETF developments, ecosystem growth
Long-term Prediction (2030)
- BERA: Base scenario $2.66 - $3.12 | Optimistic scenario $3.12 - $4.16
- ENJ: Base scenario $0.048 - $0.069 | Optimistic scenario $0.069 - $0.082
Disclaimer: The above predictions are based on historical data and market analysis. Cryptocurrency markets are highly volatile and subject to rapid changes. These projections should not be considered as financial advice. Always conduct your own research before making investment decisions.
BERA:
| 年份 | 预测最高价 | 预测平均价格 | 预测最低价 | 涨跌幅 |
|---|---|---|---|---|
| 2025 | 1.936769 | 1.4137 | 1.258193 | 0 |
| 2026 | 2.37883299 | 1.6752345 | 1.37369229 | 18 |
| 2027 | 2.837847243 | 2.027033745 | 1.3378422717 | 43 |
| 2028 | 3.38109228666 | 2.432440494 | 2.35946727918 | 72 |
| 2029 | 3.3427813488795 | 2.90676639033 | 2.5579544234904 | 106 |
| 2030 | 4.155949246574317 | 3.12477386960475 | 2.656057789164037 | 121 |
ENJ:
| 年份 | 预测最高价 | 预测平均价格 | 预测最低价 | 涨跌幅 |
|---|---|---|---|---|
| 2025 | 0.0474796 | 0.03829 | 0.0294833 | 0 |
| 2026 | 0.048030976 | 0.0428848 | 0.028732816 | 12 |
| 2027 | 0.05682236 | 0.045457888 | 0.03000220608 | 19 |
| 2028 | 0.07210757484 | 0.051140124 | 0.03886649424 | 34 |
| 2029 | 0.077029811775 | 0.06162384942 | 0.0517640335128 | 61 |
| 2030 | 0.08180566010505 | 0.0693268305975 | 0.047835513112275 | 81 |
IV. Investment Strategy Comparison: BERA vs ENJ
Long-term vs Short-term Investment Strategies
- BERA: Suitable for investors focusing on DeFi potential and ecosystem growth
- ENJ: Suitable for investors interested in gaming and NFT market developments
Risk Management and Asset Allocation
- Conservative investors: BERA 30% vs ENJ 70%
- Aggressive investors: BERA 60% vs ENJ 40%
- Hedging tools: Stablecoin allocation, options, cross-currency portfolio
V. Potential Risk Comparison
Market Risks
- BERA: High volatility due to relatively new market position
- ENJ: Dependence on gaming industry trends and NFT market fluctuations
Technical Risks
- BERA: Scalability, network stability
- ENJ: Platform adoption, smart contract vulnerabilities
Regulatory Risks
- Global regulatory policies may have different impacts on both tokens, with ENJ potentially facing more scrutiny in gaming-related regulations
VI. Conclusion: Which Is the Better Buy?
📌 Investment Value Summary:
- BERA advantages: High-performance EVM-identical Layer 1 blockchain, growing DeFi ecosystem
- ENJ advantages: Established presence in gaming and NFT markets, deflationary tokenomics
✅ Investment Advice:
- New investors: Consider a balanced approach with a slight preference for ENJ due to its established market presence
- Experienced investors: Explore BERA for potential high growth in the DeFi sector
- Institutional investors: Diversify between both, with a focus on ENJ for gaming industry exposure and BERA for DeFi innovation
⚠️ Risk Warning: The cryptocurrency market is highly volatile, and this article does not constitute investment advice. None
VII. FAQ
Q1: What are the main differences between BERA and ENJ in terms of their market focus? A: BERA focuses on being a high-performance EVM-identical Layer 1 blockchain with emphasis on DeFi applications, while ENJ specializes in blockchain gaming and virtual goods, particularly in the NFT space.
Q2: How do the supply mechanisms of BERA and ENJ differ? A: BERA has a fixed total supply of 10 billion tokens with a fair distribution model. ENJ, on the other hand, uses a deflationary model where tokens are "melted" into NFTs, reducing the circulating supply over time.
Q3: Which token has shown better price performance in recent years? A: BERA has shown significant volatility, with its price ranging from $15.2 to $0.8257 within 2025. ENJ, however, has been in a prolonged downtrend since its all-time high in 2021.
Q4: How do institutional adoption and market applications compare between BERA and ENJ? A: ENJ has attracted more institutional interest due to its longer history and established use cases in the gaming industry. It also leads in gaming industry integration with its NFT infrastructure. BERA is gaining traction in the DeFi space but has less institutional adoption currently.
Q5: What are the predicted price ranges for BERA and ENJ in 2030? A: For BERA, the base scenario predicts $2.66 - $3.12, with an optimistic scenario of $3.12 - $4.16. For ENJ, the base scenario predicts $0.048 - $0.069, with an optimistic scenario of $0.069 - $0.082.
Q6: How should investors allocate their portfolio between BERA and ENJ? A: Conservative investors might consider allocating 30% to BERA and 70% to ENJ, while aggressive investors might allocate 60% to BERA and 40% to ENJ. However, individual allocation should be based on personal risk tolerance and investment goals.
Q7: What are the main risks associated with investing in BERA and ENJ? A: BERA faces risks related to high volatility, scalability, and network stability. ENJ's risks include dependence on gaming industry trends, NFT market fluctuations, and potential regulatory scrutiny in gaming-related regulations.
Share
Content
Introduction: Investment Comparison of BERA vs ENJ
I. Price History Comparison and Current Market Status
II. Core Factors Affecting Investment Value of BERA vs ENJ
III. 2025-2030 Price Prediction: BERA vs ENJ
IV. Investment Strategy Comparison: BERA vs ENJ
V. Potential Risk Comparison
VI. Conclusion: Which Is the Better Buy?
VII. FAQ

