COTI vs TRX: A Comparative Analysis of Two Promising Cryptocurrencies in the Digital Finance Ecosystem
Introduction: COTI vs TRX Investment Comparison
In the cryptocurrency market, COTI vs TRX comparison has always been a topic that investors can't avoid. The two not only have significant differences in market cap ranking, application scenarios, and price performance, but also represent different positioning of crypto assets.
COTI (COTI): Since its launch, it has gained market recognition for its comprehensive "financial blockchain" ecosystem.
TRON (TRX): Launched in 2017, it has been hailed as a large public chain that has entered into a partnership with a sovereign state to develop blockchain infrastructure.
This article will comprehensively analyze the investment value comparison between COTI and TRX, focusing on historical price trends, supply mechanisms, institutional adoption, technological ecosystems, and future predictions, and attempt to answer the question that investors are most concerned about:
"Which is the better buy right now?"
I. Price History Comparison and Current Market Status
COTI and TRX Historical Price Trends
- 2022: TRX announced the launch of USDD stablecoin, positively impacting its price.
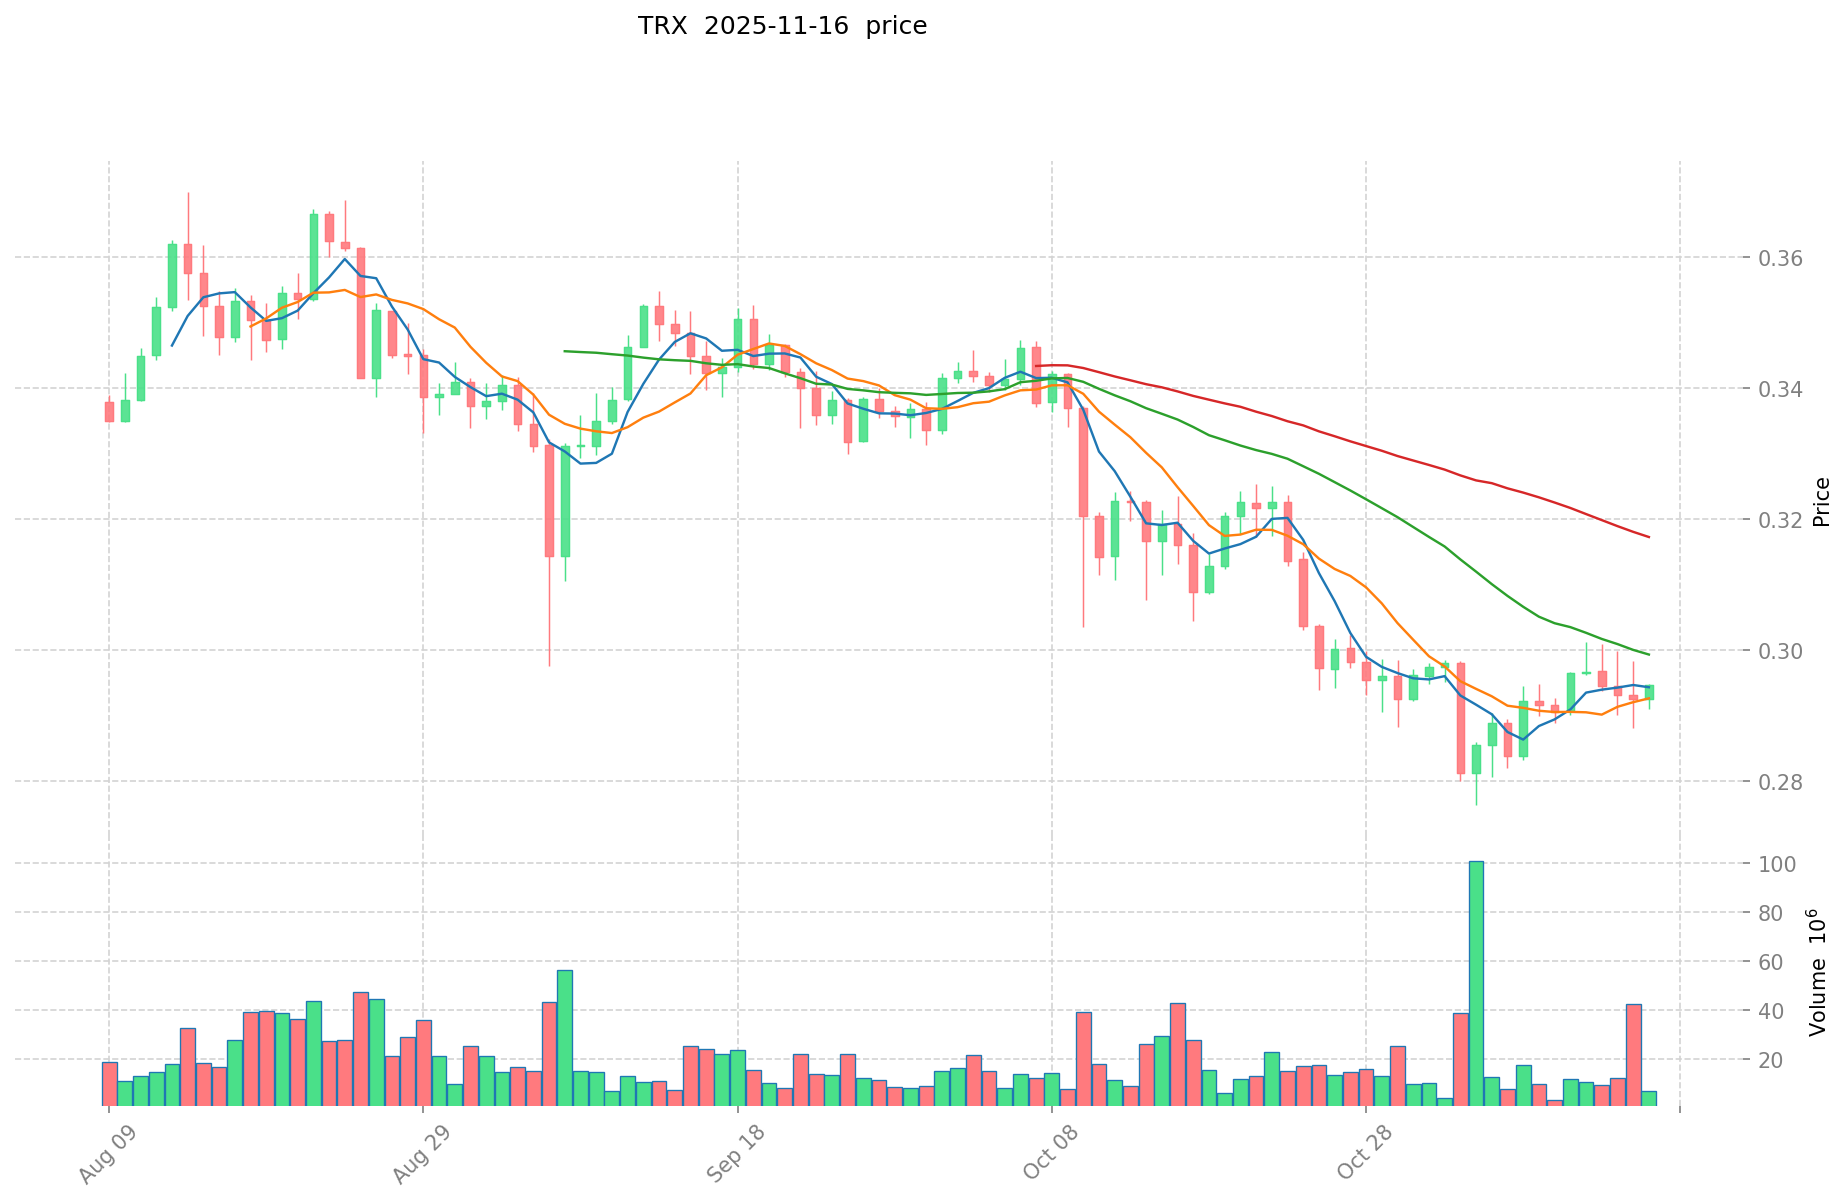
- 2024: TRX reached its all-time high of $0.431288 on December 4.
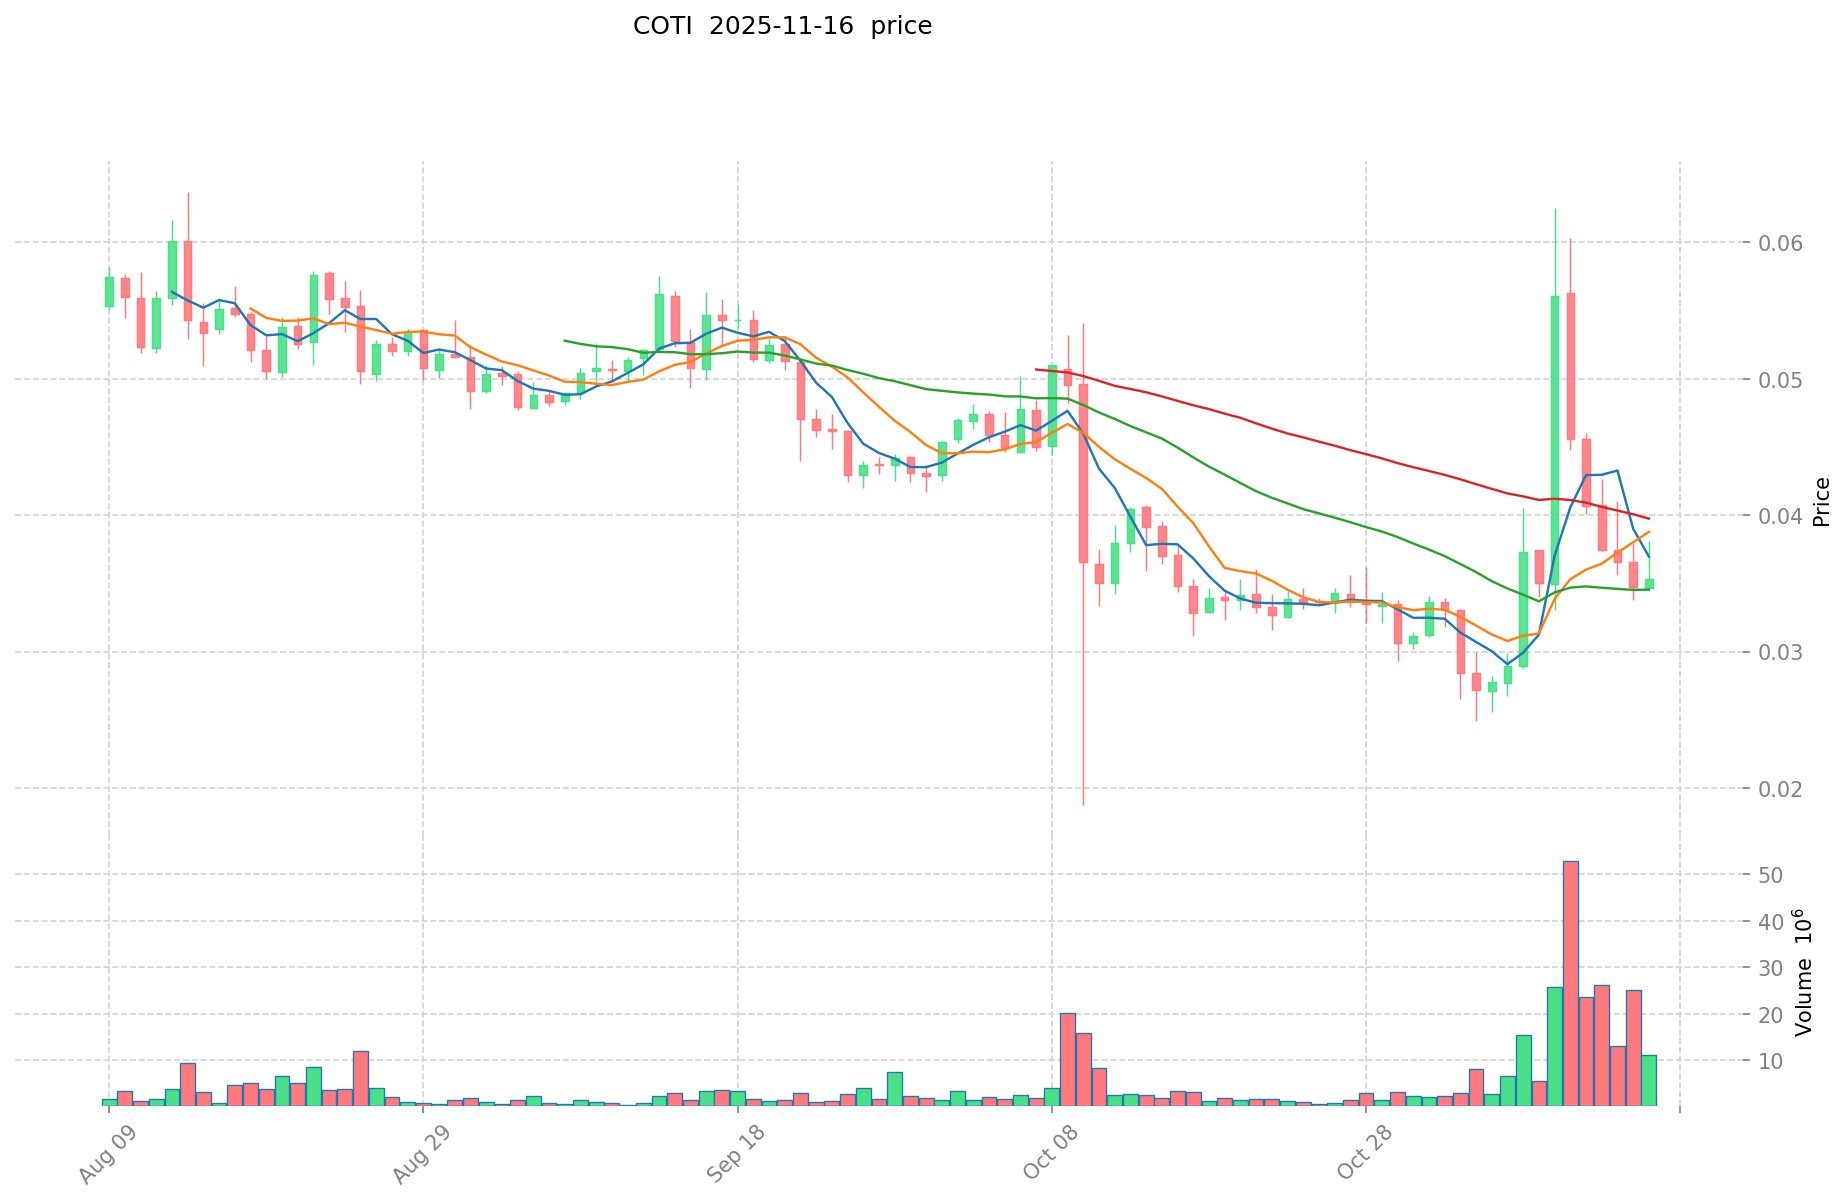
- Comparative analysis: COTI's all-time high of $0.668634 was reached on September 29, 2021, while its all-time low was $0.00556342 on November 7, 2019. TRX has shown more resilience in recent years.
Current Market Situation (2025-11-17)
- COTI current price: $0.03338
- TRX current price: $0.29119
- 24-hour trading volume: COTI $238,383.25 vs TRX $2,540,368.84
- Market Sentiment Index (Fear & Greed Index): 10 (Extreme Fear)
Click to view real-time prices:
- View COTI current price Market Price
- View TRX current price Market Price
II. Core Factors Affecting Investment Value of COTI vs TRX
Supply Mechanism Comparison (Tokenomics)
- COTI: Fixed supply of 2 billion tokens, with a current circulating supply of approximately 170 million tokens
- TRX: Deflationary model with token burning mechanism; total supply of about 89.6 billion TRX with approximately 88.5 billion in circulation
- 📌 Historical pattern: Limited supply coins like COTI tend to show higher volatility during bull markets, while TRX's deflationary mechanism aims to create sustained value through regular token burning.
Institutional Adoption and Market Applications
- Institutional holdings: TRX appears to have greater institutional adoption, with TRON having established partnerships with major companies and financial institutions
- Enterprise adoption: TRX has wider application in cross-border payments and settlements through TRON's payment infrastructure, while COTI focuses on enterprise payment solutions and treasury infrastructure
- Regulatory attitudes: TRX faces varying regulatory scrutiny across jurisdictions, with TRON's founder Justin Sun having faced regulatory challenges in some markets
Technical Development and Ecosystem Building
- COTI technical upgrades: Development of MultiDAG 2.0 protocol and enterprise solutions, with focus on treasury infrastructure and payment systems
- TRX technical development: TRON network continues to expand its blockchain platform with emphasis on DeFi applications, stablecoin integration, and smart contract functionality
- Ecosystem comparison: TRX has a more developed ecosystem with extensive DeFi protocols, NFT marketplaces, and dApps, while COTI is building specialized payment solutions and focusing on enterprise treasury infrastructure
Macroeconomic Factors and Market Cycles
- Performance during inflation: TRX has historically shown more resilience during inflationary periods due to its larger market cap and established ecosystem
- Macroeconomic monetary policy: Both tokens are affected by interest rate changes and USD strength, with high interest rate environments typically challenging for the entire crypto sector
- Geopolitical factors: TRX benefits from its popularity in Asian markets, while COTI's focus on regulated markets may provide stability during regulatory uncertainty
III. 2025-2030 Price Prediction: COTI vs TRX
Short-term Prediction (2025)
- COTI: Conservative $0.0225 - $0.0336 | Optimistic $0.0336 - $0.0350
- TRX: Conservative $0.2683 - $0.2916 | Optimistic $0.2916 - $0.3645
Mid-term Prediction (2027)
- COTI may enter a growth phase, with prices expected in the range of $0.0246 - $0.0435
- TRX may enter a bullish phase, with prices expected in the range of $0.2090 - $0.4994
- Key drivers: Institutional fund inflows, ETF, ecosystem development
Long-term Prediction (2030)
- COTI: Base scenario $0.0544 - $0.0674 | Optimistic scenario $0.0674 - $0.0784
- TRX: Base scenario $0.5683 - $0.7019 | Optimistic scenario $0.7019 - $0.8355
Disclaimer: This analysis is based on historical data and market projections. Cryptocurrency markets are highly volatile and unpredictable. This information should not be considered as financial advice. Always conduct your own research before making investment decisions.
COTI:
| 年份 | 预测最高价 | 预测平均价格 | 预测最低价 | 涨跌幅 |
|---|---|---|---|---|
| 2025 | 0.0349648 | 0.03362 | 0.0225254 | 0 |
| 2026 | 0.04629474 | 0.0342924 | 0.023661756 | 2 |
| 2027 | 0.0435170556 | 0.04029357 | 0.0245790777 | 20 |
| 2028 | 0.060343650432 | 0.0419053128 | 0.021790762656 | 25 |
| 2029 | 0.05777066422608 | 0.051124481616 | 0.02709597525648 | 53 |
| 2030 | 0.078404505006297 | 0.05444757292104 | 0.047369388441304 | 63 |
TRX:
| 年份 | 预测最高价 | 预测平均价格 | 预测最低价 | 涨跌幅 |
|---|---|---|---|---|
| 2025 | 0.3645125 | 0.29161 | 0.2682812 | 0 |
| 2026 | 0.4461633 | 0.32806125 | 0.2985357375 | 12 |
| 2027 | 0.49937483475 | 0.387112275 | 0.2090406285 | 32 |
| 2028 | 0.54518957249625 | 0.443243554875 | 0.31470292396125 | 52 |
| 2029 | 0.642481532791312 | 0.494216563685625 | 0.3953732509485 | 69 |
| 2030 | 0.835473100910549 | 0.568349048238468 | 0.426261786178851 | 95 |
IV. Investment Strategy Comparison: COTI vs TRX
Long-term vs Short-term Investment Strategies
- COTI: Suitable for investors focused on payment solutions and enterprise treasury infrastructure
- TRX: Suitable for investors seeking ecosystem growth and DeFi exposure
Risk Management and Asset Allocation
- Conservative investors: COTI: 30% vs TRX: 70%
- Aggressive investors: COTI: 40% vs TRX: 60%
- Hedging tools: Stablecoin allocation, options, cross-currency portfolio
V. Potential Risk Comparison
Market Risks
- COTI: Higher volatility due to lower market cap and trading volume
- TRX: Exposure to broader crypto market trends and DeFi sector risks
Technical Risks
- COTI: Scalability, network stability of MultiDAG 2.0
- TRX: Computing power concentration, potential security vulnerabilities in smart contracts
Regulatory Risks
- Global regulatory policies may have differing impacts on both tokens, with TRX potentially facing more scrutiny due to its wider adoption and past regulatory challenges
VI. Conclusion: Which Is the Better Buy?
📌 Investment Value Summary:
- COTI advantages: Specialized focus on payment solutions and treasury infrastructure, potential for growth in enterprise adoption
- TRX advantages: Established ecosystem, wider adoption, deflationary mechanism, and strong performance in Asian markets
✅ Investment Advice:
- New investors: Consider a higher allocation to TRX due to its established market position and ecosystem
- Experienced investors: Balanced approach with exposure to both, leveraging COTI's growth potential and TRX's stability
- Institutional investors: Focus on TRX for its liquidity and ecosystem, while monitoring COTI's progress in enterprise solutions
⚠️ Risk Warning: The cryptocurrency market is highly volatile, and this article does not constitute investment advice. None
VII. FAQ
Q1: What are the main differences between COTI and TRX? A: COTI focuses on payment solutions and enterprise treasury infrastructure, with a fixed supply of 2 billion tokens. TRX is a larger public chain with a deflationary model, wider adoption in DeFi, and a more established ecosystem.
Q2: Which coin has shown better price performance recently? A: TRX has shown more resilience in recent years, reaching its all-time high of $0.431288 on December 4, 2024. COTI's all-time high was $0.668634 on September 29, 2021.
Q3: How do the supply mechanisms of COTI and TRX differ? A: COTI has a fixed supply of 2 billion tokens, with about 170 million in circulation. TRX uses a deflationary model with a token burning mechanism, having a total supply of about 89.6 billion TRX with approximately 88.5 billion in circulation.
Q4: What are the key factors affecting the investment value of COTI and TRX? A: Key factors include supply mechanisms, institutional adoption, market applications, technical development, ecosystem building, and macroeconomic factors such as inflation and interest rates.
Q5: What are the long-term price predictions for COTI and TRX by 2030? A: For COTI, the base scenario predicts $0.0544 - $0.0674, with an optimistic scenario of $0.0674 - $0.0784. For TRX, the base scenario predicts $0.5683 - $0.7019, with an optimistic scenario of $0.7019 - $0.8355.
Q6: How should investors approach risk management when investing in COTI and TRX? A: Conservative investors might consider allocating 30% to COTI and 70% to TRX, while aggressive investors might opt for 40% COTI and 60% TRX. Hedging tools include stablecoin allocation, options, and cross-currency portfolio diversification.
Q7: What are the potential risks associated with investing in COTI and TRX? A: Risks include market volatility, technical challenges (such as scalability for COTI and smart contract vulnerabilities for TRX), and regulatory uncertainties, with TRX potentially facing more scrutiny due to its wider adoption.
Share
Content
Introduction: COTI vs TRX Investment Comparison
I. Price History Comparison and Current Market Status
II. Core Factors Affecting Investment Value of COTI vs TRX
III. 2025-2030 Price Prediction: COTI vs TRX
IV. Investment Strategy Comparison: COTI vs TRX
V. Potential Risk Comparison
VI. Conclusion: Which Is the Better Buy?
VII. FAQ

