DOGE vs DOT: Comparing the Meme Coin and the Interoperability Pioneer in the Crypto Market
Introduction: DOGE vs DOT Investment Comparison
In the cryptocurrency market, the comparison between Dogecoin vs Polkadot has always been an unavoidable topic for investors. The two not only have significant differences in market cap ranking, application scenarios, and price performance, but also represent different cryptocurrency positioning.
Dogecoin (DOGE): Since its launch in 2013, it has gained market recognition for its positioning as a fun, light-hearted cryptocurrency.
Polkadot (DOT): Since its inception in 2020, it has been hailed as a protocol for connecting different blockchain networks, and is one of the top cryptocurrencies by global trading volume and market capitalization.
This article will provide a comprehensive analysis of the investment value comparison between DOGE and DOT, focusing on historical price trends, supply mechanisms, institutional adoption, technological ecosystems, and future predictions, attempting to answer the question investors care about most:
"Which is the better buy right now?"
I. Price History Comparison and Current Market Status
DOGE (Coin A) and DOT (Coin B) Historical Price Trends
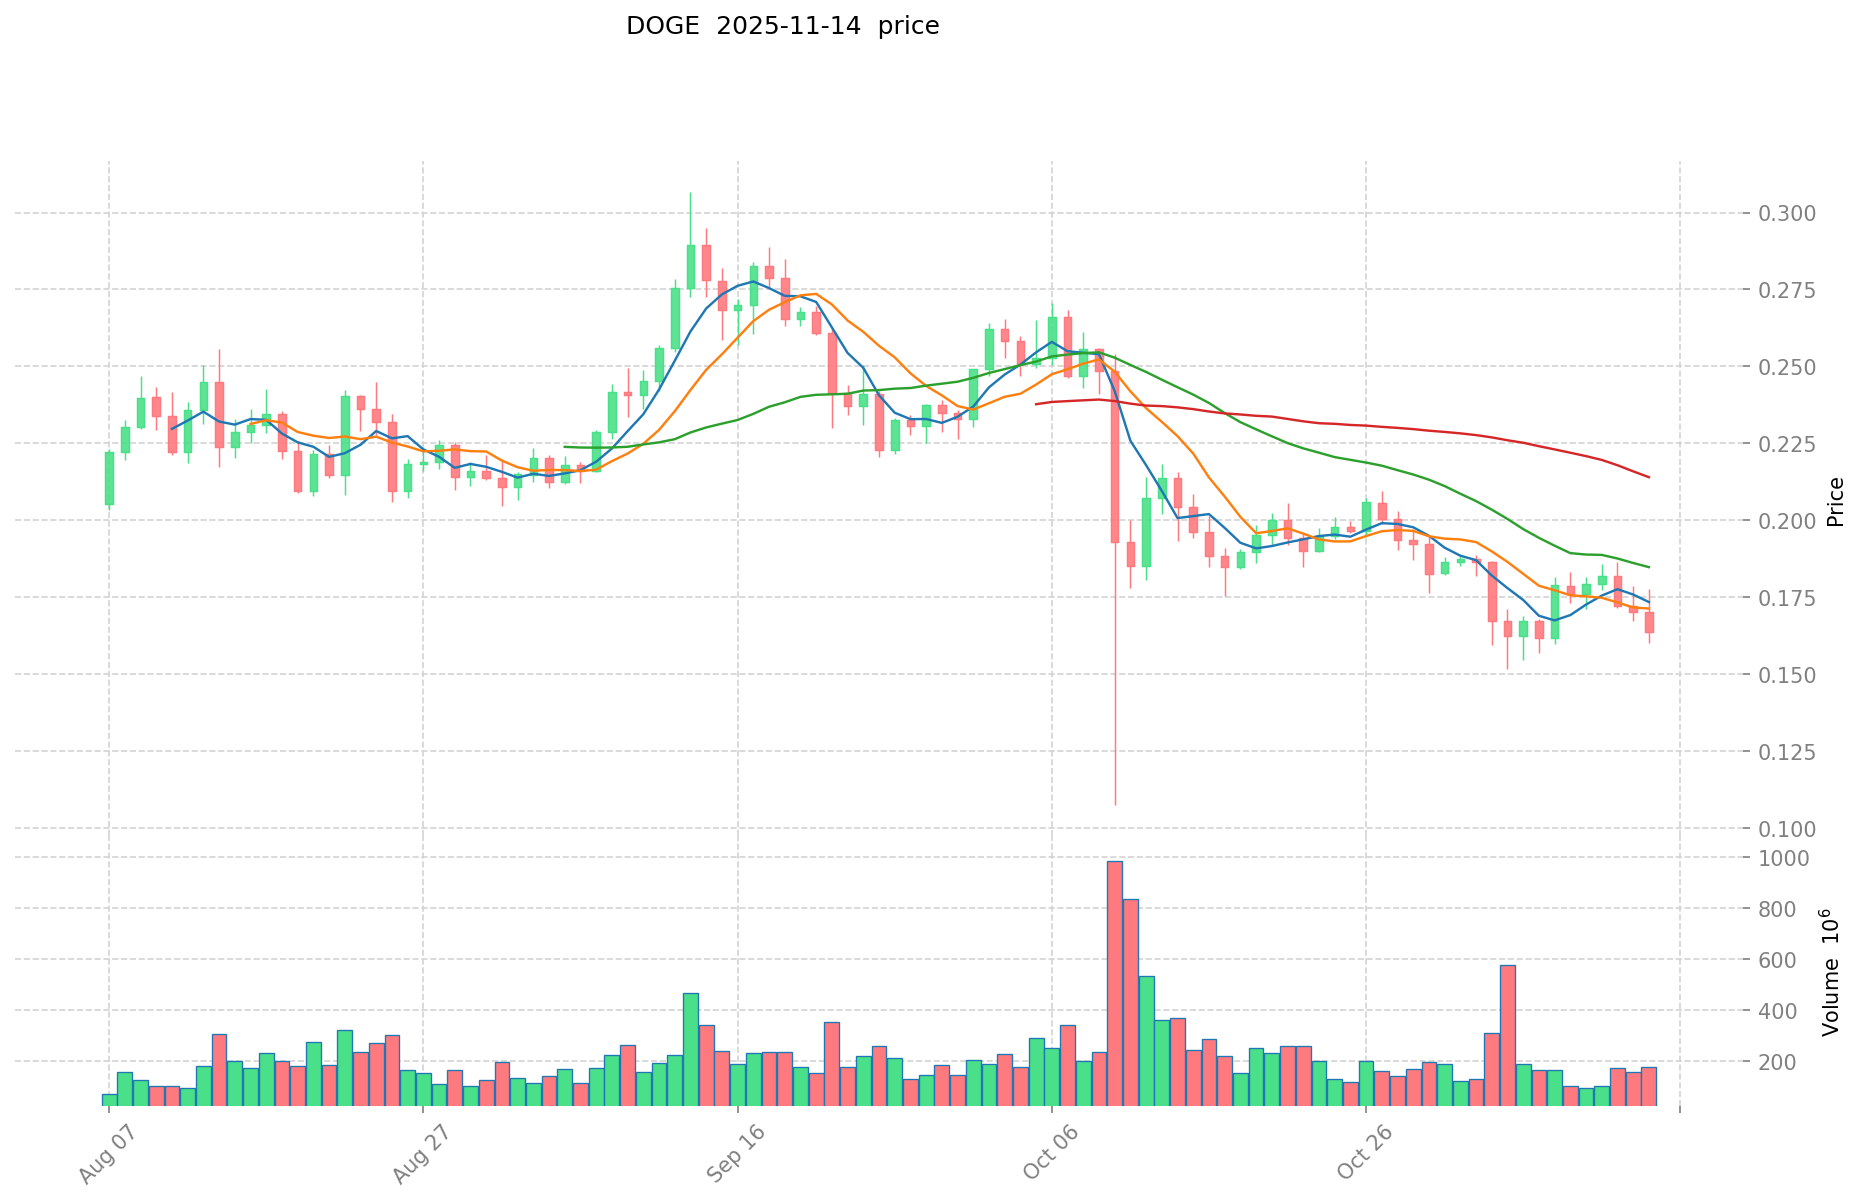
- 2021: DOGE reached its all-time high of $0.731578 on May 8, 2021, likely due to increased social media attention and celebrity endorsements.
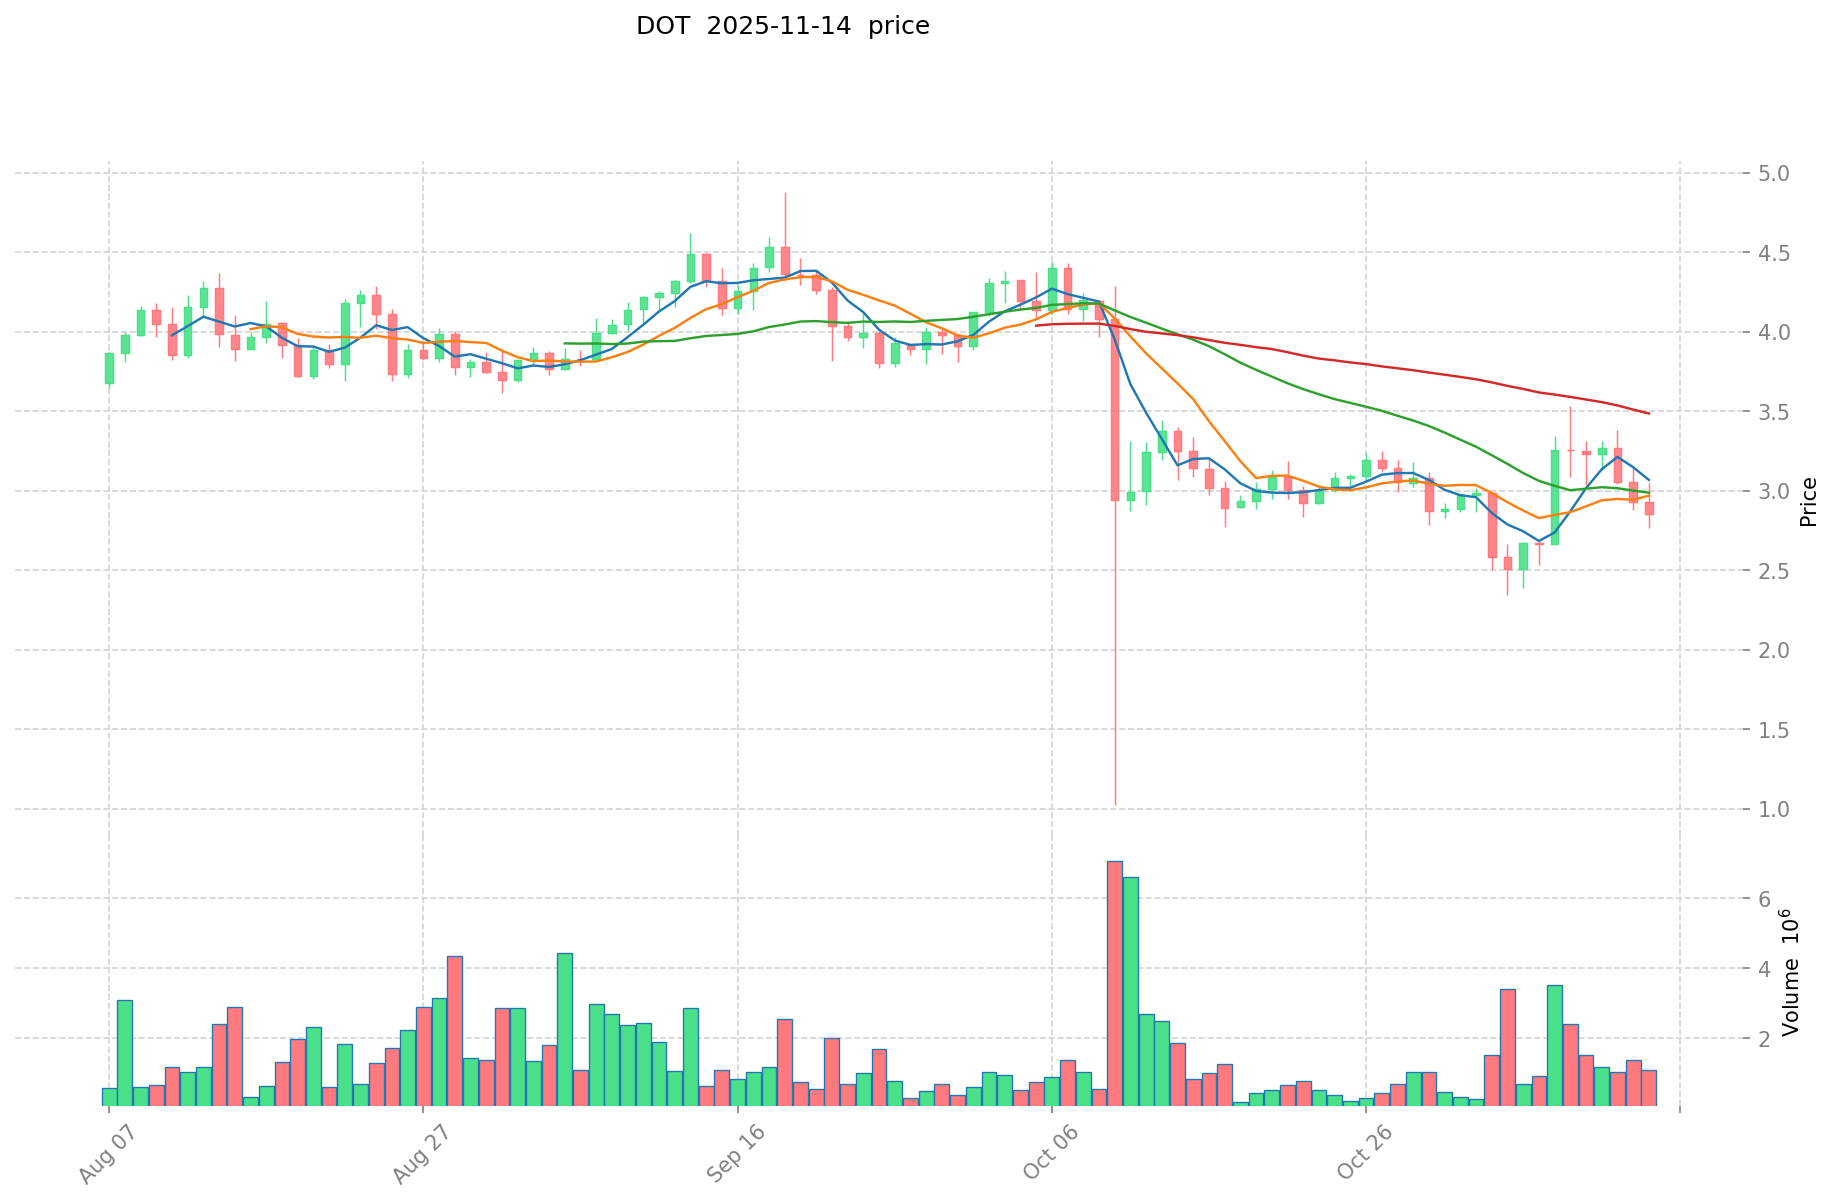
- 2021: DOT hit its all-time high of $54.98 on November 4, 2021, possibly influenced by the growing interest in blockchain interoperability solutions.
- Comparative analysis: Since their respective peaks, DOGE has fallen from $0.731578 to $0.16432, while DOT has declined from $54.98 to $2.87, both experiencing significant corrections in the current market cycle.
Current Market Situation (2025-11-14)
- DOGE current price: $0.16432
- DOT current price: $2.87
- 24-hour trading volume: DOGE $28,887,432.67 vs DOT $3,256,406.90
- Market Sentiment Index (Fear & Greed Index): 16 (Extreme Fear)
Click to view real-time prices:
- View DOGE current price Market Price
- View DOT current price Market Price
II. Core Factors Affecting Investment Value of DOGE vs DOT
Supply Mechanisms Comparison (Tokenomics)
- DOGE: Inflationary model with unlimited supply; adds 5 billion new coins annually
- DOT: Inflationary model with 10% annual inflation rate; staking rewards offset some inflation
- 📌 Historical pattern: DOT's controlled inflation with staking incentives provides better long-term value preservation compared to DOGE's unlimited supply which typically leads to price dilution over time.
Institutional Adoption and Market Applications
- Institutional holdings: DOT has attracted more institutional interest through its parachain ecosystem and governance mechanisms
- Enterprise adoption: DOT offers cross-chain interoperability solutions and enterprise-level blockchain infrastructure, while DOGE remains primarily a payment and tipping token
- Regulatory attitudes: Both face varying regulatory scrutiny across jurisdictions, though DOT's utility focus may offer more regulatory clarity than DOGE's meme coin status
Technical Development and Ecosystem Building
- DOGE technical upgrades: Limited technical innovation beyond core updates; relies primarily on community support and brand recognition
- DOT technical development: Continuous development of parachain auctions, cross-chain messaging, and substrate framework enhancements
- Ecosystem comparison: DOT features a robust ecosystem with DeFi protocols, NFT platforms, and enterprise solutions, while DOGE has limited native ecosystem beyond payment applications
Macroeconomic Factors and Market Cycles
- Performance during inflation: Neither asset has proven strong inflation-resistant properties, though DOT's staking rewards may partially offset inflationary pressures
- Monetary policy impact: Both assets show sensitivity to Federal Reserve policies and broader risk sentiment in markets
- Geopolitical factors: DOT's interoperability focus positions it better for cross-border use cases in various regulatory environments
III. 2025-2030 Price Prediction: DOGE vs DOT
Short-term Prediction (2025)
- DOGE: Conservative $0.1035-$0.1643 | Optimistic $0.1643-$0.2152
- DOT: Conservative $2.4656-$2.8670 | Optimistic $2.8670-$3.6984
Mid-term Prediction (2027)
- DOGE may enter a growth phase, with an estimated price range of $0.1434-$0.2259
- DOT may enter a bullish market, with an estimated price range of $2.2757-$4.7443
- Key drivers: Institutional capital inflow, ETF, ecosystem development
Long-term Prediction (2030)
- DOGE: Base scenario $0.3104-$0.3104 | Optimistic scenario $0.3104-$0.4314
- DOT: Base scenario $6.4275-$6.4275 | Optimistic scenario $6.4275-$8.2272
Disclaimer
DOGE:
| 年份 | 预测最高价 | 预测平均价格 | 预测最低价 | 涨跌幅 |
|---|---|---|---|---|
| 2025 | 0.2152461 | 0.16431 | 0.1035153 | 0 |
| 2026 | 0.2030625135 | 0.18977805 | 0.1385379765 | 15 |
| 2027 | 0.2258833240125 | 0.19642028175 | 0.1433868056775 | 19 |
| 2028 | 0.29561252403375 | 0.21115180288125 | 0.116133491584687 | 28 |
| 2029 | 0.367404137013375 | 0.2533821634575 | 0.22804394711175 | 54 |
| 2030 | 0.431446478827258 | 0.310393150235437 | 0.294873492723665 | 88 |
DOT:
| 年份 | 预测最高价 | 预测平均价格 | 预测最低价 | 涨跌幅 |
|---|---|---|---|---|
| 2025 | 3.69843 | 2.867 | 2.46562 | 0 |
| 2026 | 4.43166525 | 3.282715 | 2.00245615 | 14 |
| 2027 | 4.74434385375 | 3.857190125 | 2.27574217375 | 34 |
| 2028 | 6.1931044647 | 4.300766989375 | 2.70948320330625 | 49 |
| 2029 | 7.608056804204375 | 5.2469357270375 | 4.30248729617075 | 82 |
| 2030 | 8.2271952199948 | 6.427496265620937 | 3.470847983435306 | 123 |
IV. Investment Strategy Comparison: DOGE vs DOT
Long-term vs Short-term Investment Strategies
- DOGE: Suitable for investors focused on community-driven projects and speculative opportunities
- DOT: Suitable for investors seeking long-term ecosystem growth and technological advancement
Risk Management and Asset Allocation
- Conservative investors: DOGE: 10% vs DOT: 90%
- Aggressive investors: DOGE: 30% vs DOT: 70%
- Hedging tools: Stablecoin allocation, options, cross-currency portfolios
V. Potential Risk Comparison
Market Risk
- DOGE: High volatility due to meme-driven price movements and celebrity influence
- DOT: Susceptible to broader crypto market trends and interoperability adoption rates
Technical Risk
- DOGE: Limited scalability, network stability concerns
- DOT: Parachain auction complexity, potential security vulnerabilities in cross-chain operations
Regulatory Risk
- Global regulatory policies may have differing impacts on both assets, with DOT potentially facing more scrutiny due to its complex ecosystem
VI. Conclusion: Which Is the Better Buy?
📌 Investment Value Summary:
- DOGE advantages: Strong community support, brand recognition, potential for rapid price movements
- DOT advantages: Robust technological foundation, growing ecosystem, institutional interest
✅ Investment Advice:
- Novice investors: Consider a small allocation to DOGE for exposure to community-driven projects, with a larger allocation to DOT for long-term potential
- Experienced investors: Implement a balanced approach, potentially using DOGE for short-term trading opportunities and DOT for long-term ecosystem investment
- Institutional investors: Focus on DOT for its technological innovations and potential for enterprise adoption
⚠️ Risk Warning: The cryptocurrency market is highly volatile, and this article does not constitute investment advice. None
VII. FAQ
Q1: What are the main differences between DOGE and DOT? A: DOGE is a meme-inspired cryptocurrency with unlimited supply, while DOT is a protocol for blockchain interoperability with a controlled inflation model. DOGE relies on community support and brand recognition, whereas DOT offers advanced technological features and a growing ecosystem.
Q2: Which coin has performed better historically? A: Both coins reached their all-time highs in 2021, with DOGE peaking at $0.731578 and DOT at $54.98. Since then, both have experienced significant corrections. As of 2025-11-14, DOGE is priced at $0.16432, while DOT is at $2.87.
Q3: How do the supply mechanisms of DOGE and DOT compare? A: DOGE has an inflationary model with unlimited supply, adding 5 billion new coins annually. DOT has a controlled inflationary model with a 10% annual inflation rate, partially offset by staking rewards.
Q4: Which coin is more suitable for long-term investment? A: DOT is generally considered more suitable for long-term investment due to its technological advancements, growing ecosystem, and institutional interest. However, investment decisions should be based on individual risk tolerance and market research.
Q5: What are the potential risks associated with investing in DOGE and DOT? A: DOGE faces high volatility due to meme-driven price movements and limited technical development. DOT risks include parachain auction complexity and potential security vulnerabilities in cross-chain operations. Both are subject to broader market trends and regulatory risks.
Q6: How do institutional adoption and market applications differ between DOGE and DOT? A: DOT has attracted more institutional interest through its parachain ecosystem and governance mechanisms. It offers cross-chain interoperability solutions and enterprise-level blockchain infrastructure. DOGE remains primarily a payment and tipping token with limited native ecosystem beyond payment applications.
Q7: What are the price predictions for DOGE and DOT by 2030? A: By 2030, DOGE is predicted to reach a base scenario of $0.3104-$0.3104 and an optimistic scenario of $0.3104-$0.4314. DOT is predicted to reach a base scenario of $6.4275-$6.4275 and an optimistic scenario of $6.4275-$8.2272. However, these predictions are speculative and subject to market conditions.
Share
Content
Introduction: DOGE vs DOT Investment Comparison
I. Price History Comparison and Current Market Status
II. Core Factors Affecting Investment Value of DOGE vs DOT
III. 2025-2030 Price Prediction: DOGE vs DOT
IV. Investment Strategy Comparison: DOGE vs DOT
V. Potential Risk Comparison
VI. Conclusion: Which Is the Better Buy?
VII. FAQ

