LINK vs KAVA: Comparing Two Leading Blockchain Interoperability Solutions
Introduction: LINK vs KAVA Investment Comparison
In the cryptocurrency market, the comparison between Chainlink (LINK) and Kava (KAVA) has always been a topic that investors can't ignore. The two not only differ significantly in market cap ranking, application scenarios, and price performance, but also represent different positioning in the crypto asset space.
Chainlink (LINK): Since its launch in 2017, it has gained market recognition for its role in providing decentralized oracle services.
Kava (KAVA): Introduced in 2019, it has been hailed as a cross-chain DeFi platform, offering lending and stablecoin services for mainstream digital assets.
This article will comprehensively analyze the investment value comparison between LINK and KAVA, focusing on historical price trends, supply mechanisms, institutional adoption, technological ecosystems, and future predictions, attempting to answer the question most concerning to investors:
"Which is the better buy right now?"
I. Price History Comparison and Current Market Status
LINK (Coin A) and KAVA (Coin B) Historical Price Trends
- 2021: LINK reached its all-time high of $52.7 on May 10, 2021.
- 2021: KAVA hit its all-time high of $9.12 on August 30, 2021.
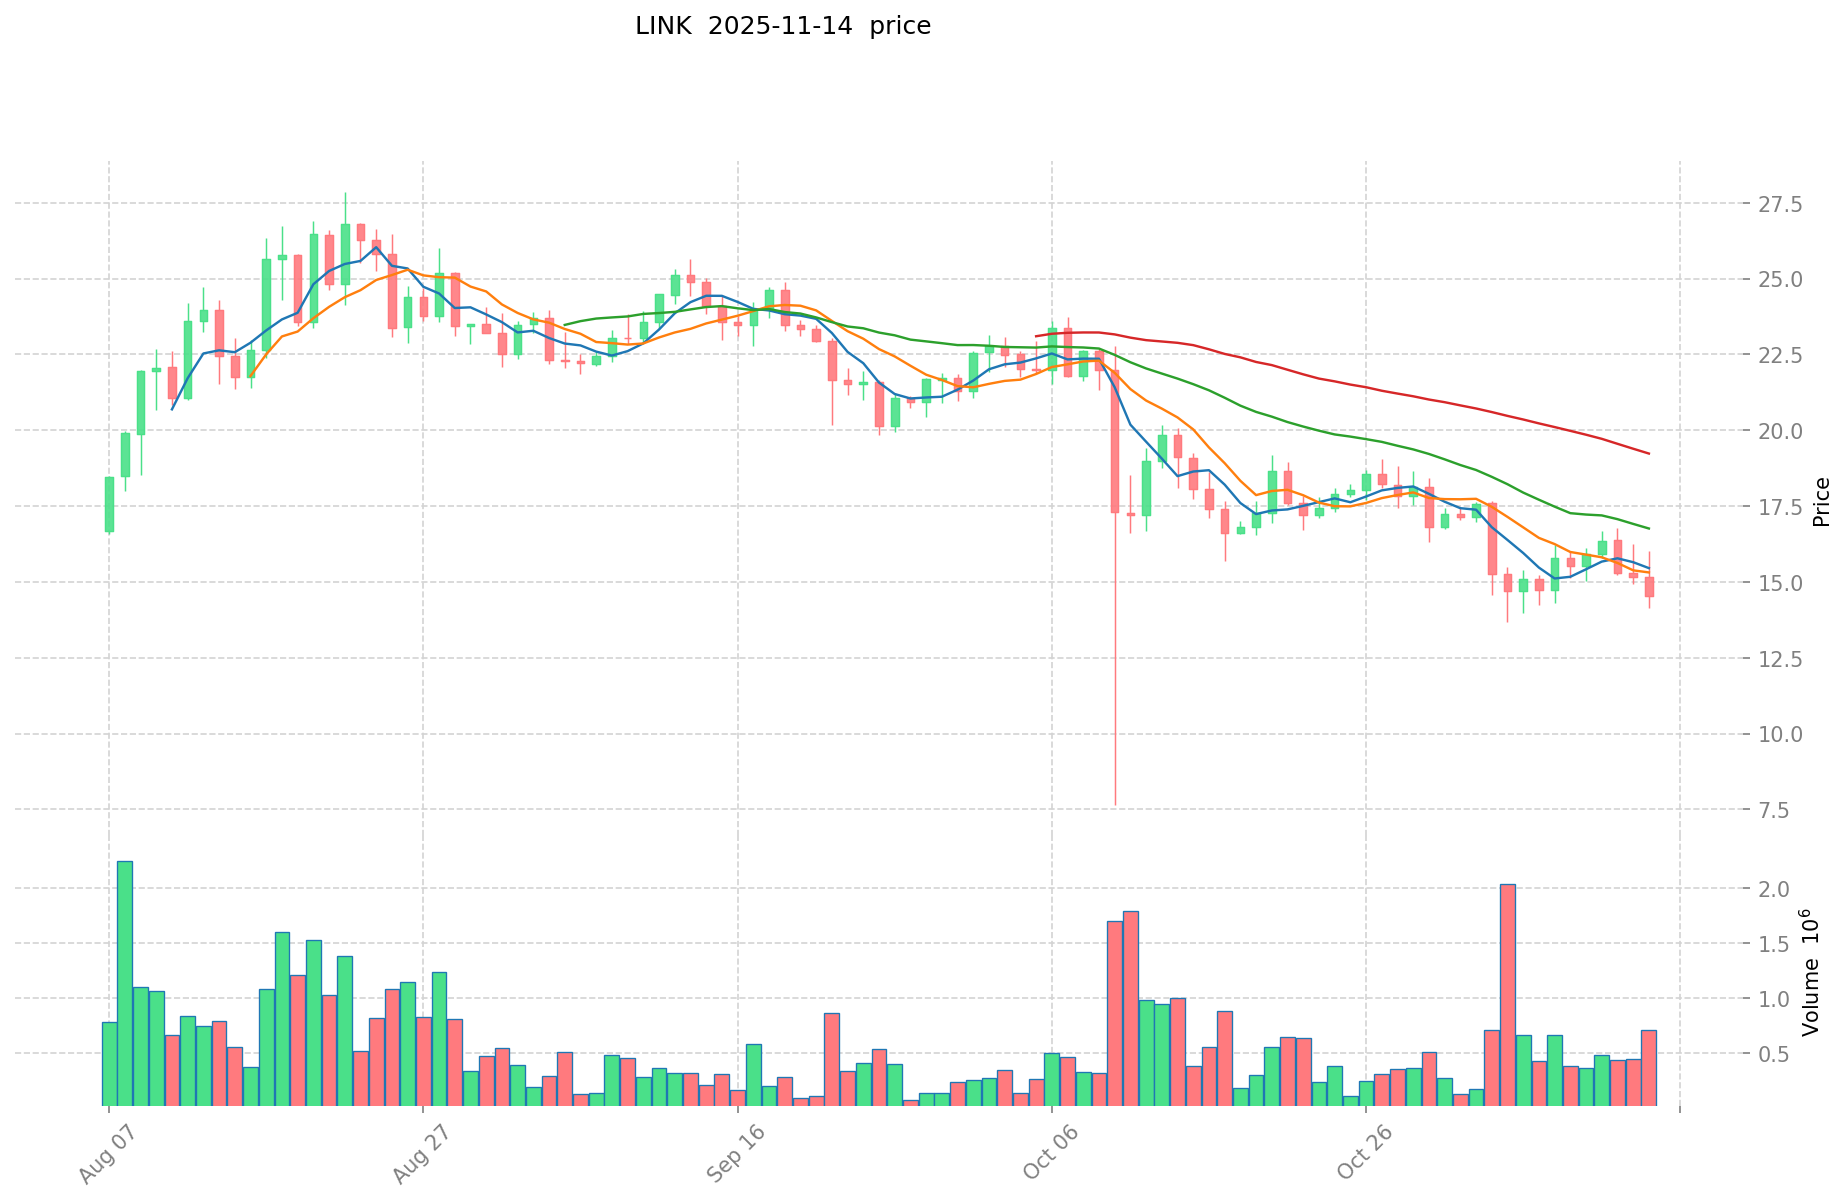
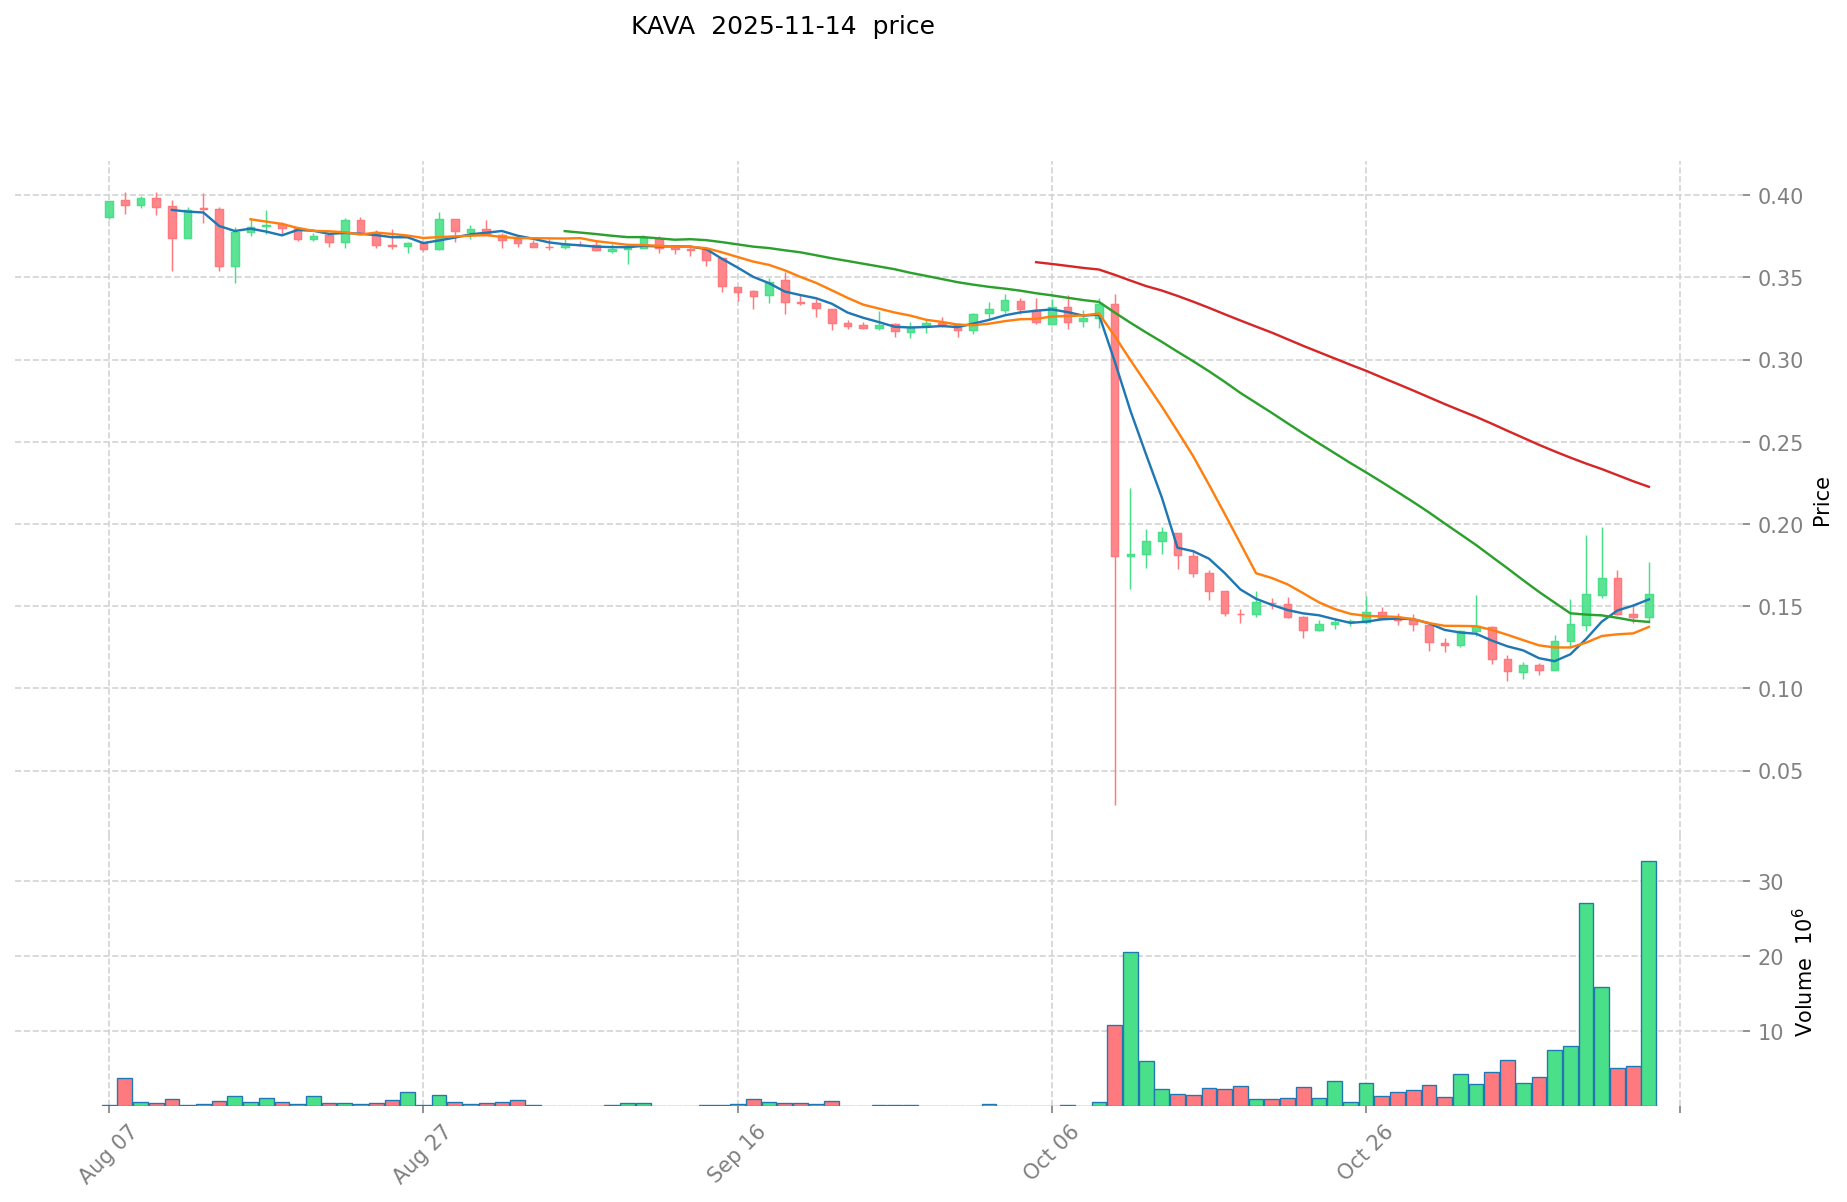
- Comparative analysis: During the market cycle, LINK dropped from its high of $52.7 to a current price of $14.138, while KAVA fell from $9.12 to $0.14589.
Current Market Situation (2025-11-14)
- LINK current price: $14.138
- KAVA current price: $0.14589
- 24-hour trading volume: LINK $14,969,857.78 vs KAVA $5,409,466.35
- Market Sentiment Index (Fear & Greed Index): 16 (Extreme Fear)
Click to view real-time prices:
- Check LINK current price Market Price
- Check KAVA current price Market Price
II. Core Factors Affecting Investment Value of LINK vs KAVA
Supply Mechanisms Comparison (Tokenomics)
- LINK: Maximum supply of 1 billion tokens with 537.1M in circulation, designed to incentivize network participation
- KAVA: Dual-token system with KAVA as governance token; employs inflation-based rewards for validators
Institutional Adoption and Market Applications
- Institutional Holdings: LINK has stronger institutional backing, including from Grayscale and being part of Coinbase's institutional custody service
- Enterprise Adoption: LINK has partnerships with Google Cloud, Swift, and 1,000+ projects while KAVA focuses on cross-chain DeFi applications
- Regulatory Attitudes: Both operate in similar regulatory environments, though LINK's wider adoption may expose it to more regulatory scrutiny
Technological Development and Ecosystem Building
- LINK Technical Upgrades: CCIP (Cross-Chain Interoperability Protocol) enhances cross-chain communication; Staking v0.1 launched for network security
- KAVA Technical Development: Operates Cosmos SDK-based chain with Ethereum compatibility via co-chains
- Ecosystem Comparison: LINK powers a broader ecosystem of DeFi, gaming, and enterprise applications across multiple chains; KAVA focuses specifically on cross-chain lending and DeFi applications
Macroeconomic and Market Cycles
- Inflation Performance: LINK has shown stronger resilience during market volatility due to its broader utility and adoption
- Macroeconomic Monetary Policy: Both are affected by interest rates and dollar strength, with LINK historically showing less correlation to traditional markets
- Geopolitical Factors: LINK's oracle infrastructure may benefit more from global financial uncertainty due to demand for secure data services
III. 2025-2030 Price Prediction: LINK vs KAVA
Short-term Prediction (2025)
- LINK: Conservative $13.75 - $14.18 | Optimistic $14.18 - $20.70
- KAVA: Conservative $0.13 - $0.15 | Optimistic $0.15 - $0.17
Mid-term Prediction (2027)
- LINK may enter a growth phase, with estimated prices ranging from $17.25 to $23.83
- KAVA may enter a growth phase, with estimated prices ranging from $0.13 to $0.22
- Key drivers: Institutional capital inflow, ETF developments, ecosystem growth
Long-term Prediction (2030)
- LINK: Base scenario $16.33 - $24.37 | Optimistic scenario $24.37 - $31.19
- KAVA: Base scenario $0.20 - $0.27 | Optimistic scenario $0.27 - $0.40
Disclaimer: This analysis is based on historical data and market projections. Cryptocurrency markets are highly volatile and unpredictable. This information should not be considered as financial advice. Always conduct your own research before making investment decisions.
LINK:
| 年份 | 预测最高价 | 预测平均价格 | 预测最低价 | 涨跌幅 |
|---|---|---|---|---|
| 2025 | 20.69842 | 14.177 | 13.75169 | 0 |
| 2026 | 18.1352184 | 17.43771 | 12.5551512 | 23 |
| 2027 | 23.833862028 | 17.7864642 | 17.252870274 | 25 |
| 2028 | 23.09928105654 | 20.810163114 | 15.81572396664 | 47 |
| 2029 | 26.7847609440294 | 21.95472208527 | 18.0028721099214 | 55 |
| 2030 | 31.193269138751616 | 24.3697415146497 | 16.327726814815299 | 72 |
KAVA:
| 年份 | 预测最高价 | 预测平均价格 | 预测最低价 | 涨跌幅 |
|---|---|---|---|---|
| 2025 | 0.1686245 | 0.14663 | 0.1275681 | 0 |
| 2026 | 0.2096442425 | 0.15762725 | 0.1056102575 | 8 |
| 2027 | 0.2203628955 | 0.18363574625 | 0.1267086649125 | 25 |
| 2028 | 0.28885902885125 | 0.201999320875 | 0.12927956536 | 38 |
| 2029 | 0.299423593333012 | 0.245429174863125 | 0.181617589398712 | 68 |
| 2030 | 0.400466784624161 | 0.272426384098068 | 0.196146996550609 | 86 |
IV. Investment Strategy Comparison: LINK vs KAVA
Long-term vs Short-term Investment Strategies
- LINK: Suitable for investors focusing on oracle services and cross-chain infrastructure
- KAVA: Suitable for investors interested in DeFi and cross-chain lending platforms
Risk Management and Asset Allocation
- Conservative investors: LINK 70% vs KAVA 30%
- Aggressive investors: LINK 60% vs KAVA 40%
- Hedging tools: Stablecoin allocation, options, cross-currency portfolio
V. Potential Risk Comparison
Market Risks
- LINK: Higher correlation with broader crypto market movements
- KAVA: Potentially higher volatility due to smaller market cap
Technical Risks
- LINK: Scalability, network stability
- KAVA: Network security, smart contract vulnerabilities
Regulatory Risks
- Global regulatory policies may impact both, with LINK potentially facing more scrutiny due to wider adoption
VI. Conclusion: Which Is the Better Buy?
📌 Investment Value Summary:
- LINK advantages: Wider adoption, strong institutional backing, essential oracle infrastructure
- KAVA advantages: Focus on cross-chain DeFi, potential for higher growth from a lower market cap
✅ Investment Advice:
- New investors: Consider a higher allocation to LINK for its established market position
- Experienced investors: Balanced portfolio of both, with a slight bias towards LINK
- Institutional investors: LINK may be more suitable due to its broader ecosystem and institutional adoption
⚠️ Risk Warning: Cryptocurrency markets are highly volatile. This article does not constitute investment advice. None
VII. FAQ
Q1: What are the main differences between LINK and KAVA? A: LINK is a decentralized oracle network, while KAVA is a cross-chain DeFi platform. LINK has a larger market cap, wider adoption, and focuses on providing data to smart contracts across various blockchains. KAVA offers lending and stablecoin services specifically for mainstream digital assets.
Q2: Which coin has shown better price performance historically? A: Historically, LINK has shown better price performance. It reached an all-time high of $52.7 in May 2021, compared to KAVA's all-time high of $9.12 in August 2021. LINK has also maintained a higher current price and market capitalization.
Q3: How do the supply mechanisms of LINK and KAVA differ? A: LINK has a maximum supply of 1 billion tokens with 537.1M in circulation, designed to incentivize network participation. KAVA employs a dual-token system with KAVA as the governance token and uses inflation-based rewards for validators.
Q4: Which coin has stronger institutional adoption? A: LINK has stronger institutional backing, including investments from Grayscale and being part of Coinbase's institutional custody service. It also has partnerships with major companies like Google Cloud and Swift, along with over 1,000 projects integrating its technology.
Q5: What are the key technological developments for each coin? A: LINK has introduced CCIP (Cross-Chain Interoperability Protocol) for enhanced cross-chain communication and launched Staking v0.1 for network security. KAVA operates on a Cosmos SDK-based chain with Ethereum compatibility via co-chains.
Q6: How do the long-term price predictions compare for LINK and KAVA? A: For 2030, LINK's base scenario predicts a range of $16.33 - $24.37, with an optimistic scenario of $24.37 - $31.19. KAVA's base scenario for 2030 is $0.20 - $0.27, with an optimistic scenario of $0.27 - $0.40.
Q7: What are the recommended investment strategies for LINK and KAVA? A: For conservative investors, a suggested allocation is 70% LINK and 30% KAVA. For aggressive investors, the recommendation is 60% LINK and 40% KAVA. New investors might consider a higher allocation to LINK due to its established market position, while experienced investors could maintain a balanced portfolio of both.
Share
Content
Introduction: LINK vs KAVA Investment Comparison
I. Price History Comparison and Current Market Status
II. Core Factors Affecting Investment Value of LINK vs KAVA
III. 2025-2030 Price Prediction: LINK vs KAVA
IV. Investment Strategy Comparison: LINK vs KAVA
V. Potential Risk Comparison
VI. Conclusion: Which Is the Better Buy?
VII. FAQ

