MNT vs MANA: Comparing Two Decentralized Virtual Reality Platforms for the Metaverse
Introduction: Investment Comparison of MNT vs MANA
In the cryptocurrency market, the comparison between Mantle (MNT) vs Decentraland (MANA) has always been a topic that investors cannot avoid. The two not only have significant differences in market cap ranking, application scenarios, and price performance, but also represent different cryptocurrency asset positioning. Mantle (MNT): Since its launch, it has gained market recognition for building the largest sustainable hub for on-chain finance. Decentraland (MANA): Since its inception in 2017, it has been hailed as a virtual world platform based on blockchain, and is one of the cryptocurrencies with the highest global trading volume and market capitalization in its category. This article will comprehensively analyze the investment value comparison between MNT vs MANA, focusing on historical price trends, supply mechanisms, institutional adoption, technological ecosystems, and future predictions, and attempt to answer the question that investors care about most:
"Which is the better buy right now?"
I. Price History Comparison and Current Market Status
MNT (Mantle) and MANA (Decentraland) Historical Price Trends
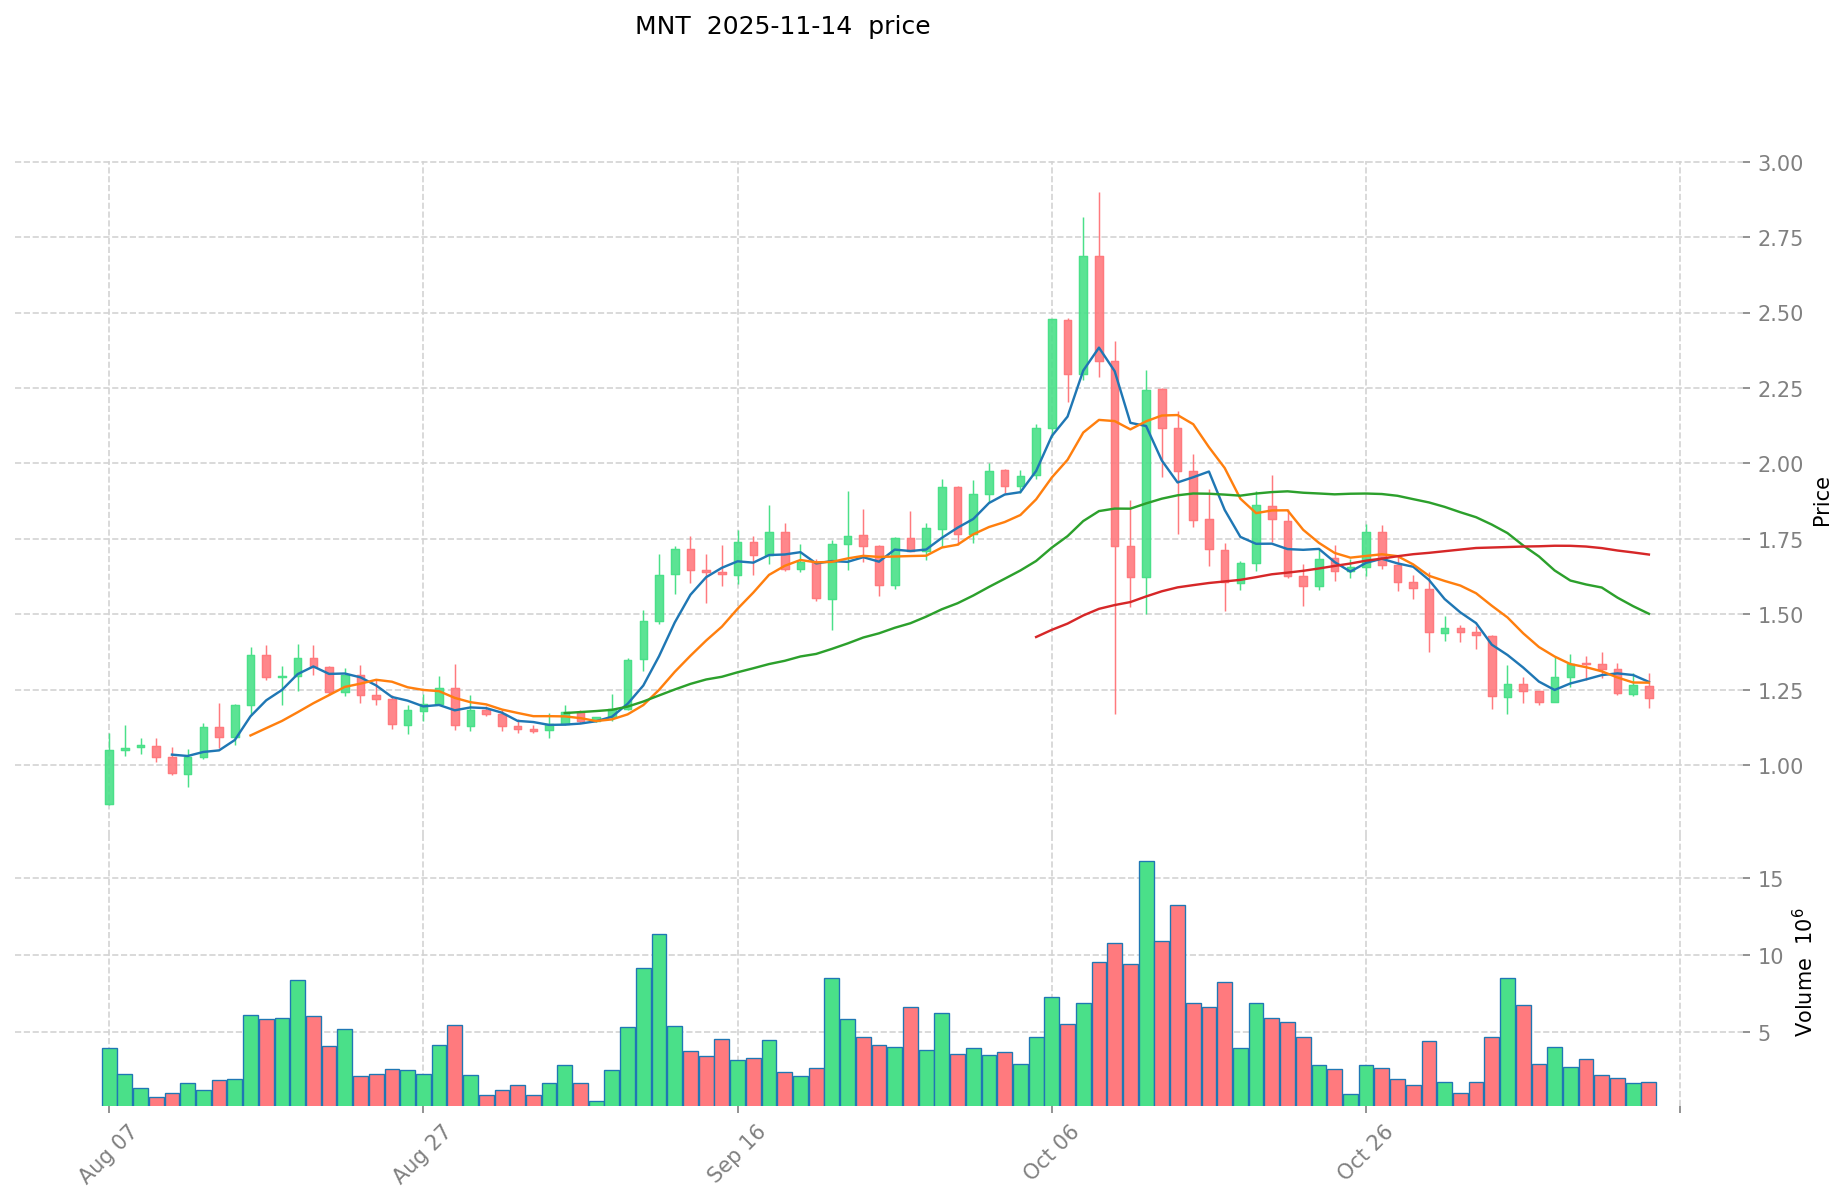
- 2023: MNT launched at $0.25, reaching an all-time high of $2.9 on October 9, 2025.
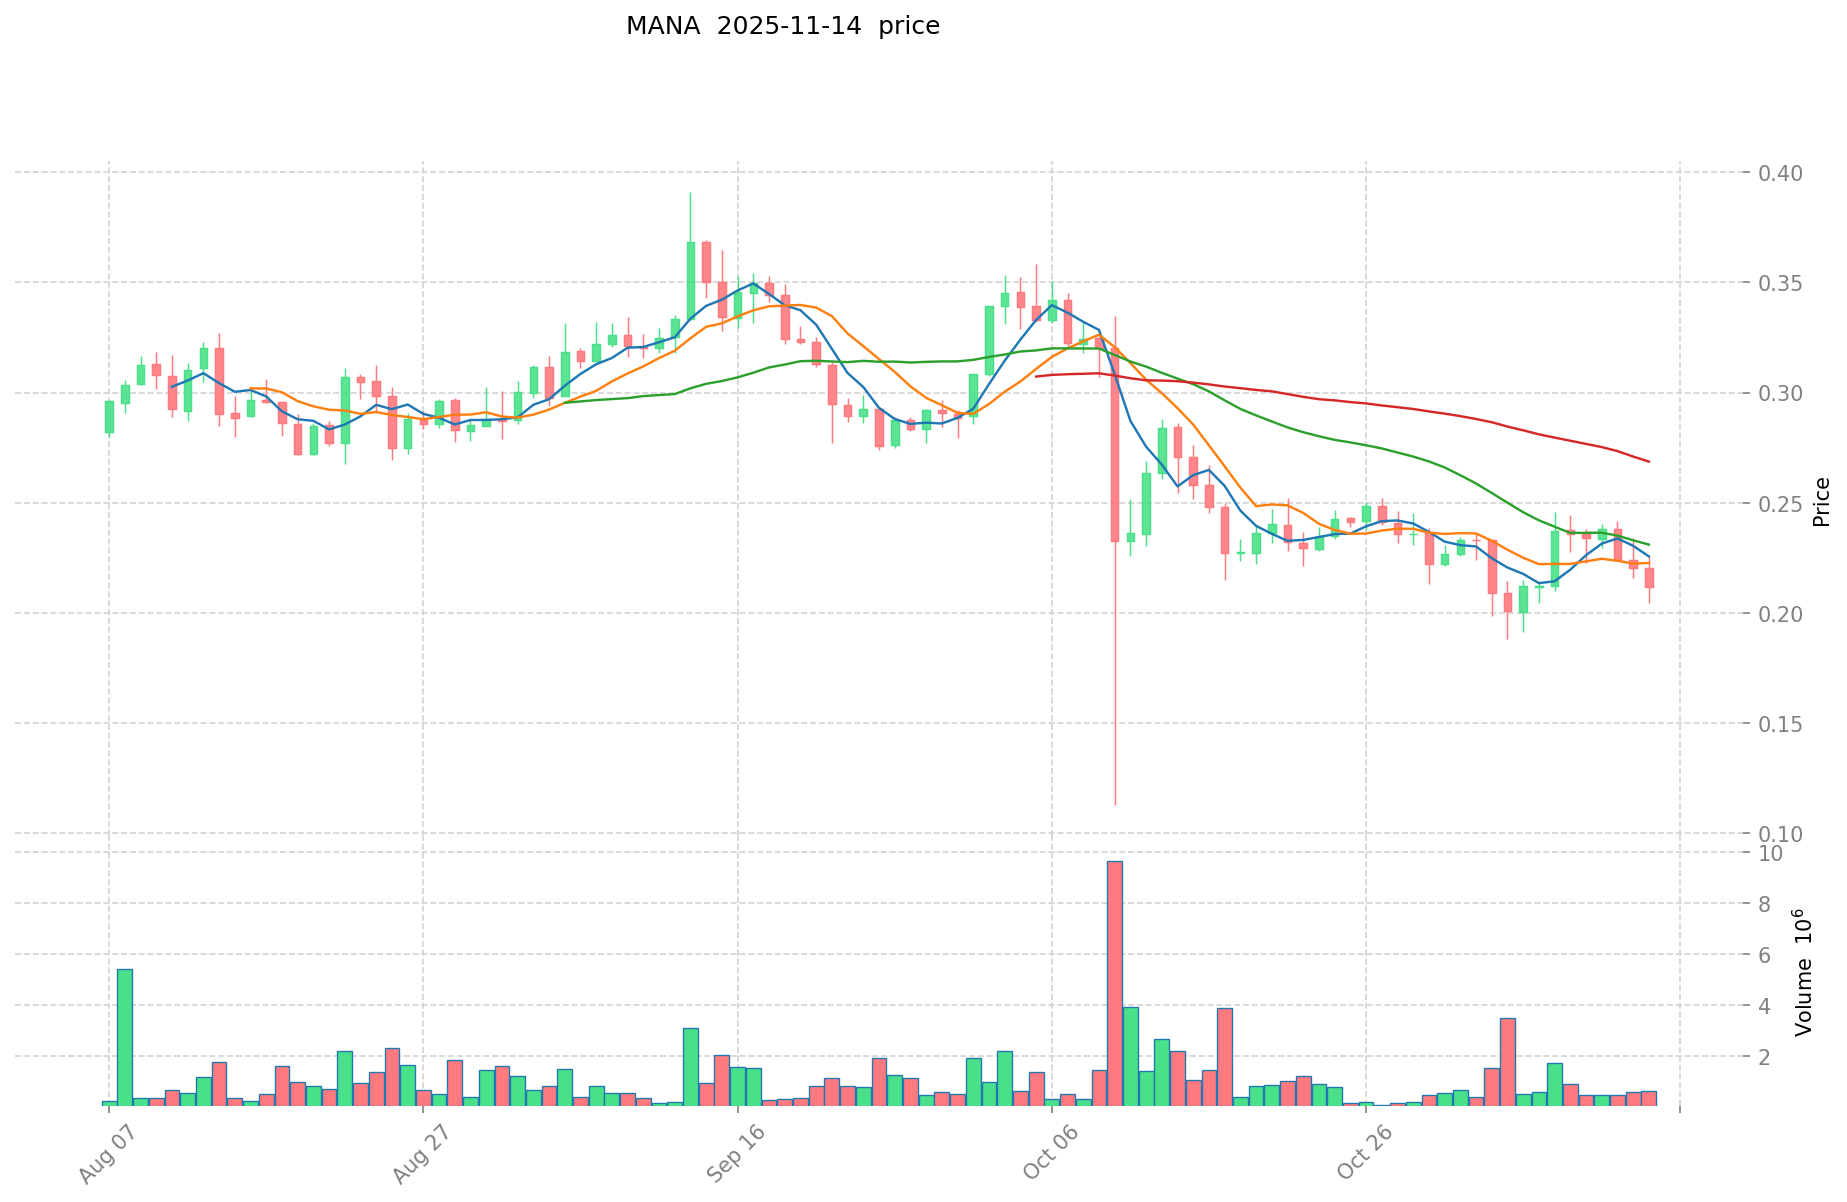
- 2021: MANA hit its all-time high of $5.85 on November 25, 2021, during the peak of the crypto bull market.
- Comparative analysis: Since its launch, MNT has shown significant growth, while MANA has experienced a substantial decline from its all-time high.
Current Market Situation (2025-11-14)
- MNT current price: $1.1693
- MANA current price: $0.2068
- 24-hour trading volume: MNT $2,876,274.77 vs MANA $200,290.22
- Market sentiment index (Fear & Greed Index): 16 (Extreme Fear)
Click to view real-time prices:
- Check MNT current price Market Price
- Check MANA current price Market Price
II. Core Factors Affecting the Investment Value of MNT vs MANA
Supply Mechanisms Comparison (Tokenomics)
- MNT: Limited supply of 1 billion tokens, with a gradual release schedule over multiple years. Approximately 25% of tokens were allocated to early contributors and team members.
- MANA: Fixed maximum supply of 2.19 billion MANA tokens, with approximately 2.16 billion currently in circulation. MANA is burned when used to purchase LAND in Decentraland.
- 📌 Historical pattern: Limited supply tokens like MNT tend to experience more significant price appreciation during bull markets, while MANA's burn mechanism creates deflationary pressure when platform activity increases.
Institutional Adoption and Market Applications
- Institutional holdings: MANA has attracted more institutional interest due to its established presence in the metaverse sector and first-mover advantage in virtual real estate.
- Enterprise adoption: MANA has seen adoption from brands creating virtual experiences in Decentraland, while MNT is primarily focused on financial applications within the Mantle ecosystem.
- Regulatory attitudes: Both tokens operate in regulatory gray areas in most jurisdictions, though metaverse tokens like MANA may face less scrutiny than Layer 2 scaling solutions.
Technical Development and Ecosystem Building
- MNT technical upgrades: Recent launch as Mantle Network's native token with focus on Layer 2 scaling solutions for Ethereum, featuring data availability and EigenDA integration.
- MANA technical development: Established infrastructure for virtual land ownership and marketplace functionality in Decentraland, with ongoing updates to rendering and user experience.
- Ecosystem comparison: MNT focuses on DeFi applications and Ethereum scaling, while MANA has stronger presence in NFTs, virtual real estate, and metaverse experiences.
Macroeconomic Factors and Market Cycles
- Inflation environment performance: Neither token has demonstrated strong anti-inflation properties compared to more established cryptocurrencies.
- Macroeconomic monetary policy: Both tokens show high correlation with overall crypto market movements in response to interest rate changes and USD strength.
- Geopolitical factors: MANA may benefit from increasing interest in digital experiences and remote collaboration, while MNT's scaling solutions address Ethereum's global transaction needs. III. 2025-2030 Price Prediction: MNT vs MANA
Short-term Prediction (2025)
- MNT: Conservative $0.648285 - $1.1787 | Optimistic $1.1787 - $1.508736
- MANA: Conservative $0.16767 - $0.207 | Optimistic $0.207 - $0.27324
Mid-term Prediction (2027)
- MNT may enter a growth phase, with an expected price range of $0.9549131967 - $1.8159005052
- MANA may enter a growth phase, with an expected price range of $0.216324108 - $0.363313566
- Key drivers: Institutional capital inflow, ETF, ecosystem development
Long-term Prediction (2030)
- MNT: Base scenario $1.741790036399036 - $2.07355956714171 | Optimistic scenario $2.07355956714171 - $2.695627437284223
- MANA: Base scenario $0.230715501932916 - $0.4047640384788 | Optimistic scenario $0.4047640384788 - $0.518097969252864
Disclaimer: This analysis is based on historical data and current market conditions. Cryptocurrency markets are highly volatile and unpredictable. This information should not be considered as financial advice. Always conduct your own research before making investment decisions.
MNT:
| 年份 | 预测最高价 | 预测平均价格 | 预测最低价 | 涨跌幅 |
|---|---|---|---|---|
| 2025 | 1.508736 | 1.1787 | 0.648285 | 0 |
| 2026 | 1.78714494 | 1.343718 | 0.99435132 | 14 |
| 2027 | 1.8159005052 | 1.56543147 | 0.9549131967 | 33 |
| 2028 | 2.316212403012 | 1.6906659876 | 1.589226028344 | 43 |
| 2029 | 2.14367993897742 | 2.003439195306 | 1.38237304476114 | 70 |
| 2030 | 2.695627437284223 | 2.07355956714171 | 1.741790036399036 | 76 |
MANA:
| 年份 | 预测最高价 | 预测平均价格 | 预测最低价 | 涨跌幅 |
|---|---|---|---|---|
| 2025 | 0.27324 | 0.207 | 0.16767 | 0 |
| 2026 | 0.3145572 | 0.24012 | 0.144072 | 16 |
| 2027 | 0.363313566 | 0.2773386 | 0.216324108 | 34 |
| 2028 | 0.37157825628 | 0.320326083 | 0.19860217146 | 54 |
| 2029 | 0.4635759073176 | 0.34595216964 | 0.2144903451768 | 67 |
| 2030 | 0.518097969252864 | 0.4047640384788 | 0.230715501932916 | 95 |
IV. Investment Strategy Comparison: MNT vs MANA
Long-term vs Short-term Investment Strategies
- MNT: Suitable for investors focused on DeFi applications and Ethereum scaling solutions
- MANA: Suitable for investors interested in metaverse, virtual real estate, and digital experiences
Risk Management and Asset Allocation
- Conservative investors: MNT: 30% vs MANA: 70%
- Aggressive investors: MNT: 60% vs MANA: 40%
- Hedging tools: Stablecoin allocation, options, cross-currency portfolios
V. Potential Risk Comparison
Market Risks
- MNT: High volatility due to recent launch and limited trading history
- MANA: Dependence on metaverse adoption and virtual real estate market
Technical Risks
- MNT: Scalability, network stability
- MANA: Platform performance, user experience issues
Regulatory Risks
- Global regulatory policies may impact both tokens differently, with potential scrutiny on Layer 2 solutions and virtual asset platforms
VI. Conclusion: Which Is the Better Buy?
📌 Investment Value Summary:
- MNT advantages: Focus on Layer 2 scaling, potential for growth in DeFi applications
- MANA advantages: Established presence in metaverse sector, first-mover advantage in virtual real estate
✅ Investment Advice:
- New investors: Consider a balanced approach with exposure to both tokens
- Experienced investors: Allocate based on risk tolerance and belief in respective ecosystems
- Institutional investors: Evaluate long-term potential of Layer 2 solutions vs metaverse applications
⚠️ Risk Warning: Cryptocurrency markets are highly volatile. This article does not constitute investment advice. None
VII. FAQ
Q1: What are the main differences between MNT and MANA? A: MNT is focused on Layer 2 scaling solutions for Ethereum and DeFi applications, while MANA is centered on the metaverse, virtual real estate, and digital experiences. MNT has a limited supply of 1 billion tokens, while MANA has a fixed maximum supply of 2.19 billion tokens with a burn mechanism.
Q2: Which token has shown better price performance recently? A: Since its launch, MNT has shown significant growth, reaching an all-time high of $2.9 on October 9, 2025. MANA, on the other hand, has experienced a substantial decline from its all-time high of $5.85 in November 2021.
Q3: How do institutional adoption and market applications differ between MNT and MANA? A: MANA has attracted more institutional interest due to its established presence in the metaverse sector and first-mover advantage in virtual real estate. It has also seen adoption from brands creating virtual experiences. MNT is primarily focused on financial applications within the Mantle ecosystem.
Q4: What are the long-term price predictions for MNT and MANA? A: By 2030, MNT's base scenario predicts a price range of $1.74 - $2.07, with an optimistic scenario of $2.07 - $2.70. For MANA, the base scenario predicts $0.23 - $0.40, with an optimistic scenario of $0.40 - $0.52.
Q5: How should investors allocate their assets between MNT and MANA? A: Conservative investors might consider allocating 30% to MNT and 70% to MANA, while aggressive investors might opt for 60% MNT and 40% MANA. The allocation should be based on individual risk tolerance and belief in the respective ecosystems.
Q6: What are the main risks associated with investing in MNT and MANA? A: For MNT, risks include high volatility due to recent launch, limited trading history, and potential scalability issues. MANA faces risks related to dependence on metaverse adoption, virtual real estate market performance, and platform user experience issues. Both tokens may be impacted by evolving regulatory policies.
Share
Content

