PEPE vs ENJ: The Battle of Meme Coins in the Gaming NFT Space
Introduction: Investment Comparison of PEPE vs ENJ
In the cryptocurrency market, the comparison between PEPE vs ENJ has always been an unavoidable topic for investors. The two not only show significant differences in market cap ranking, application scenarios, and price performance but also represent different positions in the crypto asset landscape.
PEPE (PEPE): Launched in 2023, it has gained market recognition as a meme coin.
Enjin Coin (ENJ): Since its launch in 2017, it has been hailed as a platform for the gaming industry, becoming one of the pioneering projects in blockchain gaming.
This article will comprehensively analyze the investment value comparison between PEPE vs ENJ, focusing on historical price trends, supply mechanisms, institutional adoption, technical ecosystems, and future predictions, attempting to answer the question investors are most concerned about:
"Which is the better buy right now?"
I. Price History Comparison and Current Market Status
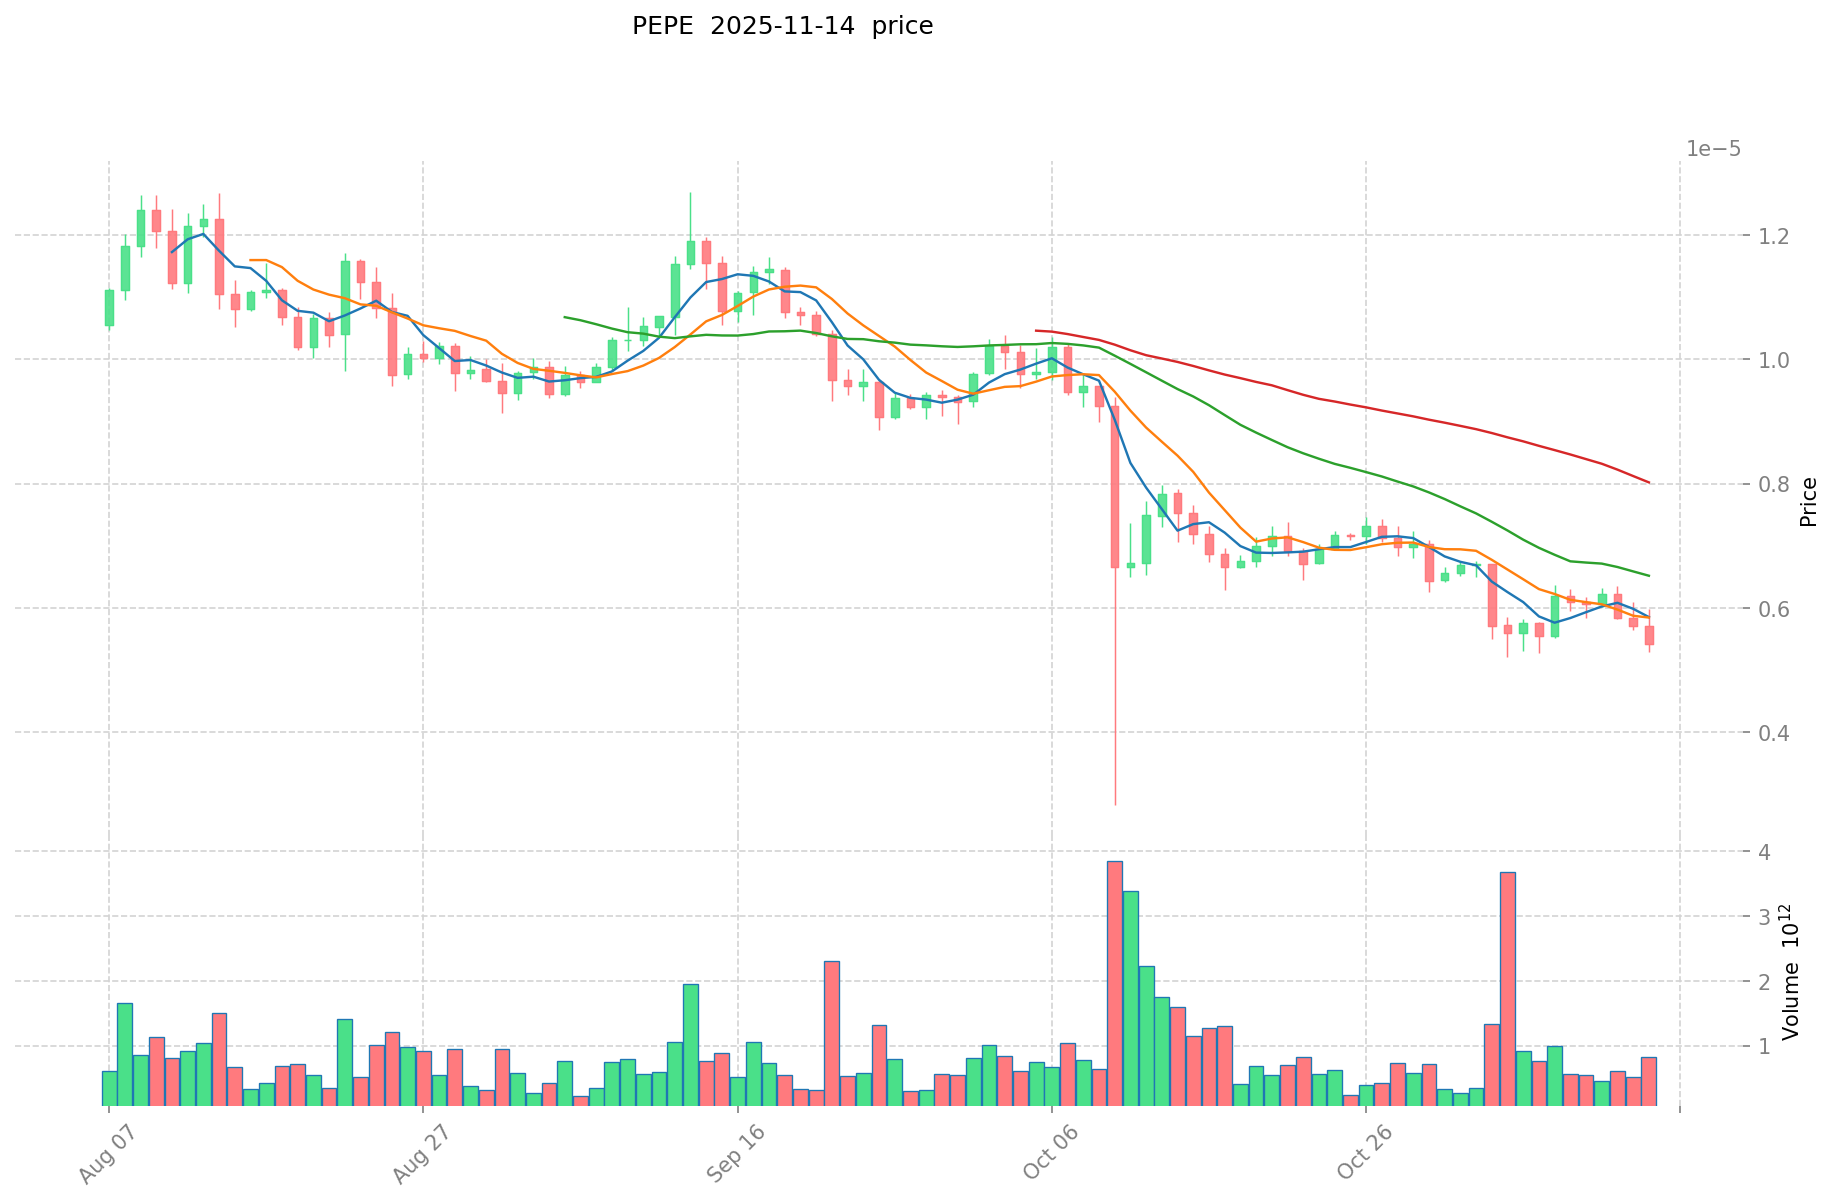
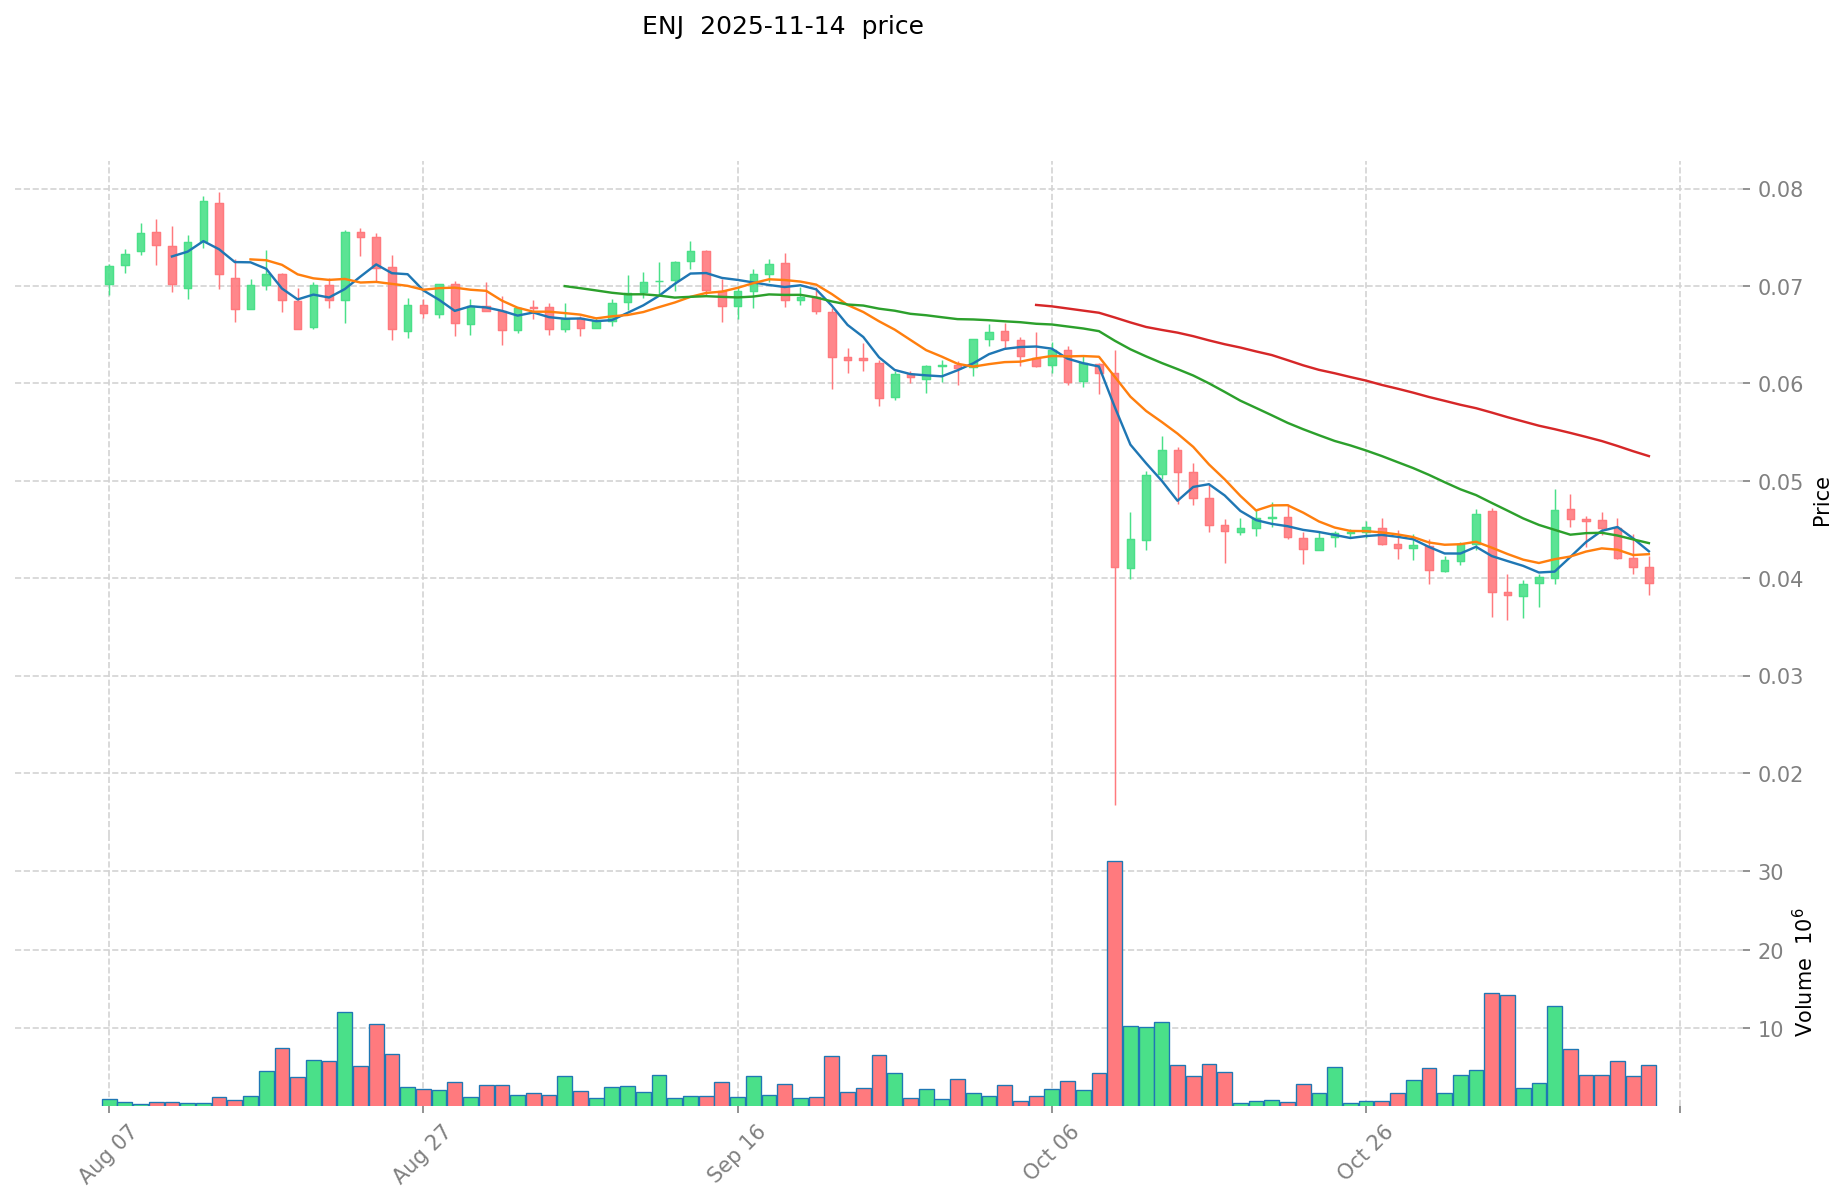
PEPE (Coin A) and ENJ (Coin B) Historical Price Trends
- 2023: PEPE launched as a meme coin, experiencing significant price volatility.
- 2021: ENJ reached its all-time high of $4.82 on November 25, driven by the growing interest in blockchain gaming.
- Comparative analysis: During the recent market cycle, PEPE has shown extreme volatility typical of meme coins, while ENJ has experienced a significant decline from its all-time high.
Current Market Situation (2025-11-14)
- PEPE current price: $0.000005175
- ENJ current price: $0.03932
- 24-hour trading volume: PEPE $7,100,680.14 vs ENJ $168,067.13
- Market Sentiment Index (Fear & Greed Index): 16 (Extreme Fear)
Click to view real-time prices:
- View PEPE current price Market Price
- View ENJ current price Market Price
II. Key Factors Affecting the Investment Value of PEPE vs ENJ
Supply Mechanism Comparison (Tokenomics)
- PEPE: Fixed supply of 420.69 trillion tokens with no additional minting capability, creating scarcity in the long term
- ENJ: Capped supply of 1 billion tokens with a deflationary mechanism through token locking in NFTs and gaming assets
- 📌 Historical pattern: Fixed supply tokens like PEPE tend to experience more volatile price movements based on market sentiment, while ENJ's deflationary mechanism creates upward price pressure when adoption increases.
Institutional Adoption and Market Applications
- Institutional holdings: ENJ has gained more institutional recognition through partnerships with Microsoft and Samsung, while PEPE remains primarily retail-driven
- Enterprise adoption: ENJ has established real use cases in gaming ecosystems and NFT marketplaces, whereas PEPE lacks practical applications beyond trading and speculation
- Regulatory attitudes: ENJ benefits from clearer regulatory standing as a utility token, while meme coins like PEPE face higher regulatory scrutiny in many jurisdictions
Technical Development and Ecosystem Building
- PEPE technical framework: Built on Ethereum as an ERC-20 token with limited technical development beyond the initial deployment
- ENJ technical development: Continuous improvements to the Enjin platform including Efinity parachain on Polkadot, JumpNet for scaling, and advanced NFT capabilities
- Ecosystem comparison: ENJ has established an extensive gaming ecosystem with over 250,000 gaming communities and numerous NFT projects, while PEPE's ecosystem is primarily centered around trading, memes, and community engagement
Macroeconomic Factors and Market Cycles
- Performance during inflation: ENJ potentially offers better inflation protection through its utility value and deflationary mechanism, while PEPE acts more as a speculative asset
- Macroeconomic monetary policy: Both are affected by interest rates and USD strength, but ENJ's utility may provide some buffer during economic downturns
- Geopolitical factors: ENJ's gaming focus makes it less susceptible to cross-border transaction needs, while PEPE's value is more driven by global market sentiment and social media trends
III. 2025-2030 Price Prediction: PEPE vs ENJ
Short-term Prediction (2025)
- PEPE: Conservative $0.00000392464 - $0.000005164 | Optimistic $0.000005164 - $0.0000069714
- ENJ: Conservative $0.0303226 - $0.03938 | Optimistic $0.03938 - $0.0417428
Mid-term Prediction (2027)
- PEPE may enter a growth phase, with estimated price range of $0.000007025486445 - $0.0000105760011
- ENJ may enter a growth phase, with estimated price range of $0.04632517494 - $0.07096622544
- Key drivers: Institutional capital inflow, ETF, ecosystem development
Long-term Prediction (2030)
- PEPE: Base scenario $0.00001121199648 - $0.000015136195248 | Optimistic scenario $0.000015136195248
- ENJ: Base scenario $0.080829421928887 - $0.096995306314665 | Optimistic scenario $0.096995306314665
Disclaimer: This analysis is for informational purposes only and should not be considered as financial advice. Cryptocurrency markets are highly volatile and unpredictable. Always conduct your own research before making any investment decisions.
PEPE:
| 年份 | 预测最高价 | 预测平均价格 | 预测最低价 | 涨跌幅 |
|---|---|---|---|---|
| 2025 | 0.0000069714 | 0.000005164 | 0.00000392464 | 0 |
| 2026 | 0.000009040873 | 0.0000060677 | 0.000003337235 | 17 |
| 2027 | 0.0000105760011 | 0.0000075542865 | 0.000007025486445 | 45 |
| 2028 | 0.000009699703866 | 0.0000090651438 | 0.000005620389156 | 75 |
| 2029 | 0.000013041569127 | 0.000009382423833 | 0.000006661520921 | 81 |
| 2030 | 0.000015136195248 | 0.00001121199648 | 0.000010090796832 | 116 |
ENJ:
| 年份 | 预测最高价 | 预测平均价格 | 预测最低价 | 涨跌幅 |
|---|---|---|---|---|
| 2025 | 0.0417428 | 0.03938 | 0.0303226 | 0 |
| 2026 | 0.058002802 | 0.0405614 | 0.032854734 | 3 |
| 2027 | 0.07096622544 | 0.049282101 | 0.04632517494 | 25 |
| 2028 | 0.0835725868758 | 0.06012416322 | 0.0324670481388 | 52 |
| 2029 | 0.089810468809875 | 0.0718483750479 | 0.059634151289757 | 82 |
| 2030 | 0.096995306314665 | 0.080829421928887 | 0.051730830034488 | 105 |
IV. Investment Strategy Comparison: PEPE vs ENJ
Long-term vs Short-term Investment Strategies
- PEPE: Suitable for investors focused on high-risk, high-reward opportunities and meme-driven market sentiment
- ENJ: Suitable for investors interested in blockchain gaming ecosystems and NFT market growth
Risk Management and Asset Allocation
- Conservative investors: PEPE: 5% vs ENJ: 15%
- Aggressive investors: PEPE: 15% vs ENJ: 25%
- Hedging tools: Stablecoin allocation, options, cross-currency portfolio
V. Potential Risk Comparison
Market Risks
- PEPE: Extreme volatility, susceptibility to market manipulation, and dependence on social media trends
- ENJ: Vulnerability to gaming industry cycles and overall crypto market sentiment
Technical Risks
- PEPE: Limited technical development, potential smart contract vulnerabilities
- ENJ: Scalability challenges, network stability during high-traffic periods
Regulatory Risks
- Global regulatory policies may have a more severe impact on meme coins like PEPE compared to utility tokens like ENJ
VI. Conclusion: Which Is the Better Buy?
📌 Investment Value Summary:
- PEPE advantages: High potential for short-term gains, strong community engagement
- ENJ advantages: Established use cases in gaming, ongoing technical development, institutional partnerships
✅ Investment Advice:
- New investors: Consider ENJ for its more established ecosystem and clearer use case
- Experienced investors: Balanced approach with higher allocation to ENJ, small allocation to PEPE for potential upside
- Institutional investors: Focus on ENJ due to its utility token status and partnerships with major tech companies
⚠️ Risk Warning: Cryptocurrency markets are highly volatile. This article does not constitute investment advice. None
VII. FAQ
Q1: What are the main differences between PEPE and ENJ? A: PEPE is a meme coin launched in 2023, while ENJ is a utility token for the gaming industry launched in 2017. PEPE has a fixed supply of 420.69 trillion tokens, whereas ENJ has a capped supply of 1 billion tokens with a deflationary mechanism. ENJ has established use cases in gaming and NFTs, while PEPE is primarily used for trading and speculation.
Q2: Which coin has shown better price performance recently? A: As of 2025-11-14, PEPE is priced at $0.000005175, while ENJ is at $0.03932. PEPE has shown more extreme volatility typical of meme coins, while ENJ has experienced a significant decline from its all-time high of $4.82 in 2021.
Q3: How do institutional adoption and market applications differ between PEPE and ENJ? A: ENJ has gained more institutional recognition through partnerships with Microsoft and Samsung, and has established real use cases in gaming ecosystems and NFT marketplaces. PEPE remains primarily retail-driven and lacks practical applications beyond trading and speculation.
Q4: What are the long-term price predictions for PEPE and ENJ? A: By 2030, PEPE's base scenario price range is predicted to be $0.00001121199648 - $0.000015136195248, while ENJ's base scenario price range is estimated at $0.080829421928887 - $0.096995306314665.
Q5: How should investors allocate their portfolio between PEPE and ENJ? A: For conservative investors, a suggested allocation is 5% PEPE and 15% ENJ. For aggressive investors, the suggested allocation is 15% PEPE and 25% ENJ. It's important to balance risk and potential returns based on individual risk tolerance.
Q6: What are the main risks associated with investing in PEPE and ENJ? A: PEPE faces risks of extreme volatility, market manipulation, and dependence on social media trends. ENJ is vulnerable to gaming industry cycles and overall crypto market sentiment. Both face regulatory risks, with PEPE potentially more susceptible to regulatory scrutiny.
Q7: Which coin is considered a better buy for different types of investors? A: New investors might consider ENJ for its more established ecosystem and clearer use case. Experienced investors could take a balanced approach with a higher allocation to ENJ and a small allocation to PEPE for potential upside. Institutional investors may focus on ENJ due to its utility token status and partnerships with major tech companies.
Share
Content
Introduction: Investment Comparison of PEPE vs ENJ
I. Price History Comparison and Current Market Status
II. Key Factors Affecting the Investment Value of PEPE vs ENJ
III. 2025-2030 Price Prediction: PEPE vs ENJ
IV. Investment Strategy Comparison: PEPE vs ENJ
V. Potential Risk Comparison
VI. Conclusion: Which Is the Better Buy?
VII. FAQ

