PNUT vs LTC: A Comparative Analysis of Two Emerging Cryptocurrencies
Introduction: PNUT vs LTC Investment Comparison
In the cryptocurrency market, the comparison between PNUT and LTC has been an unavoidable topic for investors. The two not only show significant differences in market cap ranking, application scenarios, and price performance but also represent different cryptocurrency asset positions.
Peanut the Squirrel (PNUT): Since its launch, it has gained market recognition for its unique position as a blockchain-based movement demanding reform to governmental overreach.
Litecoin (LTC): Since its introduction in 2011, it has been hailed as the "silver to Bitcoin's gold" and is one of the cryptocurrencies with the highest global trading volume and market capitalization.
This article will comprehensively analyze the investment value comparison between PNUT and LTC, focusing on historical price trends, supply mechanisms, institutional adoption, technological ecosystems, and future predictions, attempting to answer the question investors care about most:
"Which is the better buy right now?"
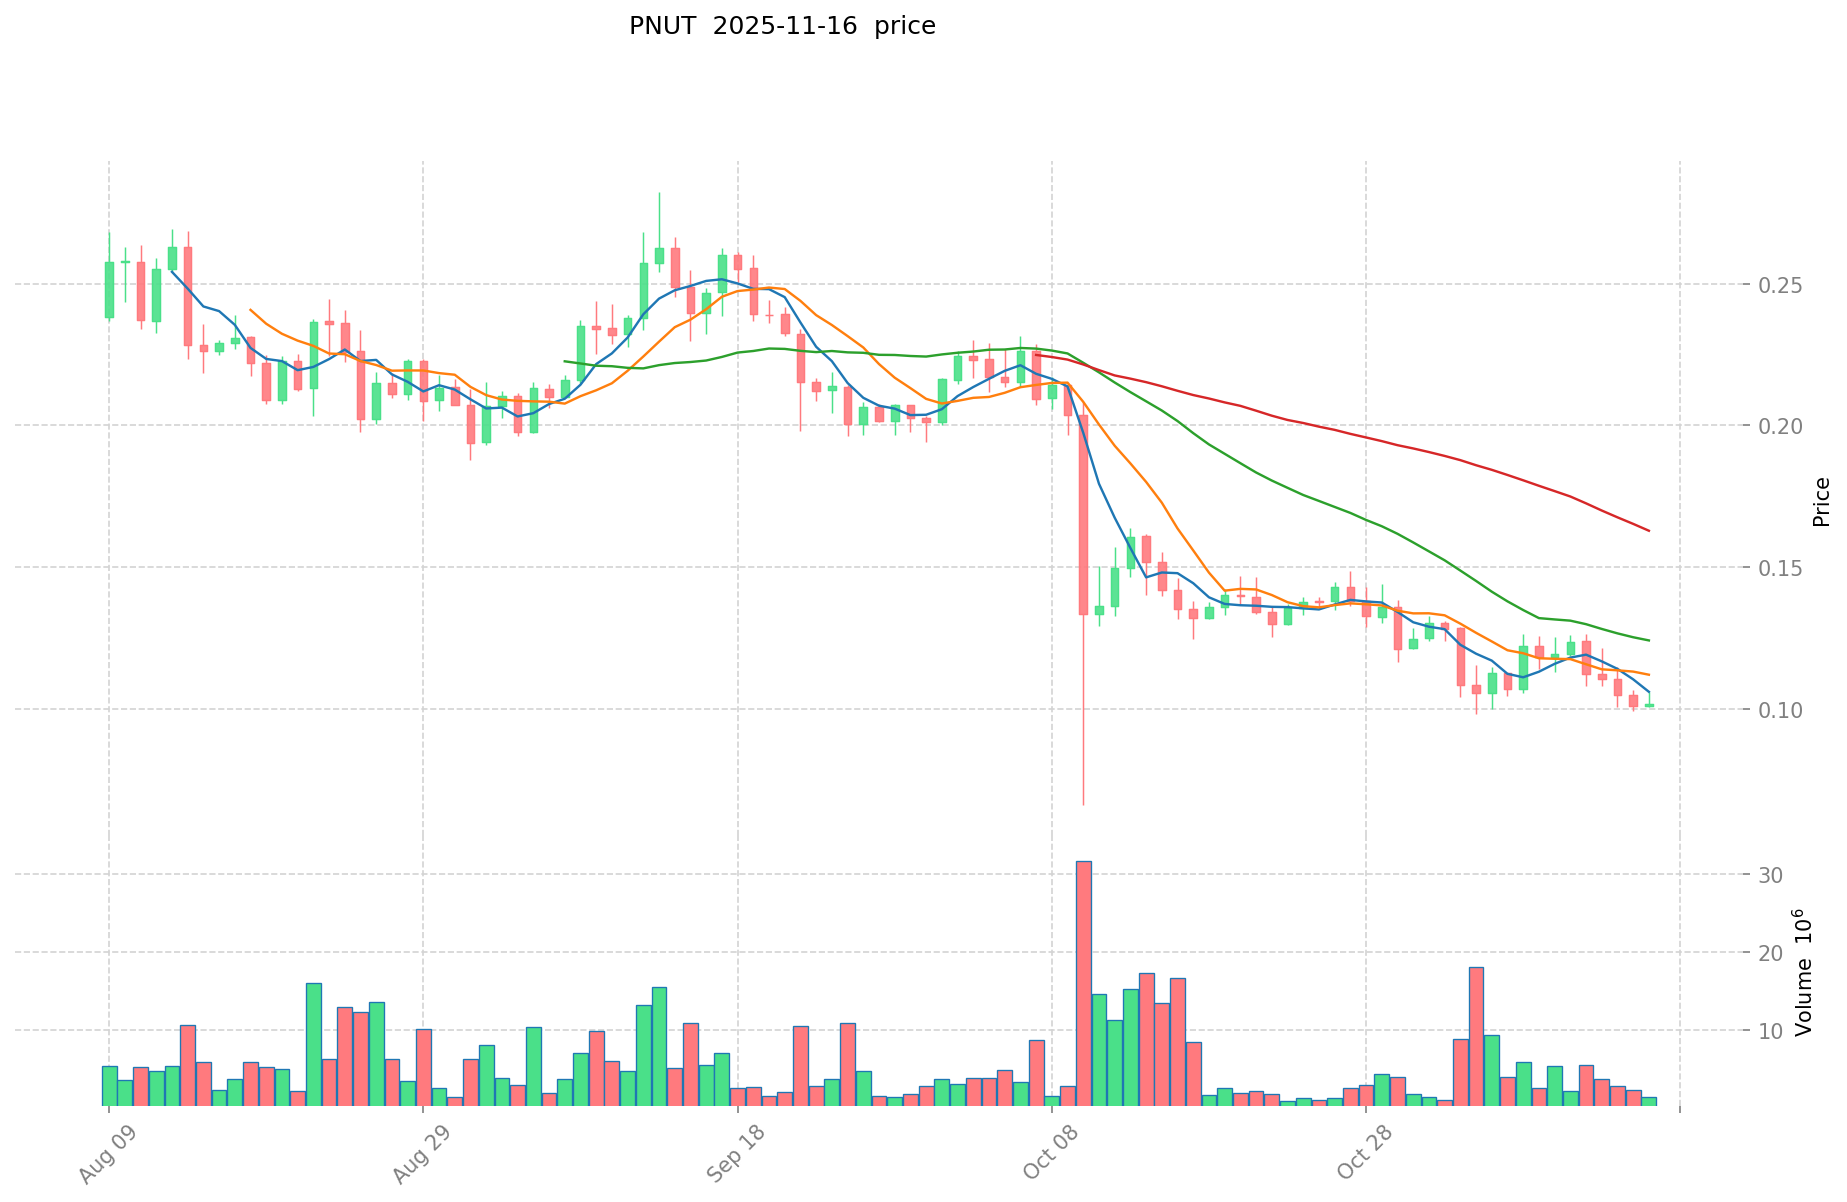
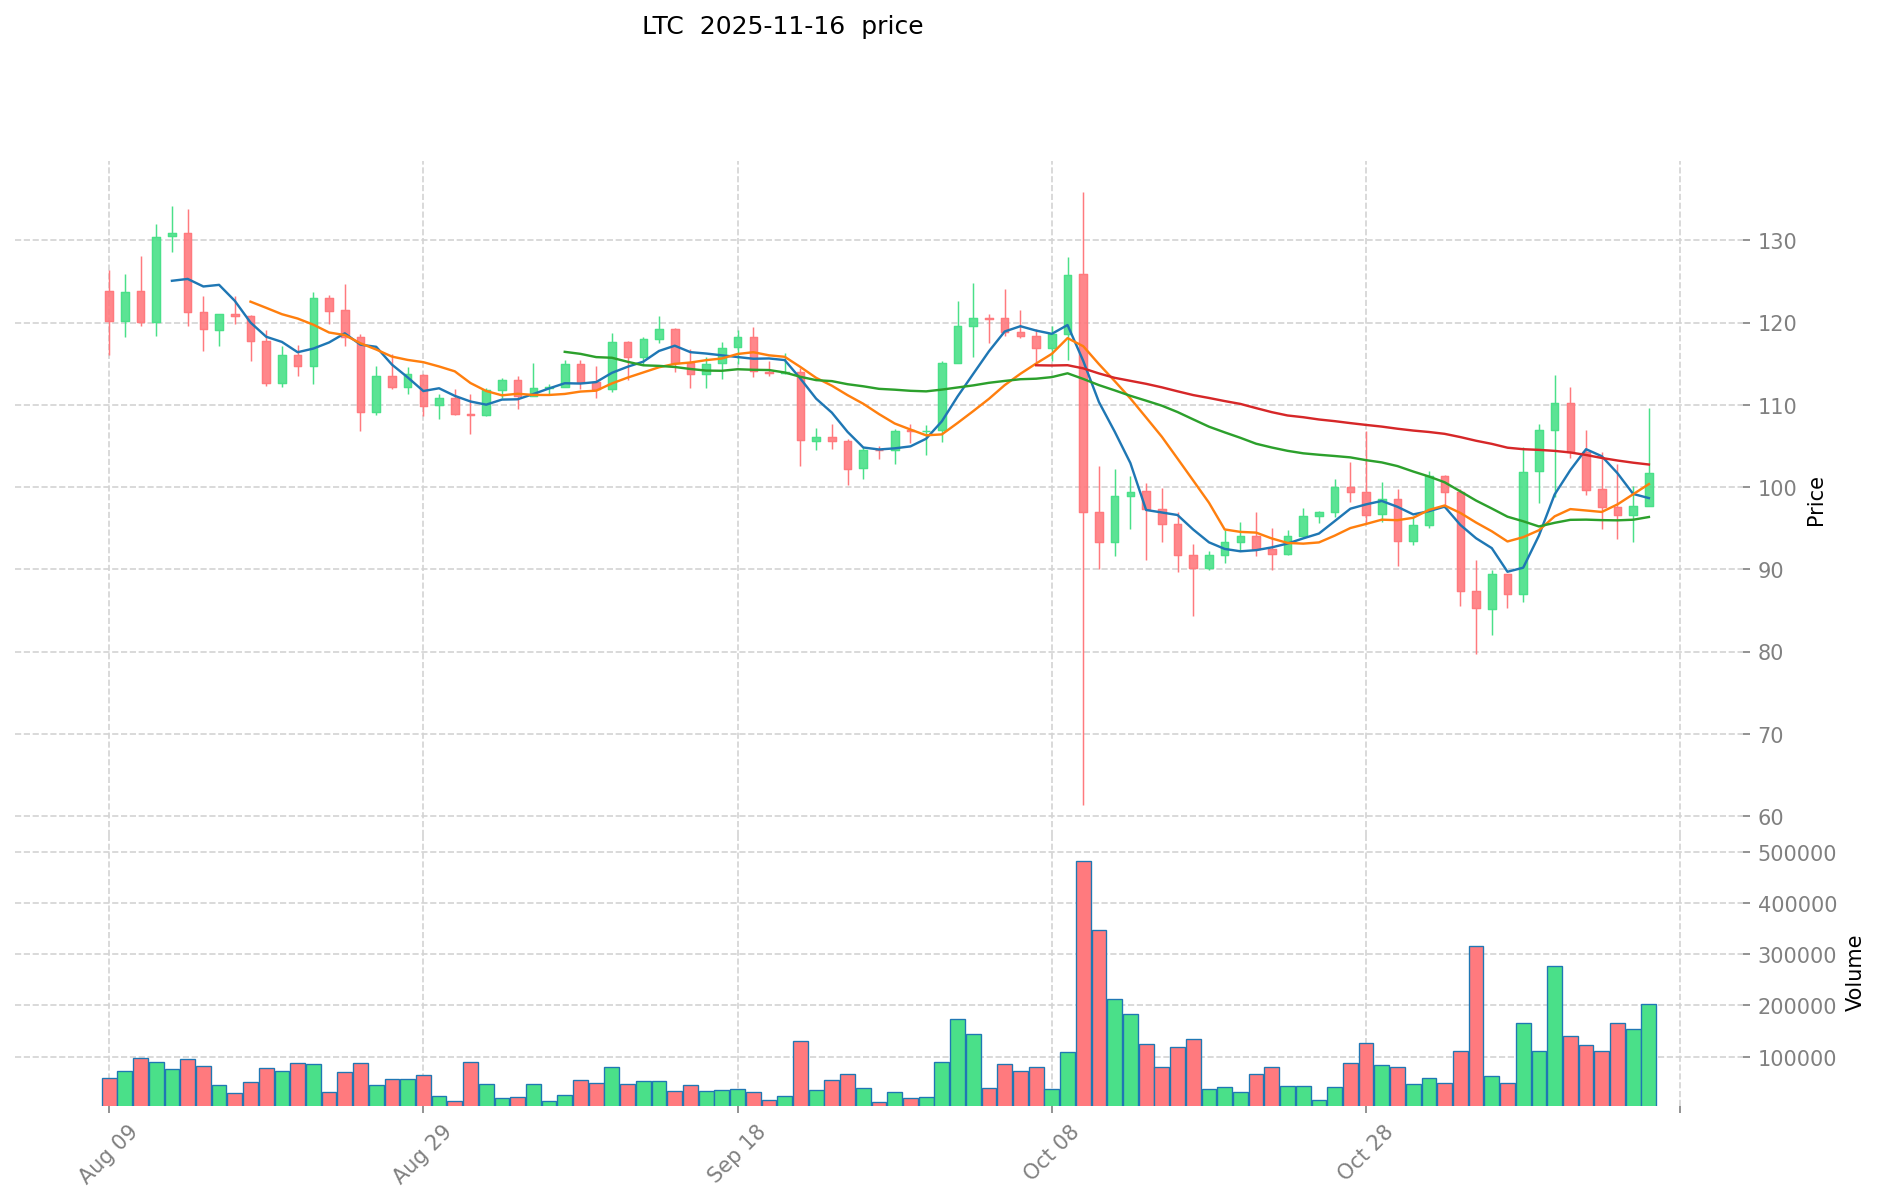
I. Price History Comparison and Current Market Status
PNUT and LTC Historical Price Trends
- 2024: PNUT reached its all-time high of $2.50119 on November 14, 2024.
- 2021: LTC hit its all-time high of $410.26 on May 10, 2021, during the crypto bull market.
- Comparative analysis: PNUT has experienced significant volatility, dropping from its all-time high of $2.50119 to a low of $0.048. LTC, being a more established cryptocurrency, has shown resilience over a longer period, with its price ranging from an all-time low of $1.15 to its peak of $410.26.
Current Market Situation (2025-11-16)
- PNUT current price: $0.097
- LTC current price: $100.73
- 24-hour trading volume: PNUT $161,228.29676 vs LTC $10,428,527.641652
- Market Sentiment Index (Fear & Greed Index): 10 (Extreme Fear)
Click to view real-time prices:
- Check PNUT current price Market Price
- Check LTC current price Market Price
II. Core Factors Affecting the Investment Value of PNUT vs LTC
Supply Mechanisms Comparison (Tokenomics)
- PNUT: Limited supply with a maximum cap of 10,000,000 tokens
- LTC: Fixed supply cap of 84 million coins with halving mechanism every 4 years
- 📌 Historical Pattern: Limited supply cryptocurrencies like LTC have historically shown cyclical price movements around halving events, while newer tokens like PNUT with smaller caps may experience more volatile price discovery phases.
Institutional Adoption and Market Applications
- Institutional Holdings: LTC has greater institutional adoption as one of the oldest cryptocurrencies, while PNUT lacks significant institutional backing at present
- Enterprise Adoption: LTC is used in various payment solutions and cross-border transactions; PNUT has minimal documented enterprise usage
- Regulatory Stance: LTC benefits from greater regulatory clarity in most jurisdictions as an established cryptocurrency; PNUT faces uncertain regulatory status in most regions
Technical Development and Ecosystem Building
- PNUT Technical Features: Focus on community governance and utility within the Peanut platform
- LTC Technical Development: Implementation of MimbleWimble Extension Blocks (MWEB) for enhanced privacy and scalability, active development and updates
- Ecosystem Comparison: LTC has established integrations across payment platforms, exchanges, and some DeFi applications; PNUT has a more limited ecosystem focused on its specific use cases
Macroeconomic Factors and Market Cycles
- Performance During Inflation: LTC has demonstrated some store-of-value properties during inflationary periods, though less pronounced than Bitcoin; PNUT lacks historical data for comparison
- Monetary Policy Impact: Both tokens are affected by broader market sentiment during interest rate changes, with LTC typically showing higher correlation to traditional market movements
- Geopolitical Factors: LTC's established network and liquidity provide advantages for cross-border transactions during uncertain geopolitical situations; PNUT's smaller market presence limits its utility in this context
III. 2025-2030 Price Prediction: PNUT vs LTC
Short-term Prediction (2025)
- PNUT: Conservative $0.05141-$0.097 | Optimistic $0.097-$0.13774
- LTC: Conservative $71.5183-$100.73 | Optimistic $100.73-$123.8979
Mid-term Prediction (2027)
- PNUT may enter a growth phase, with an estimated price range of $0.085198883-$0.188554905
- LTC may enter a consolidation phase, with an estimated price range of $77.99080688-$147.62545588
- Key drivers: Institutional capital inflow, ETF, ecosystem development
Long-term Prediction (2030)
- PNUT: Base scenario $0.119517710628566-$0.202572390895875 | Optimistic scenario $0.202572390895875-$0.218778182167545
- LTC: Base scenario $96.32735222061798-$188.877161216898 | Optimistic scenario $188.877161216898-$262.53925409148822
Disclaimer: The above predictions are based on historical data and current market trends. Cryptocurrency markets are highly volatile and subject to rapid changes. These projections should not be considered as financial advice or guarantees of future performance. Always conduct your own research and consult with financial professionals before making investment decisions.
PNUT:
| 年份 | 预测最高价 | 预测平均价格 | 预测最低价 | 涨跌幅 |
|---|---|---|---|---|
| 2025 | 0.13774 | 0.097 | 0.05141 | 0 |
| 2026 | 0.1619706 | 0.11737 | 0.105633 | 21 |
| 2027 | 0.188554905 | 0.1396703 | 0.085198883 | 43 |
| 2028 | 0.182164988775 | 0.1641126025 | 0.1050320656 | 69 |
| 2029 | 0.23200598615425 | 0.1731387956375 | 0.12119715694625 | 78 |
| 2030 | 0.218778182167545 | 0.202572390895875 | 0.119517710628566 | 108 |
LTC:
| 年份 | 预测最高价 | 预测平均价格 | 预测最低价 | 涨跌幅 |
|---|---|---|---|---|
| 2025 | 123.8979 | 100.73 | 71.5183 | 0 |
| 2026 | 166.224646 | 112.31395 | 89.85116 | 11 |
| 2027 | 147.62545588 | 139.269298 | 77.99080688 | 38 |
| 2028 | 187.9160637914 | 143.44737694 | 111.8889540132 | 42 |
| 2029 | 212.072602068096 | 165.6817203657 | 117.634021459647 | 64 |
| 2030 | 262.53925409148822 | 188.877161216898 | 96.32735222061798 | 87 |
IV. Investment Strategy Comparison: PNUT vs LTC
Long-term vs Short-term Investment Strategies
- PNUT: Suitable for investors focused on community-driven projects and potential growth in niche markets
- LTC: Suitable for investors seeking established networks, broader adoption, and relative stability
Risk Management and Asset Allocation
- Conservative investors: PNUT: 5% vs LTC: 95%
- Aggressive investors: PNUT: 30% vs LTC: 70%
- Hedging tools: Stablecoin allocation, options, cross-currency portfolio
V. Potential Risk Comparison
Market Risks
- PNUT: High volatility, limited liquidity, and susceptibility to market manipulation
- LTC: Correlation with broader crypto market trends, competition from newer technologies
Technical Risks
- PNUT: Scalability, network stability, limited development resources
- LTC: Mining centralization, potential security vulnerabilities in future upgrades
Regulatory Risks
- Global regulatory policies may have a more significant impact on newer, less established tokens like PNUT compared to LTC, which has a longer history of regulatory scrutiny
VI. Conclusion: Which Is the Better Buy?
📌 Investment Value Summary:
- PNUT advantages: Potential for high growth, unique position in niche market
- LTC advantages: Established network, wider adoption, proven track record
✅ Investment Advice:
- Novice investors: Consider a small allocation to LTC as part of a diversified crypto portfolio
- Experienced investors: Explore a balanced approach with a majority in LTC and a smaller speculative position in PNUT
- Institutional investors: Focus primarily on LTC due to its liquidity and established market presence
⚠️ Risk Warning: The cryptocurrency market is highly volatile. This article does not constitute investment advice. None
VII. FAQ
Q1: What are the key differences between PNUT and LTC? A: PNUT is a newer, community-driven token with a limited supply of 10 million, while LTC is an established cryptocurrency with a supply cap of 84 million. LTC has broader adoption and institutional backing, whereas PNUT focuses on niche markets and community governance.
Q2: Which cryptocurrency has shown better price performance historically? A: LTC has demonstrated better long-term price performance and stability. It reached an all-time high of $410.26 in May 2021, while PNUT's all-time high was $2.50119 in November 2024. LTC has also shown more resilience over time.
Q3: How do the supply mechanisms of PNUT and LTC compare? A: PNUT has a fixed maximum supply of 10 million tokens. LTC has a supply cap of 84 million coins with a halving mechanism every 4 years, which can potentially impact its price cyclically.
Q4: What are the main risks associated with investing in PNUT and LTC? A: PNUT risks include high volatility, limited liquidity, and potential market manipulation. LTC faces risks such as correlation with broader crypto market trends and competition from newer technologies. Both are subject to regulatory risks, with PNUT potentially more vulnerable due to its newer status.
Q5: How do institutional adoption and market applications differ between PNUT and LTC? A: LTC has greater institutional adoption and is used in various payment solutions and cross-border transactions. PNUT lacks significant institutional backing and has minimal documented enterprise usage at present.
Q6: What are the price predictions for PNUT and LTC in 2030? A: For PNUT, the base scenario predicts a range of $0.119517710628566-$0.202572390895875, with an optimistic scenario of $0.202572390895875-$0.218778182167545. For LTC, the base scenario predicts $96.32735222061798-$188.877161216898, with an optimistic scenario of $188.877161216898-$262.53925409148822.
Q7: How should investors allocate their portfolio between PNUT and LTC? A: Conservative investors might consider allocating 5% to PNUT and 95% to LTC, while more aggressive investors could allocate 30% to PNUT and 70% to LTC. The exact allocation should depend on individual risk tolerance and investment goals.
Share
Content
Introduction: PNUT vs LTC Investment Comparison
I. Price History Comparison and Current Market Status
II. Core Factors Affecting the Investment Value of PNUT vs LTC
III. 2025-2030 Price Prediction: PNUT vs LTC
IV. Investment Strategy Comparison: PNUT vs LTC
V. Potential Risk Comparison
VI. Conclusion: Which Is the Better Buy?
VII. FAQ

