S vs XTZ: Comparing the Performance and Potential of Two Cryptocurrencies
Introduction: Investment Comparison of S vs XTZ
In the cryptocurrency market, the comparison between Sonic (S) and Tezos (XTZ) remains an unavoidable topic for investors. The two not only differ significantly in market cap ranking, application scenarios, and price performance, but also represent different crypto asset positioning.
Sonic (S): Launched as an EVM L1 platform offering attractive incentives and powerful infrastructure for DeFi.
Tezos (XTZ): Introduced in 2017, it has been hailed as a self-evolving crypto ledger, gaining market recognition for its ability to simplify formal verification through a real digital federation.
This article will comprehensively analyze the investment value comparison between S and XTZ, focusing on historical price trends, supply mechanisms, institutional adoption, technological ecosystems, and future predictions, attempting to answer the question investors care about most:
"Which is the better buy right now?"
I. Price History Comparison and Current Market Status
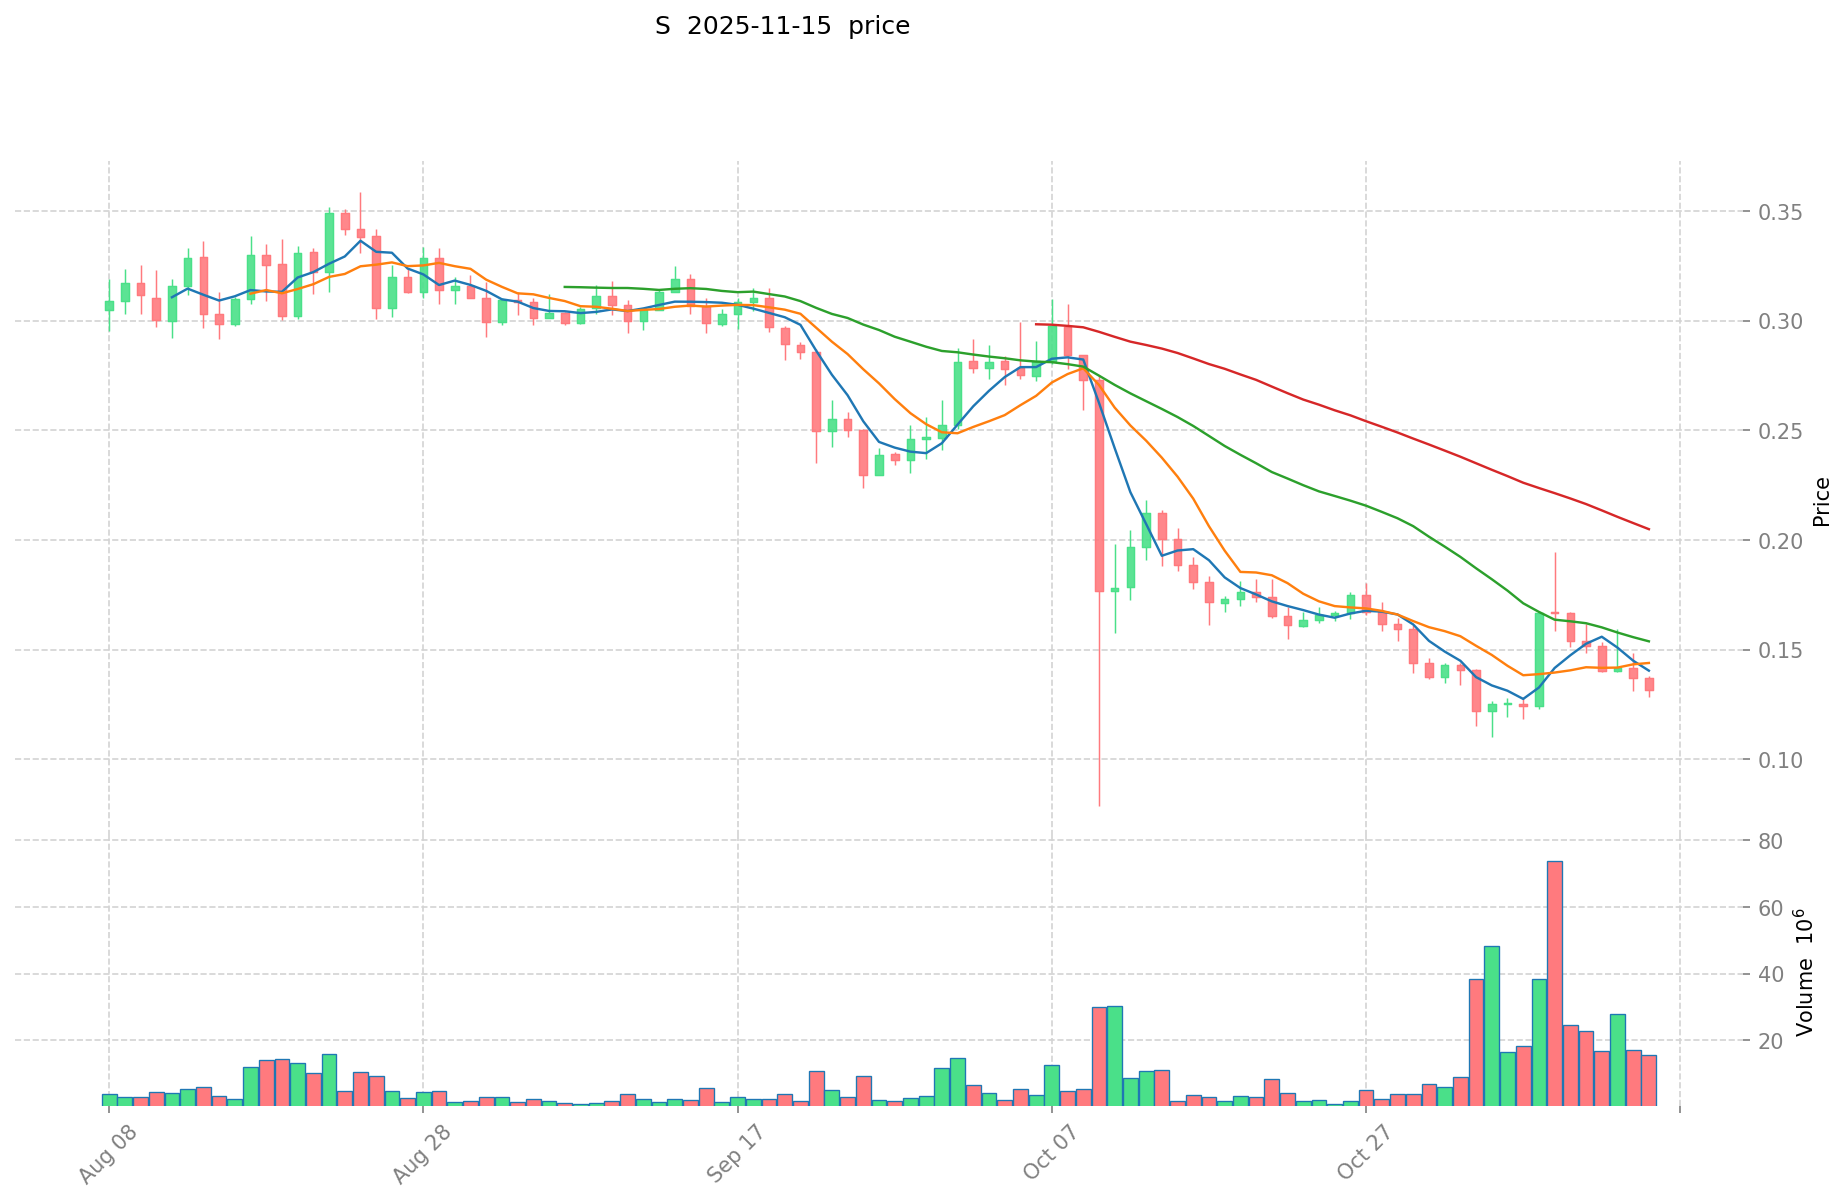
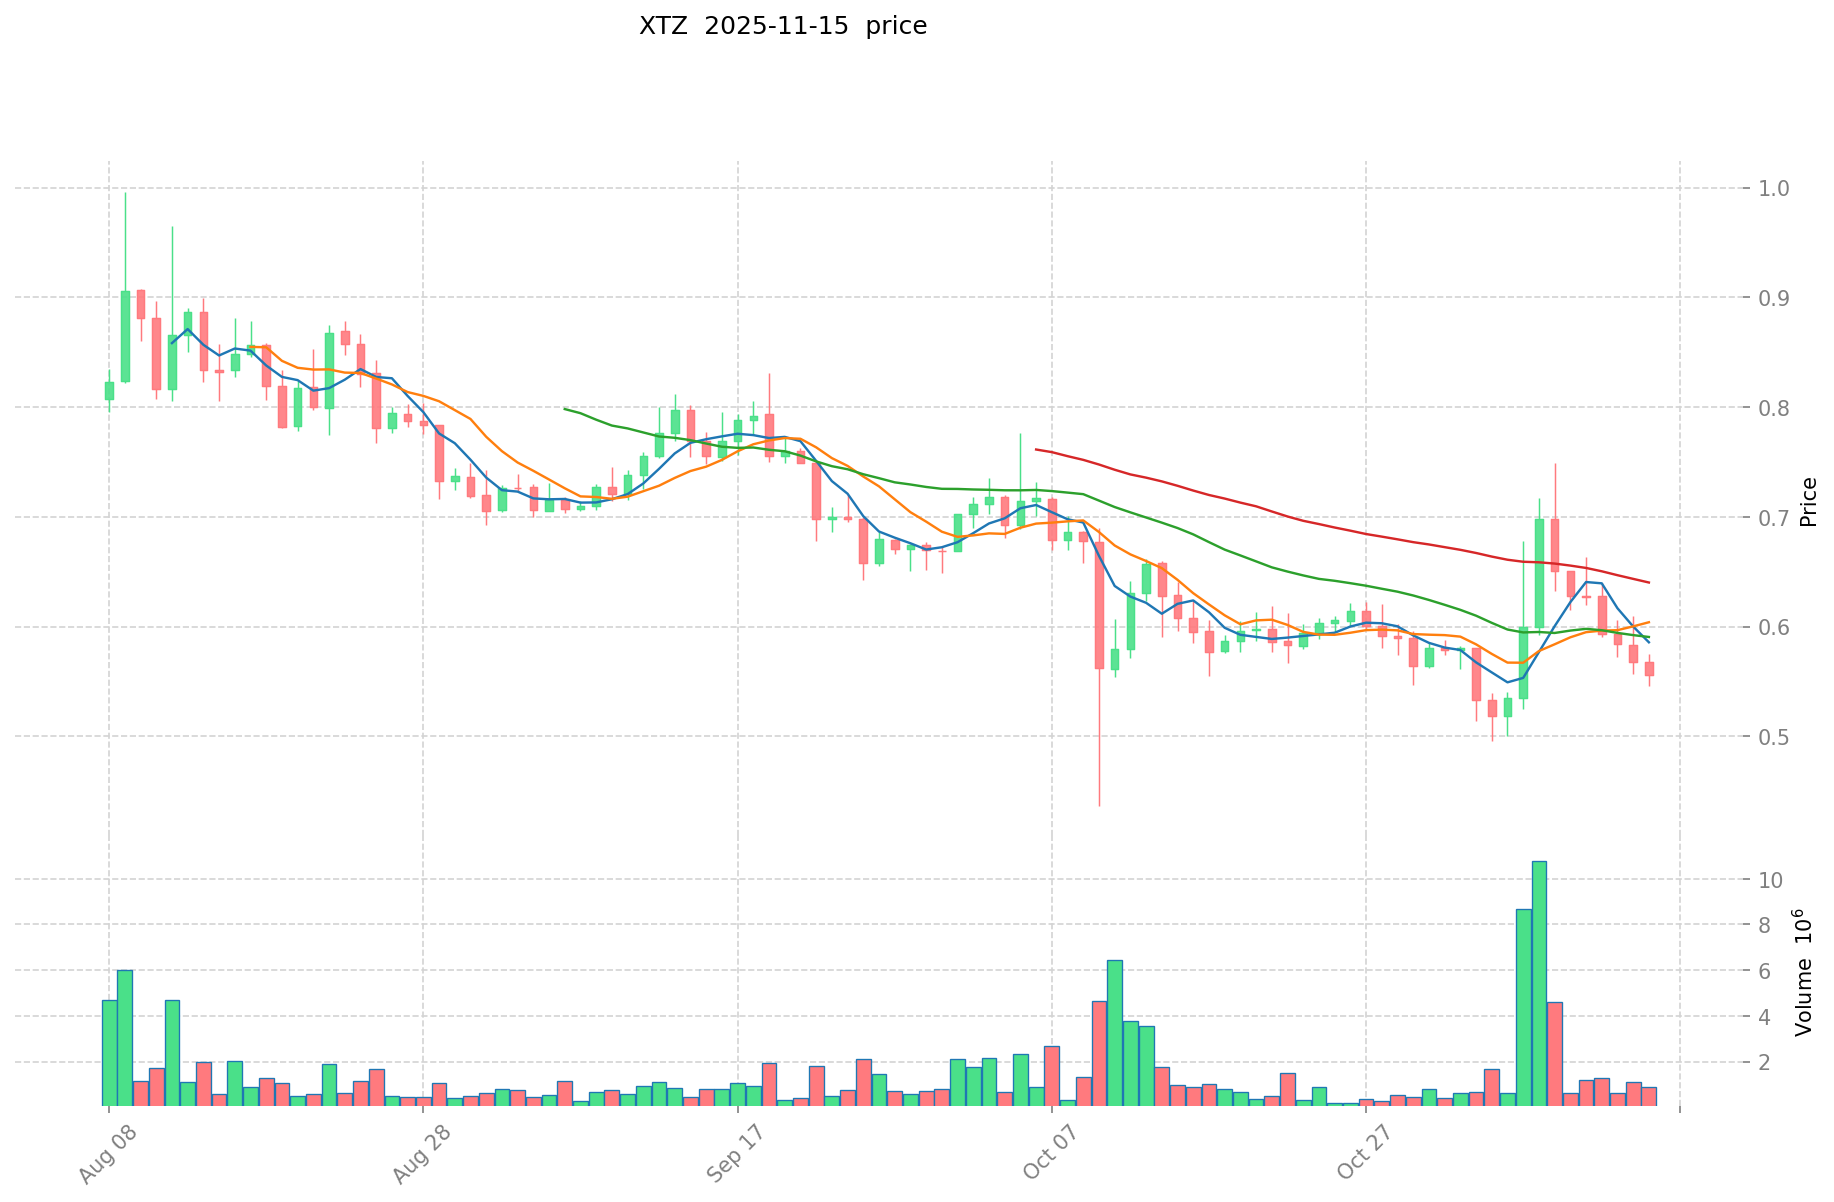
S (Sonic) and XTZ (Tezos) Historical Price Trends
- 2025: S reached its all-time high of $1.0293 on January 5, 2025, and later dropped to its all-time low of $0.0889 on October 11, 2025.
- 2021: XTZ hit its all-time high of $9.12 on October 4, 2021, while its all-time low of $0.350476 was recorded on December 7, 2018.
- Comparative analysis: In the current market cycle, S has experienced significant volatility, ranging from $1.0293 to $0.0889, while XTZ has shown a more stable long-term trend, maintaining a price above its historical low.
Current Market Situation (2025-11-15)
- S current price: $0.13215
- XTZ current price: $0.5671
- 24-hour trading volume: S $1,556,880.31 vs XTZ $324,821.67
- Market Sentiment Index (Fear & Greed Index): 10 (Extreme Fear)
Click to view real-time prices:
- Check S current price Market Price
- Check XTZ current price Market Price
II. Core Factors Affecting Investment Value of S vs XTZ
Supply Mechanisms Comparison (Tokenomics)
- Solana (SOL): Inflationary model with annual inflation rate starting at 8% and decreasing by 15% each year until reaching 1.5% long-term
- Tezos (XTZ): Inflationary model with baking rewards around 5-6% annually, subject to community governance
- 📌 Historical pattern: Solana's higher initial inflation has created selling pressure, while Tezos' more stable inflation rate has provided predictable staking returns
Institutional Adoption and Market Applications
- Institutional holdings: Solana has attracted more institutional interest, with significant investments from Andreessen Horowitz, Polychain Capital, and Alameda Research
- Enterprise adoption: Solana has gained traction in payments and DeFi with Visa piloting USDC settlements, while Tezos has focused on enterprise blockchain solutions with partners like BTG Pactual
- Regulatory attitudes: Both face similar regulatory scrutiny in most jurisdictions, with neither being explicitly classified as securities by major regulators
Technical Development and Ecosystem Building
- Solana technical upgrades: Focus on improving network reliability and throughput following outages, with validator improvements and fee markets implementation
- Tezos technical development: Continued focus on formal verification and self-amendment protocol with regular upgrades (Oxford, Lima, Mumbai) to improve performance
- Ecosystem comparison: Solana leads in DeFi TVL ($1.7B vs $64M), NFT marketplace activity, and gaming applications, while Tezos has strengths in institutional blockchain solutions and digital art marketplaces
Macroeconomic Factors and Market Cycles
- Performance during inflation: Both have struggled during inflationary periods, though Solana has shown higher volatility and stronger rebounds in recovery phases
- Macro monetary policy: Both are significantly influenced by interest rates and USD strength, with rising rates historically correlating with price pressure
- Geopolitical factors: Solana's higher transaction capacity may benefit more from increased cross-border payment demand, while Tezos' focus on compliance and governance may appeal in regulated markets
III. 2025-2030 Price Prediction: S vs XTZ
Short-term Prediction (2025)
- S: Conservative $0.0713 - $0.1321 | Optimistic $0.1321 - $0.1744
- XTZ: Conservative $0.5447 - $0.5674 | Optimistic $0.5674 - $0.8284
Mid-term Prediction (2027)
- S may enter a growth phase, with estimated prices $0.0974 - $0.2034
- XTZ may enter a volatile phase, with estimated prices $0.3995 - $1.0653
- Key drivers: Institutional capital inflow, ETF, ecosystem development
Long-term Prediction (2030)
- S: Base scenario $0.1349 - $0.2594 | Optimistic scenario $0.2594 - $0.2879
- XTZ: Base scenario $0.7951 - $1.3034 | Optimistic scenario $1.3034 - $1.6814
Disclaimer: The above predictions are based on historical data and market analysis. Cryptocurrency markets are highly volatile and subject to rapid changes. This information should not be considered as financial advice. Always conduct your own research before making investment decisions.
S:
| 年份 | 预测最高价 | 预测平均价格 | 预测最低价 | 涨跌幅 |
|---|---|---|---|---|
| 2025 | 0.1744116 | 0.13213 | 0.0713502 | 0 |
| 2026 | 0.188523084 | 0.1532708 | 0.125682056 | 15 |
| 2027 | 0.20336736098 | 0.170896942 | 0.09741125694 | 29 |
| 2028 | 0.261985012086 | 0.18713215149 | 0.1253785414983 | 41 |
| 2029 | 0.29417174214228 | 0.224558581788 | 0.21557623851648 | 69 |
| 2030 | 0.287895329781305 | 0.25936516196514 | 0.134869884221872 | 96 |
XTZ:
| 年份 | 预测最高价 | 预测平均价格 | 预测最低价 | 涨跌幅 |
|---|---|---|---|---|
| 2025 | 0.828404 | 0.5674 | 0.544704 | 0 |
| 2026 | 0.78165024 | 0.697902 | 0.42572022 | 23 |
| 2027 | 1.0652776128 | 0.73977612 | 0.3994791048 | 30 |
| 2028 | 1.191335463648 | 0.9025268664 | 0.785198373768 | 59 |
| 2029 | 1.55992743588576 | 1.046931165024 | 0.7328518155168 | 84 |
| 2030 | 1.681423797586795 | 1.30342930045488 | 0.795091873277476 | 129 |
IV. Investment Strategy Comparison: S vs XTZ
Long-term vs Short-term Investment Strategies
- S: Suitable for investors focused on DeFi potential and ecosystem growth
- XTZ: Suitable for investors seeking stability and formal verification advantages
Risk Management and Asset Allocation
- Conservative investors: S: 30% vs XTZ: 70%
- Aggressive investors: S: 60% vs XTZ: 40%
- Hedging tools: Stablecoin allocation, options, cross-currency portfolios
V. Potential Risk Comparison
Market Risk
- S: Higher volatility and susceptibility to market sentiment
- XTZ: Lower liquidity and trading volume
Technical Risk
- S: Scalability issues, network stability concerns
- XTZ: Slower adoption rate, potential security vulnerabilities
Regulatory Risk
- Global regulatory policies may impact both, with S potentially facing more scrutiny due to its DeFi focus
VI. Conclusion: Which Is the Better Buy?
📌 Investment Value Summary:
- S advantages: Strong DeFi ecosystem, high transaction throughput, institutional interest
- XTZ advantages: Self-amending protocol, focus on formal verification, stability
✅ Investment Advice:
- New investors: Consider a balanced approach, leaning towards XTZ for its stability
- Experienced investors: Explore S for higher potential returns, while maintaining XTZ for diversification
- Institutional investors: Evaluate both based on specific use cases and long-term ecosystem potential
⚠️ Risk Warning: Cryptocurrency markets are highly volatile. This article does not constitute investment advice. None
VII. FAQ
Q1: What are the key differences between Sonic (S) and Tezos (XTZ)? A: Sonic is an EVM L1 platform focused on DeFi with attractive incentives, while Tezos is a self-evolving crypto ledger known for its formal verification capabilities. Sonic has experienced higher volatility, while Tezos has shown more price stability over time.
Q2: How do the supply mechanisms of S and XTZ compare? A: Sonic's supply mechanism is not explicitly mentioned in the given context. Tezos has an inflationary model with baking rewards around 5-6% annually, subject to community governance.
Q3: Which cryptocurrency has attracted more institutional interest? A: Based on the information provided, Solana has attracted more institutional interest, with significant investments from Andreessen Horowitz, Polychain Capital, and Alameda Research. The context doesn't provide specific information about Sonic's institutional adoption.
Q4: How do S and XTZ compare in terms of ecosystem development? A: The context doesn't provide specific information about Sonic's ecosystem. For Tezos, it has strengths in institutional blockchain solutions and digital art marketplaces, but lags behind Solana in DeFi TVL, NFT marketplace activity, and gaming applications.
Q5: What are the price predictions for S and XTZ by 2030? A: For S, the base scenario predicts $0.1349 - $0.2594, with an optimistic scenario of $0.2594 - $0.2879. For XTZ, the base scenario predicts $0.7951 - $1.3034, with an optimistic scenario of $1.3034 - $1.6814.
Q6: What are the main risks associated with investing in S and XTZ? A: For S, the main risks include higher volatility, susceptibility to market sentiment, scalability issues, and network stability concerns. For XTZ, risks include lower liquidity, trading volume, slower adoption rate, and potential security vulnerabilities. Both face regulatory risks.
Q7: Which cryptocurrency is recommended for new investors? A: The article suggests that new investors consider a balanced approach, leaning towards XTZ for its stability. However, it's important to note that all cryptocurrency investments carry high risk and should be approached with caution.
Share
Content
Introduction: Investment Comparison of S vs XTZ
I. Price History Comparison and Current Market Status
II. Core Factors Affecting Investment Value of S vs XTZ
III. 2025-2030 Price Prediction: S vs XTZ
IV. Investment Strategy Comparison: S vs XTZ
V. Potential Risk Comparison
VI. Conclusion: Which Is the Better Buy?
VII. FAQ

