VENOM vs SOL: The Battle for Blockchain Supremacy in Decentralized Finance
Introduction: Investment Comparison of VENOM vs SOL
In the cryptocurrency market, VENOM vs SOL comparison has always been an unavoidable topic for investors. The two not only differ significantly in market cap ranking, application scenarios, and price performance, but also represent different positioning in crypto assets.
Venom (VENOM): Since its launch, it has gained market recognition for its scalability and efficiency as a Layer 0 asynchronous blockchain with dynamic sharding.
Solana (SOL): Since its inception in late 2017, it has been hailed as a high-performance blockchain protocol, becoming one of the cryptocurrencies with the highest global trading volume and market capitalization.
This article will comprehensively analyze the investment value comparison between VENOM and SOL, focusing on historical price trends, supply mechanisms, institutional adoption, technological ecosystems, and future predictions, attempting to answer the question most concerning to investors:
"Which is the better buy right now?"
I. Price History Comparison and Current Market Status
VENOM (Coin A) and SOL (Coin B) Historical Price Trends
- 2024: VENOM reached its all-time high of $499 on March 25, 2024, showing significant price appreciation.
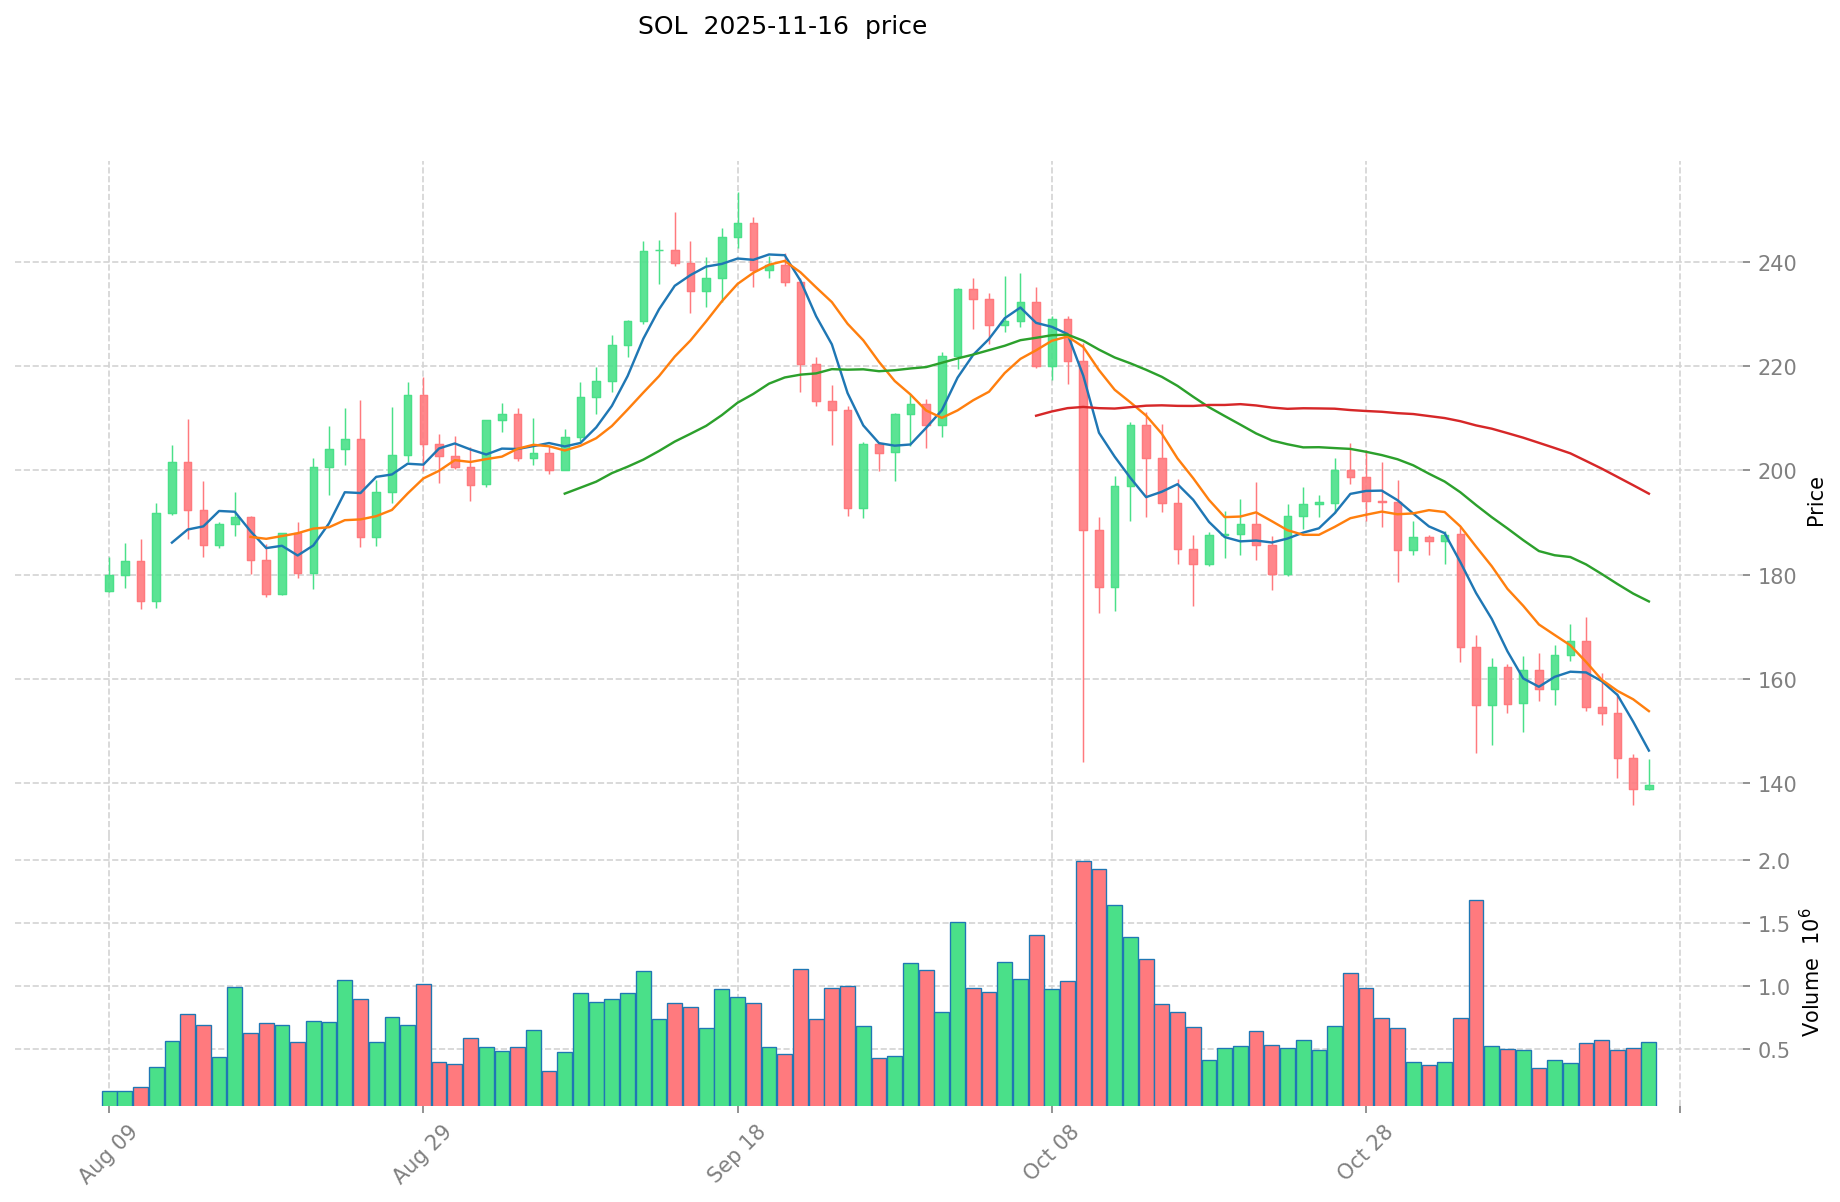
- 2025: SOL hit its all-time high of $293.31 on January 19, 2025, demonstrating strong market performance.
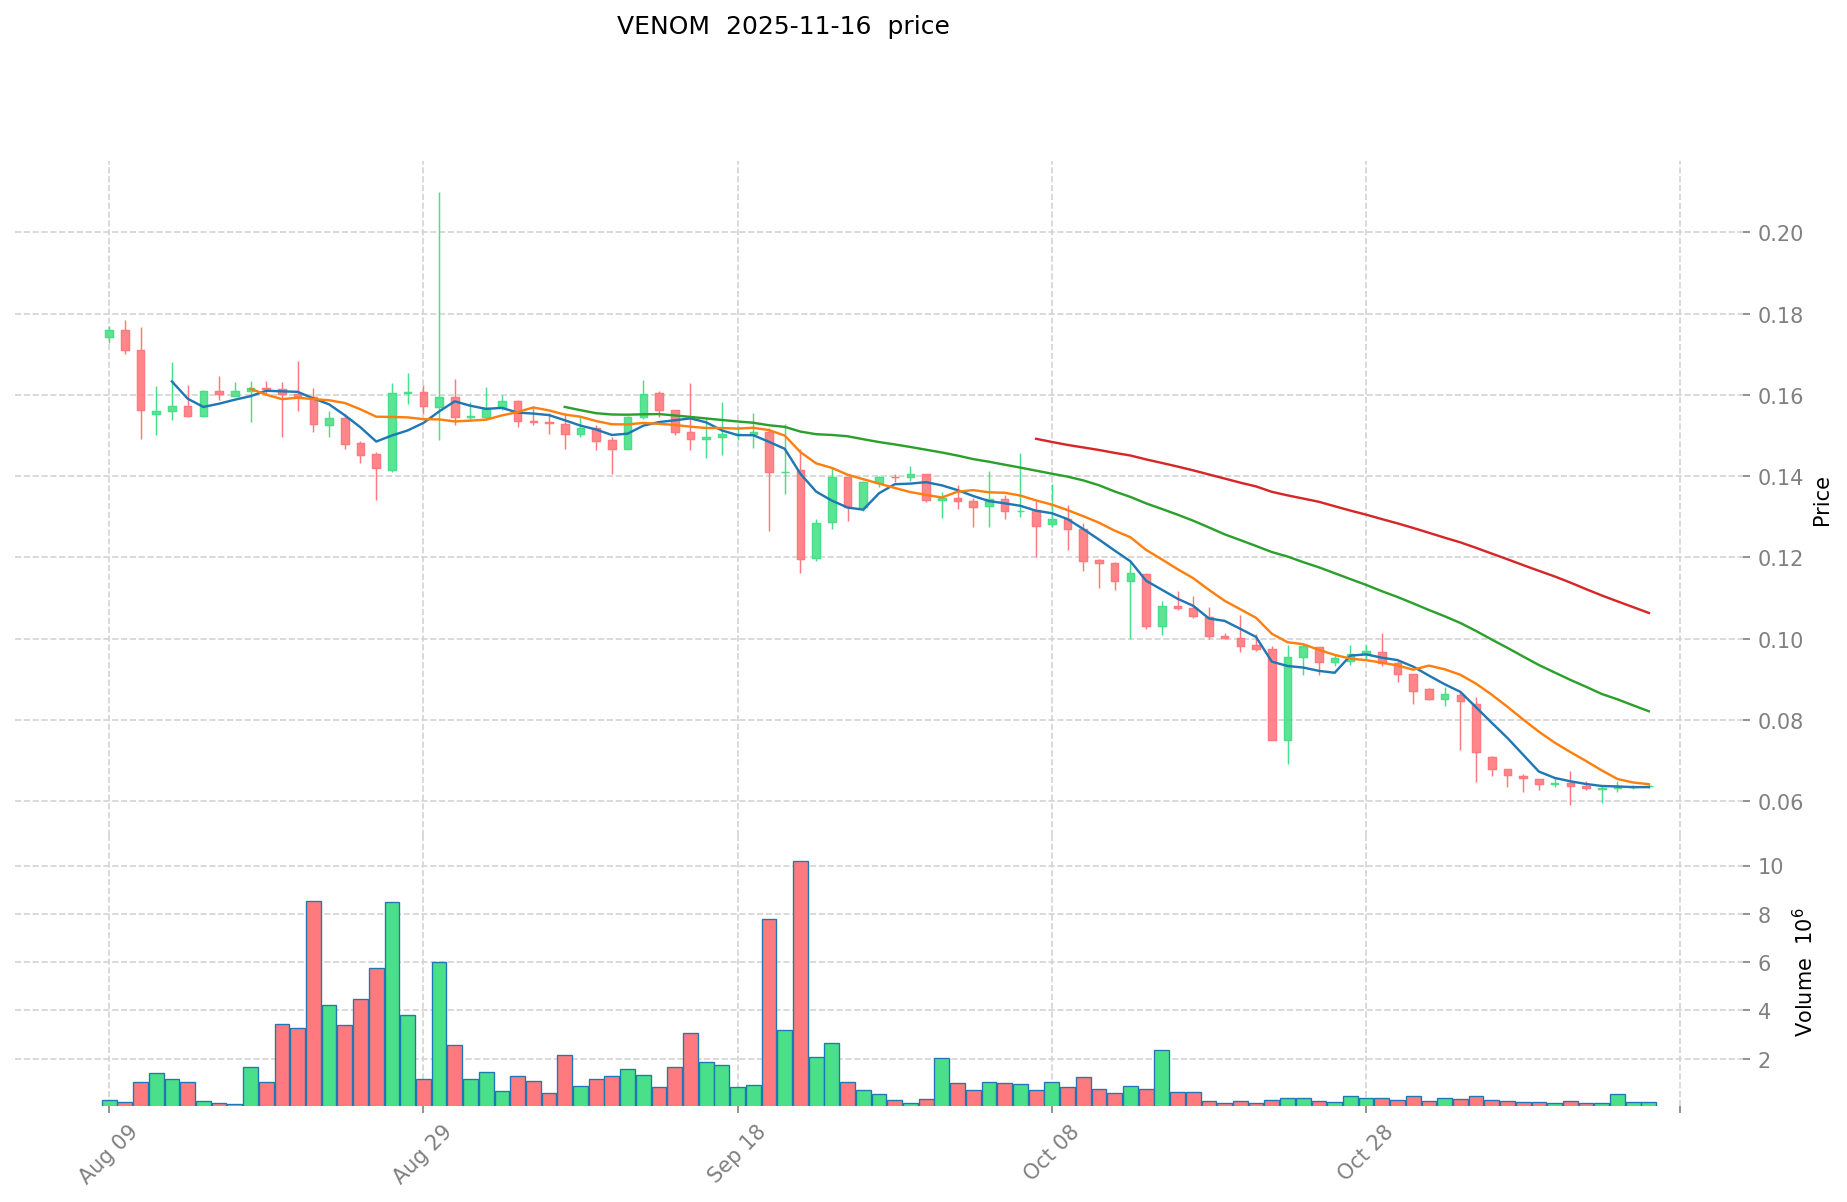
- Comparative analysis: In recent market cycles, VENOM dropped from its high of $499 to a low of $0.03457 on February 3, 2025, while SOL has shown more stability, currently trading at $141.61.
Current Market Situation (2025-11-16)
- VENOM current price: $0.06364
- SOL current price: $141.61
- 24-hour trading volume: VENOM $13,068.89 vs SOL $74,758,692.52
- Market Sentiment Index (Fear & Greed Index): 10 (Extreme Fear)
Click to view real-time prices:
- Check VENOM current price Market Price
- Check SOL current price Market Price
II. Core Factors Affecting Investment Value of VENOM vs SOL
Supply Mechanism Comparison (Tokenomics)
- VENOM: Maximum supply cap of 13.7 billion tokens with a deflationary mechanism
- SOL: Inflationary model with variable inflation rate, currently approximately 8% annually, declining over time to eventually reach 1.5%
- 📌 Historical Pattern: Deflationary models like VENOM's tend to create price pressure over time, while SOL's inflation schedule impacts token value based on adoption rate relative to new supply.
Institutional Adoption and Market Applications
- Institutional Holdings: SOL has stronger institutional backing with investments from Alameda Research, Multicoin Capital, and various crypto funds
- Enterprise Adoption: SOL has more established enterprise applications in DeFi and NFT marketplaces, while VENOM is still in early development stages
- National Policies: SOL faces greater regulatory scrutiny in the US due to its higher profile, while VENOM has less regulatory exposure but also less regulatory clarity
Technical Development and Ecosystem Building
- VENOM Technical Upgrades: Implements DAG (Directed Acyclic Graph) technology with Dynamic Sharding for high throughput
- SOL Technical Development: Proof-of-History consensus mechanism with high TPS (Transactions Per Second) and low fees
- Ecosystem Comparison: SOL has a mature ecosystem with established DeFi protocols, NFT marketplaces, and developer tools, while VENOM is building its ecosystem with focus on enterprise applications and cross-chain capabilities
Macroeconomic and Market Cycles
- Performance in Inflationary Environments: Both assets lack sufficient historical data for definitive inflation-resistance comparisons
- Macroeconomic Monetary Policy: Both are affected by risk-on/risk-off sentiment shifts related to interest rate changes
- Geopolitical Factors: SOL has wider global distribution and liquidity, while VENOM may benefit from geographic diversification in crypto markets
III. Price Prediction 2025-2030: VENOM vs SOL
Short-term Prediction (2025)
- VENOM: Conservative $0.0376 - $0.0638 | Optimistic $0.0638 - $0.0772
- SOL: Conservative $103.57 - $141.87 | Optimistic $141.87 - $207.13
Mid-term Prediction (2027)
- VENOM may enter a growth phase, with estimated prices $0.0586 - $0.1265
- SOL may enter a consolidation phase, with estimated prices $119.83 - $243.46
- Key drivers: Institutional capital inflow, ETF, ecosystem development
Long-term Prediction (2030)
- VENOM: Base scenario $0.1223 - $0.1343 | Optimistic scenario $0.1343 - $0.1558
- SOL: Base scenario $241.85 - $268.72 | Optimistic scenario $268.72 - $349.34
Disclaimer: The above predictions are based on historical data and current market trends. Cryptocurrency markets are highly volatile and subject to rapid changes. These forecasts should not be considered as financial advice. Always conduct your own research before making investment decisions.
VENOM:
| 年份 | 预测最高价 | 预测平均价格 | 预测最低价 | 涨跌幅 |
|---|---|---|---|---|
| 2025 | 0.0771738 | 0.06378 | 0.0376302 | 0 |
| 2026 | 0.099372429 | 0.0704769 | 0.05638152 | 10 |
| 2027 | 0.126537750105 | 0.0849246645 | 0.058598018505 | 33 |
| 2028 | 0.138507881566275 | 0.1057312073025 | 0.0972727107183 | 66 |
| 2029 | 0.146543453321265 | 0.122119544434387 | 0.118455958101355 | 91 |
| 2030 | 0.155824538698278 | 0.134331498877826 | 0.122241663978821 | 111 |
SOL:
| 年份 | 预测最高价 | 预测平均价格 | 预测最低价 | 涨跌幅 |
|---|---|---|---|---|
| 2025 | 207.1302 | 141.87 | 103.5651 | 0 |
| 2026 | 205.910118 | 174.5001 | 141.345081 | 23 |
| 2027 | 243.46253952 | 190.205109 | 119.82921867 | 34 |
| 2028 | 310.0723686918 | 216.83382426 | 158.2886917098 | 53 |
| 2029 | 273.991220334936 | 263.4530964759 | 231.838724898792 | 86 |
| 2030 | 349.3388059270434 | 268.722158405418 | 241.8499425648762 | 89 |
IV. Investment Strategy Comparison: VENOM vs SOL
Long-term vs Short-term Investment Strategy
- VENOM: Suitable for investors focused on emerging Layer 0 technologies and cross-chain potential
- SOL: Suitable for investors seeking established ecosystems and DeFi/NFT exposure
Risk Management and Asset Allocation
- Conservative investors: VENOM: 10% vs SOL: 90%
- Aggressive investors: VENOM: 30% vs SOL: 70%
- Hedging tools: Stablecoin allocation, options, cross-currency combinations
V. Potential Risk Comparison
Market Risk
- VENOM: Higher volatility due to lower market cap and liquidity
- SOL: Vulnerability to broader crypto market trends and sentiment shifts
Technical Risk
- VENOM: Scalability, network stability, and adoption of Dynamic Sharding technology
- SOL: Network congestion issues, potential security vulnerabilities
Regulatory Risk
- Global regulatory policies may impact both, with SOL potentially facing more scrutiny due to its higher profile and wider adoption
VI. Conclusion: Which Is the Better Buy?
📌 Investment Value Summary:
- VENOM advantages: Innovative Layer 0 technology, potential for high growth, lower market cap
- SOL advantages: Established ecosystem, strong institutional backing, proven track record in DeFi and NFTs
✅ Investment Advice:
- Novice investors: Consider a small allocation to SOL as part of a diversified crypto portfolio
- Experienced investors: Explore a balanced mix of VENOM and SOL, adjusting based on risk tolerance
- Institutional investors: Conduct thorough due diligence on both, with potentially higher allocation to SOL due to its established market position
⚠️ Risk Warning: The cryptocurrency market is highly volatile, and this article does not constitute investment advice. None
VII. FAQ
Q1: What are the main differences between VENOM and SOL? A: VENOM is a Layer 0 blockchain with dynamic sharding, while SOL is a high-performance blockchain protocol. VENOM has a maximum supply cap of 13.7 billion tokens with a deflationary mechanism, whereas SOL has an inflationary model. SOL has a more established ecosystem and stronger institutional backing, while VENOM is still in early development stages.
Q2: Which cryptocurrency has performed better historically? A: SOL has shown more stability in recent market cycles. While VENOM reached an all-time high of $499 in March 2024, it subsequently dropped to a low of $0.03457 in February 2025. SOL hit its all-time high of $293.31 in January 2025 and is currently trading at $141.61, demonstrating stronger market performance.
Q3: What are the key factors affecting the investment value of VENOM and SOL? A: Key factors include supply mechanisms, institutional adoption, market applications, technical development, ecosystem building, macroeconomic conditions, and market cycles. SOL has advantages in institutional backing and ecosystem maturity, while VENOM offers potential in innovative Layer 0 technology.
Q4: How do the price predictions for VENOM and SOL compare for 2030? A: For 2030, VENOM's base scenario predicts a range of $0.1223 - $0.1343, with an optimistic scenario of $0.1343 - $0.1558. SOL's base scenario for 2030 is $241.85 - $268.72, with an optimistic scenario of $268.72 - $349.34.
Q5: What are the main risks associated with investing in VENOM and SOL? A: VENOM faces higher volatility due to lower market cap and liquidity, as well as risks related to scalability and adoption of its technology. SOL is vulnerable to broader crypto market trends and has experienced network congestion issues. Both face regulatory risks, with SOL potentially facing more scrutiny due to its higher profile.
Q6: How should different types of investors approach VENOM and SOL? A: Novice investors might consider a small allocation to SOL as part of a diversified crypto portfolio. Experienced investors could explore a balanced mix of VENOM and SOL, adjusting based on risk tolerance. Institutional investors should conduct thorough due diligence on both, potentially allocating more to SOL due to its established market position.
Q7: What are the current market prices and trading volumes for VENOM and SOL? A: As of 2025-11-16, VENOM's current price is $0.06364 with a 24-hour trading volume of $13,068.89. SOL's current price is $141.61 with a 24-hour trading volume of $74,758,692.52.
Share
Content
Introduction: Investment Comparison of VENOM vs SOL
I. Price History Comparison and Current Market Status
II. Core Factors Affecting Investment Value of VENOM vs SOL
III. Price Prediction 2025-2030: VENOM vs SOL
IV. Investment Strategy Comparison: VENOM vs SOL
V. Potential Risk Comparison
VI. Conclusion: Which Is the Better Buy?
VII. FAQ

