WAL vs DOT: Comparing Writeahead Logging and Database Optimization Techniques
Introduction: Investment Comparison between WAL and DOT
In the cryptocurrency market, the comparison between Walrus (WAL) vs Polkadot (DOT) has been an unavoidable topic for investors. The two not only show significant differences in market cap ranking, application scenarios, and price performance, but also represent different crypto asset positioning.
Walrus (WAL): Since its launch, it has gained market recognition for its decentralized data storage capabilities.
Polkadot (DOT): Introduced in 2020, it has been hailed as an interoperability protocol, aiming to connect different blockchain networks.
This article will provide a comprehensive analysis of the investment value comparison between WAL and DOT, focusing on historical price trends, supply mechanisms, institutional adoption, technological ecosystems, and future predictions, attempting to answer the question investors care about most:
"Which is the better buy right now?"
I. Price History Comparison and Current Market Status
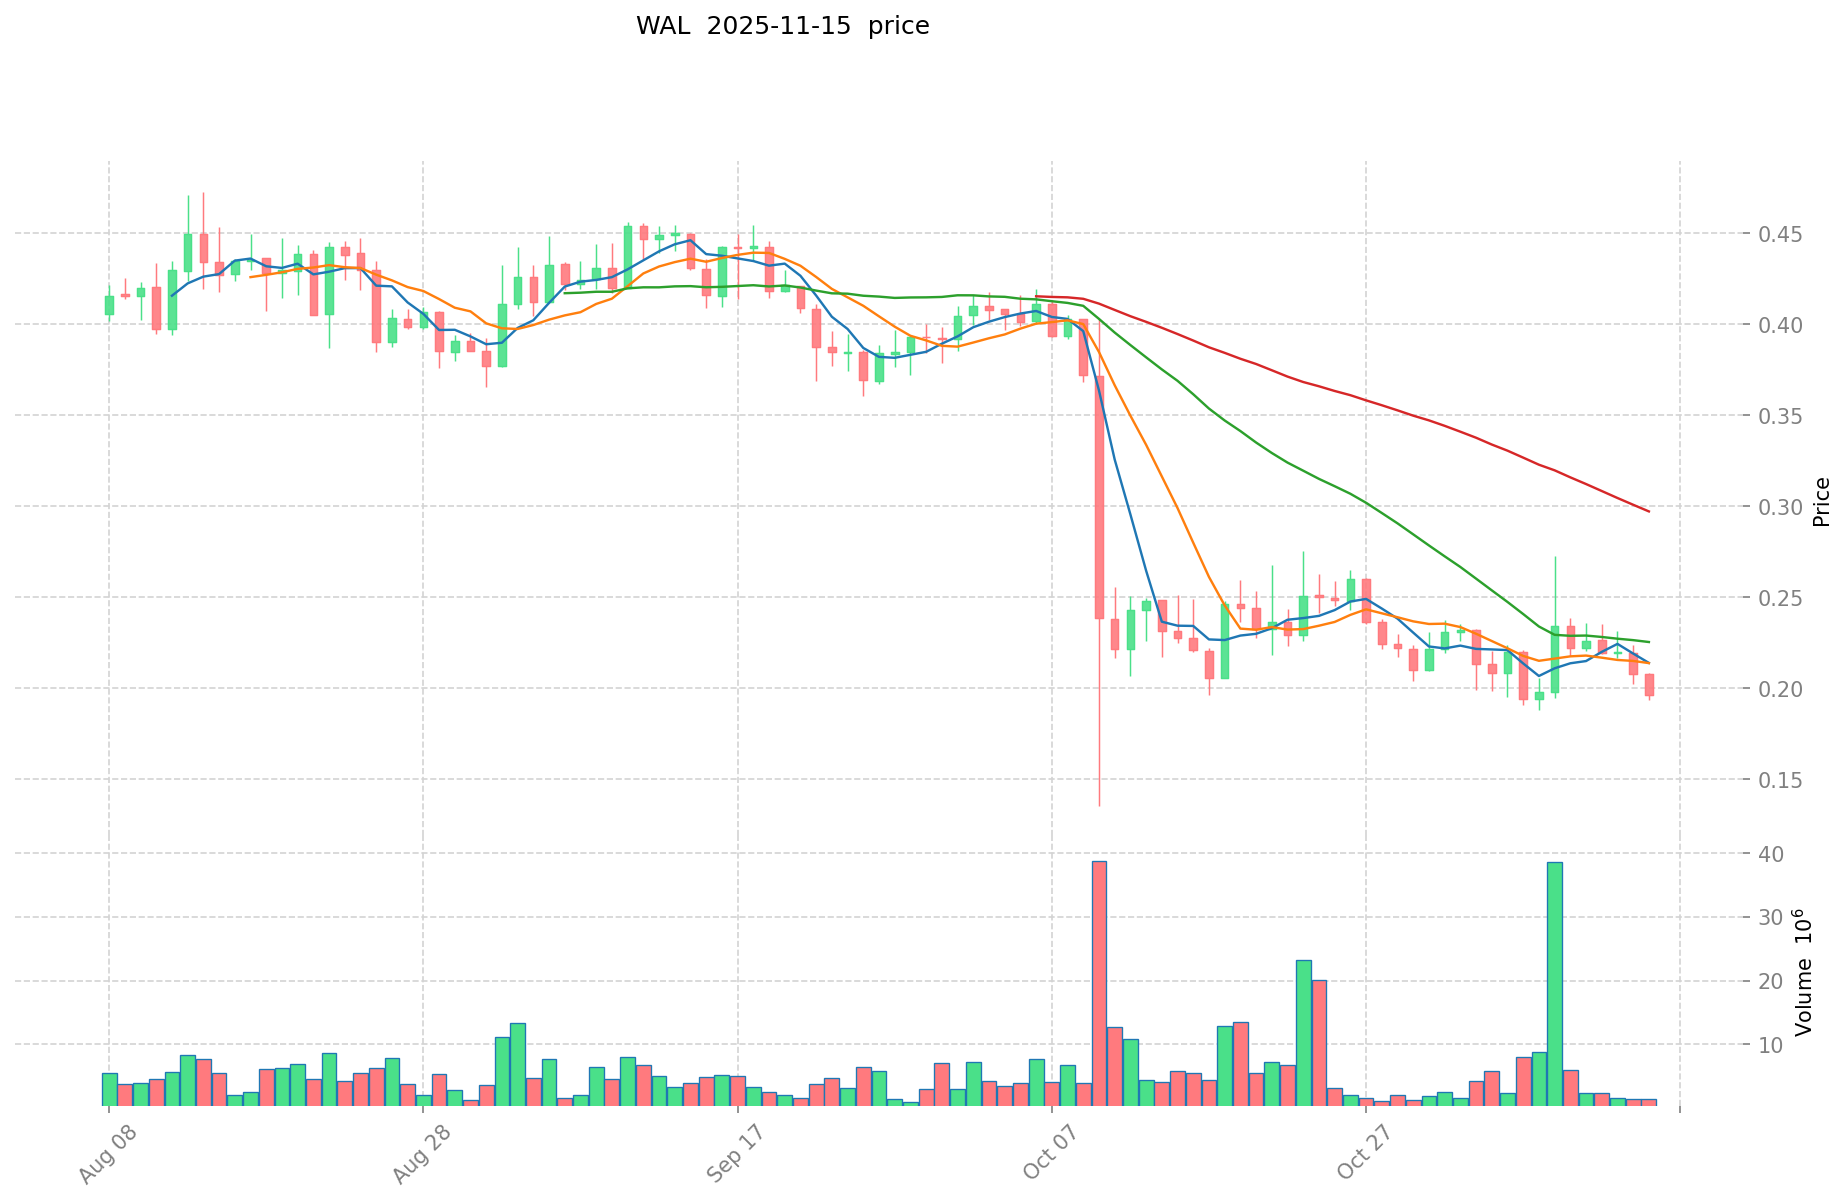
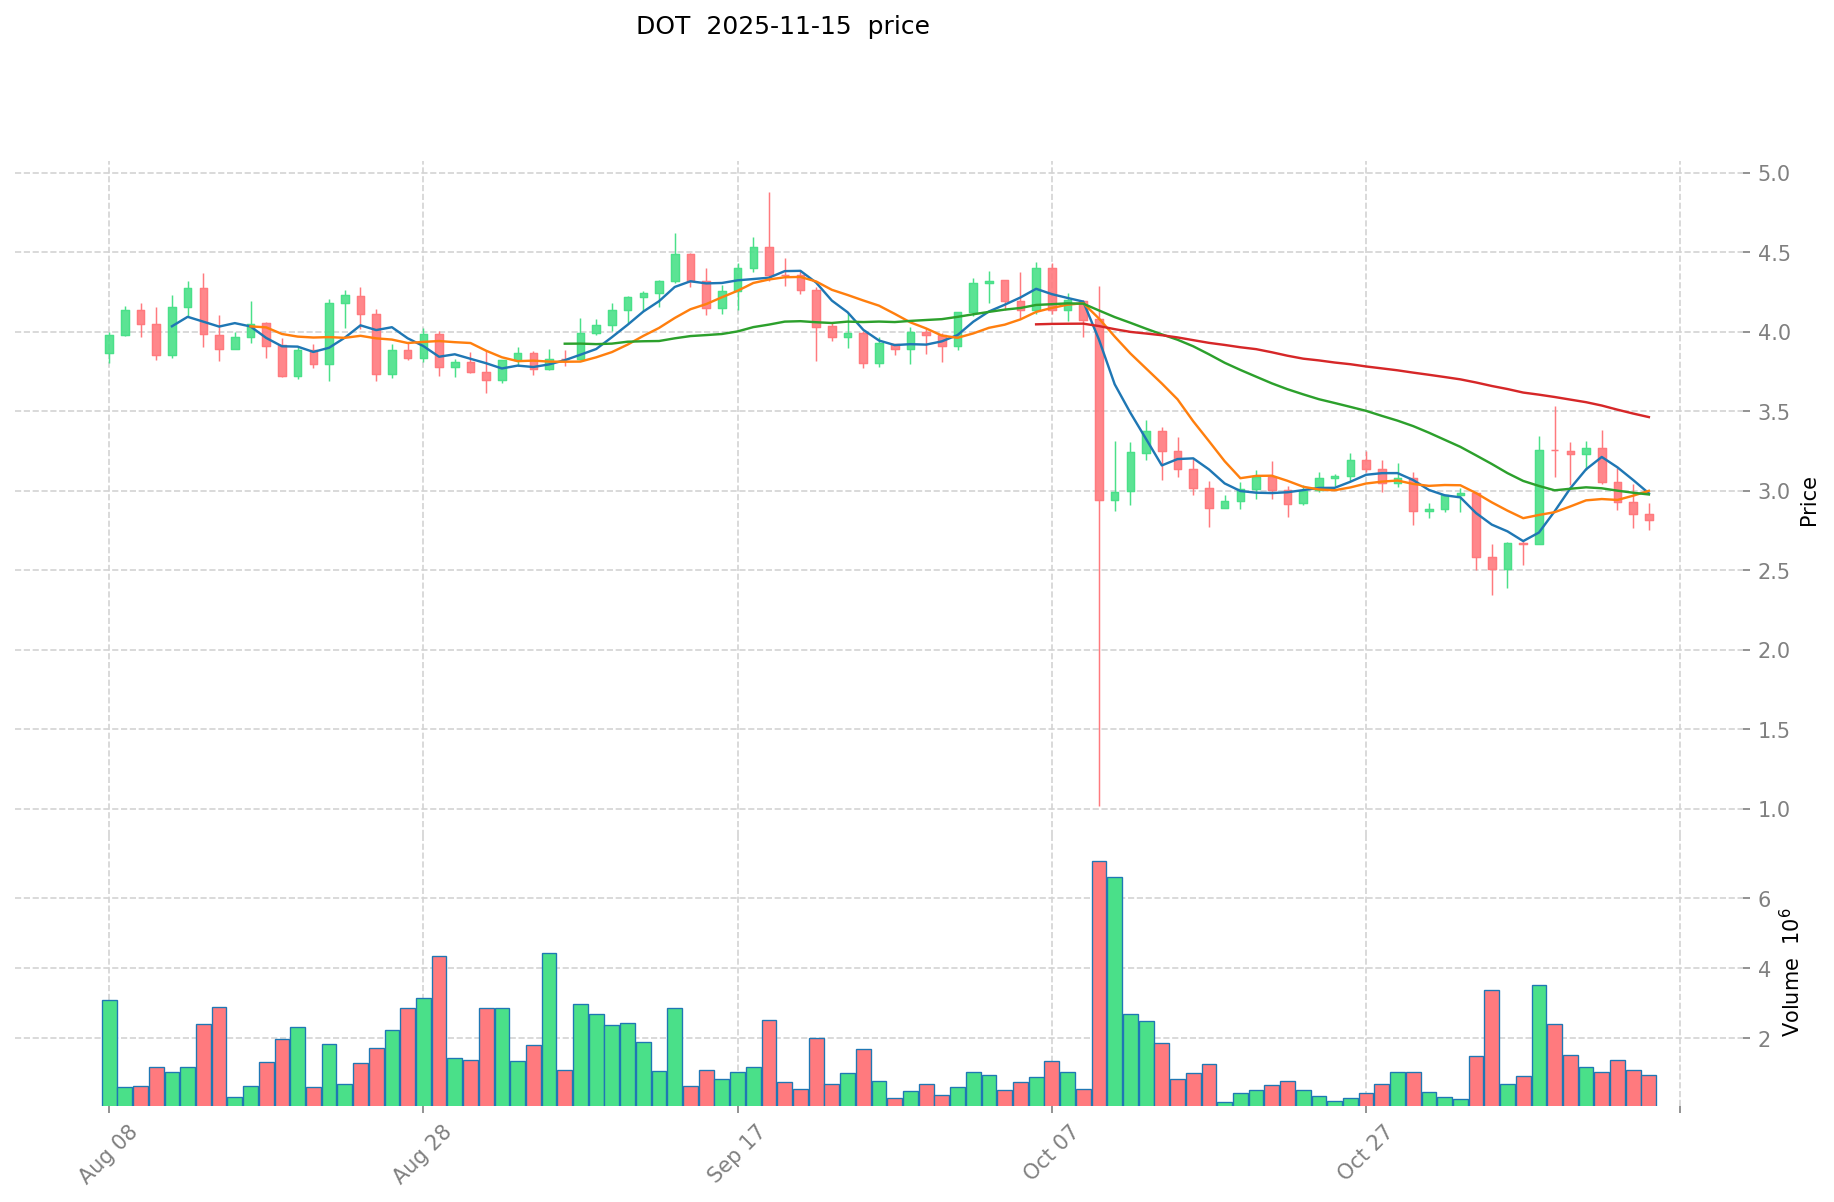
WAL and DOT Historical Price Trends
- 2025: WAL reached its all-time high of $0.9719 on March 27, but later dropped to its all-time low of $0.1357 on October 10.
- 2021: DOT hit its all-time high of $54.98 on November 4, showing significant growth in the bull market.
- Comparative analysis: In the recent market cycle, WAL experienced a dramatic drop from $0.9719 to $0.1357, while DOT has fallen from its peak of $54.98 to current levels, demonstrating the volatility in the crypto market.
Current Market Situation (2025-11-15)
- WAL current price: $0.203
- DOT current price: $2.87
- 24-hour trading volume: WAL $306,602.90 vs DOT $1,676,479.76
- Market Sentiment Index (Fear & Greed Index): 10 (Extreme Fear)
Click to view real-time prices:
- Check WAL current price Market Price
- Check DOT current price Market Price
II. Core Factors Affecting WAL vs DOT Investment Value
Supply Mechanism Comparison (Tokenomics)
- WAL: Limited total supply of 5 billion tokens, with a 2% annual staking reward for validators
- DOT: Inflationary model with no maximum cap, targeting 10% annual inflation with rewards distributed to stakers
- 📌 Historical pattern: Fixed supply assets like WAL tend to create scarcity-based value propositions, while DOT's inflation model prioritizes network security through staking incentives.
Institutional Adoption and Market Applications
- Institutional holdings: DOT appears to have stronger institutional backing with 63% of tokens staked across validators
- Enterprise adoption: WAL focuses on wallet security and secure storage solutions, while DOT offers parachain infrastructure for enterprise blockchain development
- Regulatory attitudes: Both projects face similar regulatory challenges, though DOT's longer market presence may provide regulatory clarity advantages
Technical Development and Ecosystem Building
- WAL technical upgrades: Quantum-resistant cryptography implementation and development of off-chain computation solutions
- DOT technical development: Parachain auctions, cross-consensus messaging (XCM), and governance upgrades
- Ecosystem comparison: DOT has a more mature ecosystem with numerous parachains, DeFi protocols, and NFT projects, while WAL is still developing its core infrastructure
Macroeconomic Factors and Market Cycles
- Performance during inflation: DOT's staking rewards may offset inflation impacts, while WAL's fixed supply could theoretically provide stronger protection against fiat devaluation
- Monetary policy effects: Both assets have shown sensitivity to Federal Reserve policy changes and broader crypto market conditions
- Geopolitical factors: DOT's decentralized governance model potentially offers stronger resilience against regional regulatory challenges
III. Price Prediction for 2025-2030: WAL vs DOT
Short-term Prediction (2025)
- WAL: Conservative $0.1539 - $0.2025 | Optimistic $0.2025 - $0.253125
- DOT: Conservative $2.157 - $2.876 | Optimistic $2.876 - $3.7388
Mid-term Prediction (2027)
- WAL may enter a growth phase, with prices expected in the range of $0.192911625 - $0.377895375
- DOT may enter a consolidation phase, with prices expected in the range of $2.75241828 - $5.0702442
- Key drivers: Institutional capital inflow, ETF developments, ecosystem growth
Long-term Prediction (2030)
- WAL: Base scenario $0.39714253779375 - $0.508342448376 | Optimistic scenario $0.508342448376+
- DOT: Base scenario $4.83016813713 - $6.6656320292394 | Optimistic scenario $6.6656320292394+
Disclaimer: The above predictions are based on historical data and current market trends. Cryptocurrency markets are highly volatile and subject to rapid changes. These forecasts should not be considered as financial advice. Always conduct your own research before making investment decisions.
WAL:
| 年份 | 预测最高价 | 预测平均价格 | 预测最低价 | 涨跌幅 |
|---|---|---|---|---|
| 2025 | 0.253125 | 0.2025 | 0.1539 | 0 |
| 2026 | 0.3007125 | 0.2278125 | 0.1366875 | 12 |
| 2027 | 0.377895375 | 0.2642625 | 0.192911625 | 30 |
| 2028 | 0.375662356875 | 0.3210789375 | 0.163750258125 | 58 |
| 2029 | 0.4459144284 | 0.3483706471875 | 0.240375746559375 | 71 |
| 2030 | 0.508342448376 | 0.39714253779375 | 0.329628306368812 | 95 |
DOT:
| 年份 | 预测最高价 | 预测平均价格 | 预测最低价 | 涨跌幅 |
|---|---|---|---|---|
| 2025 | 3.7388 | 2.876 | 2.157 | 0 |
| 2026 | 3.935806 | 3.3074 | 3.175104 | 15 |
| 2027 | 5.0702442 | 3.621603 | 2.75241828 | 26 |
| 2028 | 4.476301308 | 4.3459236 | 2.82485034 | 51 |
| 2029 | 5.24922382026 | 4.411112454 | 2.77900084602 | 53 |
| 2030 | 6.6656320292394 | 4.83016813713 | 3.1879109705058 | 68 |
IV. Investment Strategy Comparison: WAL vs DOT
Long-term vs Short-term Investment Strategies
- WAL: Suitable for investors focused on data storage solutions and emerging blockchain technologies
- DOT: Suitable for investors interested in interoperability and ecosystem development
Risk Management and Asset Allocation
- Conservative investors: WAL: 30% vs DOT: 70%
- Aggressive investors: WAL: 60% vs DOT: 40%
- Hedging tools: Stablecoin allocation, options, cross-currency portfolio
V. Potential Risk Comparison
Market Risks
- WAL: Higher volatility due to smaller market cap and less liquidity
- DOT: Susceptible to broader crypto market trends and competition from other interoperability solutions
Technical Risks
- WAL: Scalability, network stability
- DOT: Parachain auction dynamics, cross-chain security
Regulatory Risks
- Global regulatory policies may impact both, with DOT potentially facing more scrutiny due to its broader ecosystem
VI. Conclusion: Which Is the Better Buy?
📌 Investment Value Summary:
- WAL advantages: Fixed supply, focus on data storage solutions, potential for growth in emerging markets
- DOT advantages: Established ecosystem, interoperability features, strong institutional backing
✅ Investment Advice:
- New investors: Consider a balanced approach with a slight bias towards DOT due to its more established presence
- Experienced investors: Explore a strategic mix of both assets, leveraging WAL's growth potential and DOT's ecosystem strength
- Institutional investors: Focus on DOT for its mature infrastructure and consider WAL for diversification in data storage solutions
⚠️ Risk Warning: The cryptocurrency market is highly volatile. This article does not constitute investment advice. None
VII. FAQ
Q1: What are the main differences between WAL and DOT? A: WAL focuses on decentralized data storage with a fixed supply of 5 billion tokens, while DOT is an interoperability protocol with an inflationary model. WAL is newer and less established, whereas DOT has a more mature ecosystem with numerous parachains and DeFi projects.
Q2: Which cryptocurrency has performed better historically? A: DOT reached its all-time high of $54.98 in November 2021, showing significant growth during the bull market. WAL, being newer, reached its all-time high of $0.9719 in March 2025 but later experienced a dramatic drop to $0.1357 in October 2025.
Q3: How do the supply mechanisms of WAL and DOT differ? A: WAL has a limited total supply of 5 billion tokens with a 2% annual staking reward for validators. DOT has an inflationary model with no maximum cap, targeting 10% annual inflation with rewards distributed to stakers.
Q4: What are the key factors affecting the investment value of WAL and DOT? A: Key factors include supply mechanisms, institutional adoption, technical development, ecosystem building, macroeconomic factors, and market cycles. DOT generally has stronger institutional backing and a more developed ecosystem, while WAL offers potential in the data storage sector.
Q5: What are the price predictions for WAL and DOT in 2030? A: For WAL, the base scenario predicts a range of $0.39714253779375 - $0.508342448376, with an optimistic scenario above $0.508342448376. For DOT, the base scenario predicts a range of $4.83016813713 - $6.6656320292394, with an optimistic scenario above $6.6656320292394.
Q6: How should investors allocate their assets between WAL and DOT? A: Conservative investors might consider allocating 30% to WAL and 70% to DOT, while aggressive investors might allocate 60% to WAL and 40% to DOT. The exact allocation depends on individual risk tolerance and investment goals.
Q7: What are the main risks associated with investing in WAL and DOT? A: Both face market risks related to crypto volatility. WAL has higher volatility due to its smaller market cap and less liquidity. DOT faces competition from other interoperability solutions. Technical risks include scalability for WAL and cross-chain security for DOT. Both are subject to regulatory risks, with DOT potentially facing more scrutiny due to its broader ecosystem.
Share
Content
Introduction: Investment Comparison between WAL and DOT
I. Price History Comparison and Current Market Status
II. Core Factors Affecting WAL vs DOT Investment Value
III. Price Prediction for 2025-2030: WAL vs DOT
IV. Investment Strategy Comparison: WAL vs DOT
V. Potential Risk Comparison
VI. Conclusion: Which Is the Better Buy?
VII. FAQ

