XDC vs SOL: A Comparative Analysis of Blockchain Platforms for Enterprise Solutions
Introduction: XDC vs SOL Investment Comparison
In the cryptocurrency market, the comparison between XDC and SOL has always been an unavoidable topic for investors. The two not only show significant differences in market cap ranking, application scenarios, and price performance but also represent different positioning in crypto assets.
XDC Network (XDC): Since its launch in 2019, it has gained market recognition for its focus on global trade and finance digitization.
Solana (SOL): Introduced in 2020, it has been hailed as a high-performance blockchain protocol, becoming one of the cryptocurrencies with the highest global trading volume and market capitalization.
This article will comprehensively analyze the investment value comparison between XDC and SOL, focusing on historical price trends, supply mechanisms, institutional adoption, technological ecosystems, and future predictions, attempting to answer the question investors care about most:
"Which is the better buy right now?"
I. Price History Comparison and Current Market Status
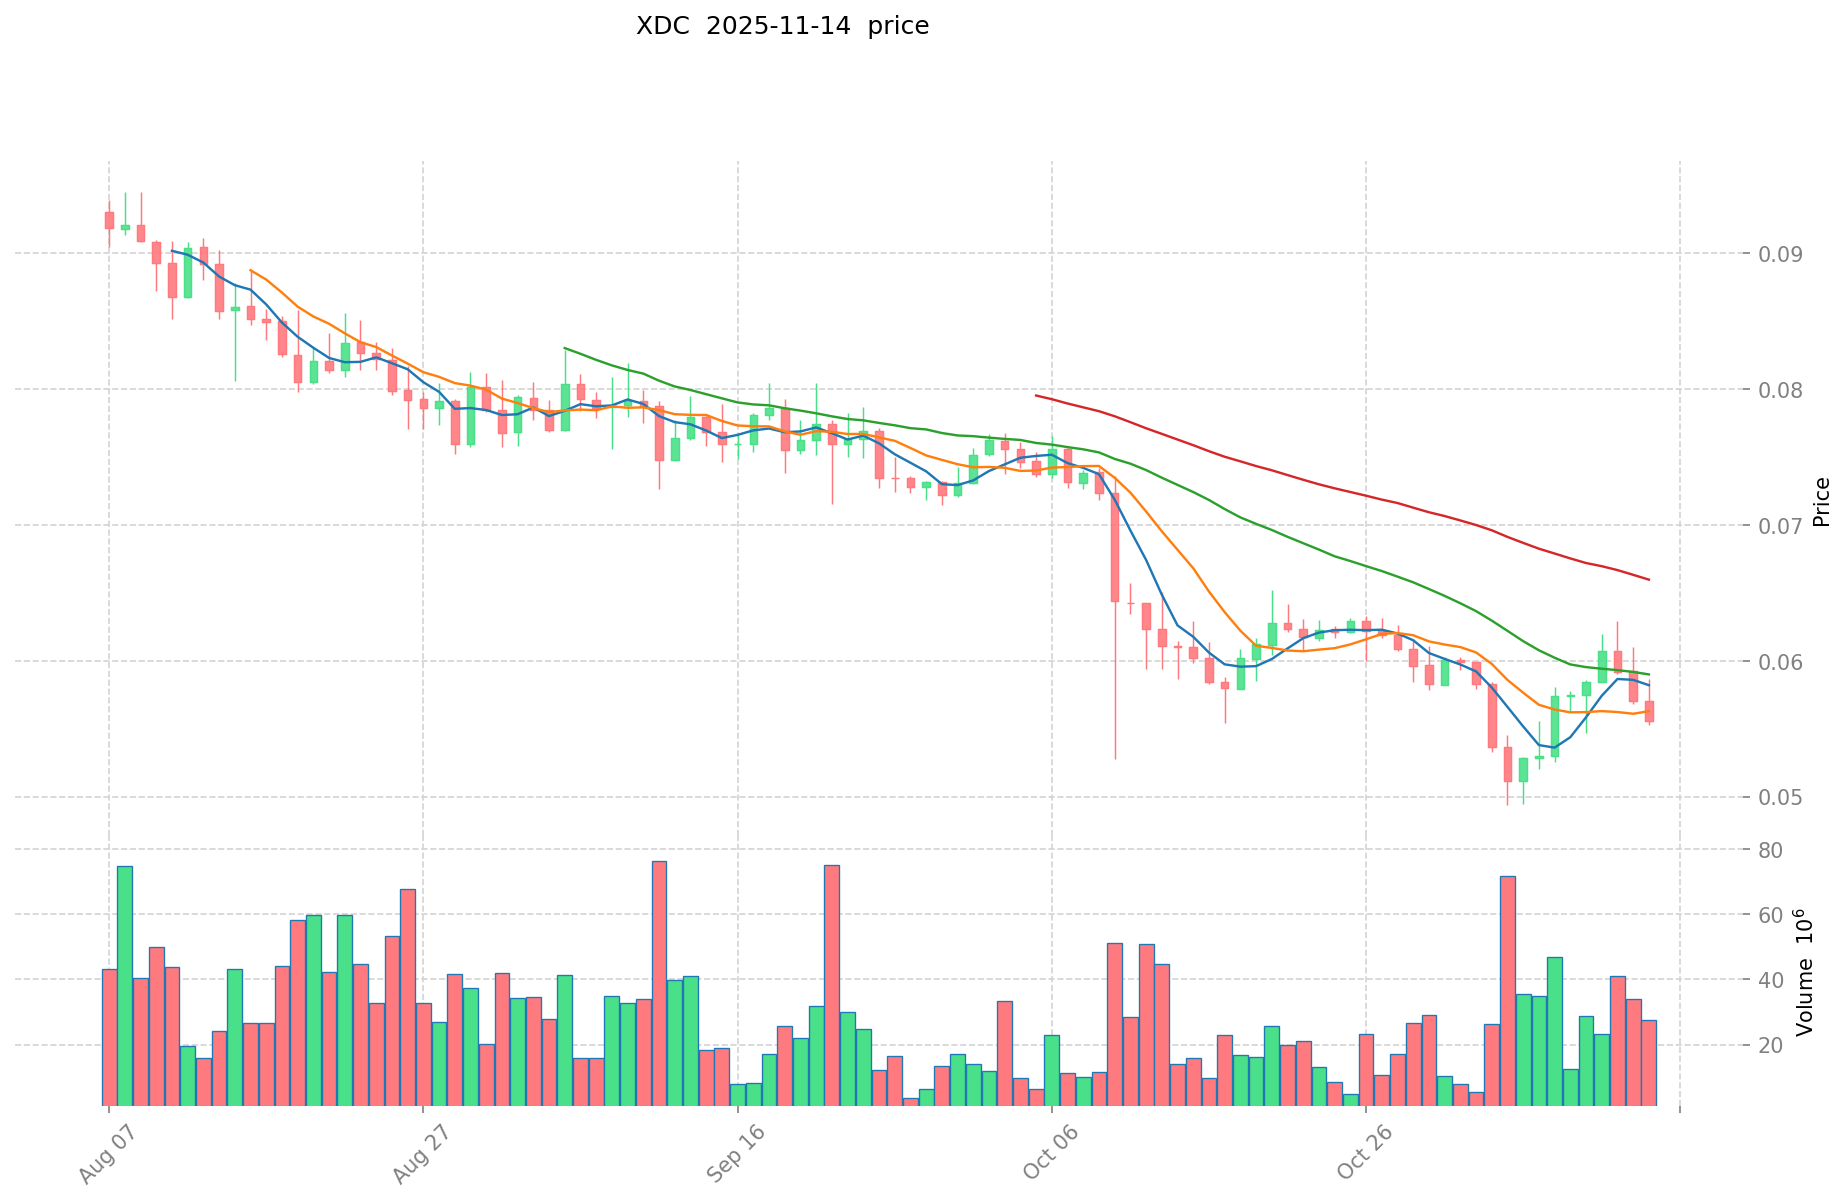
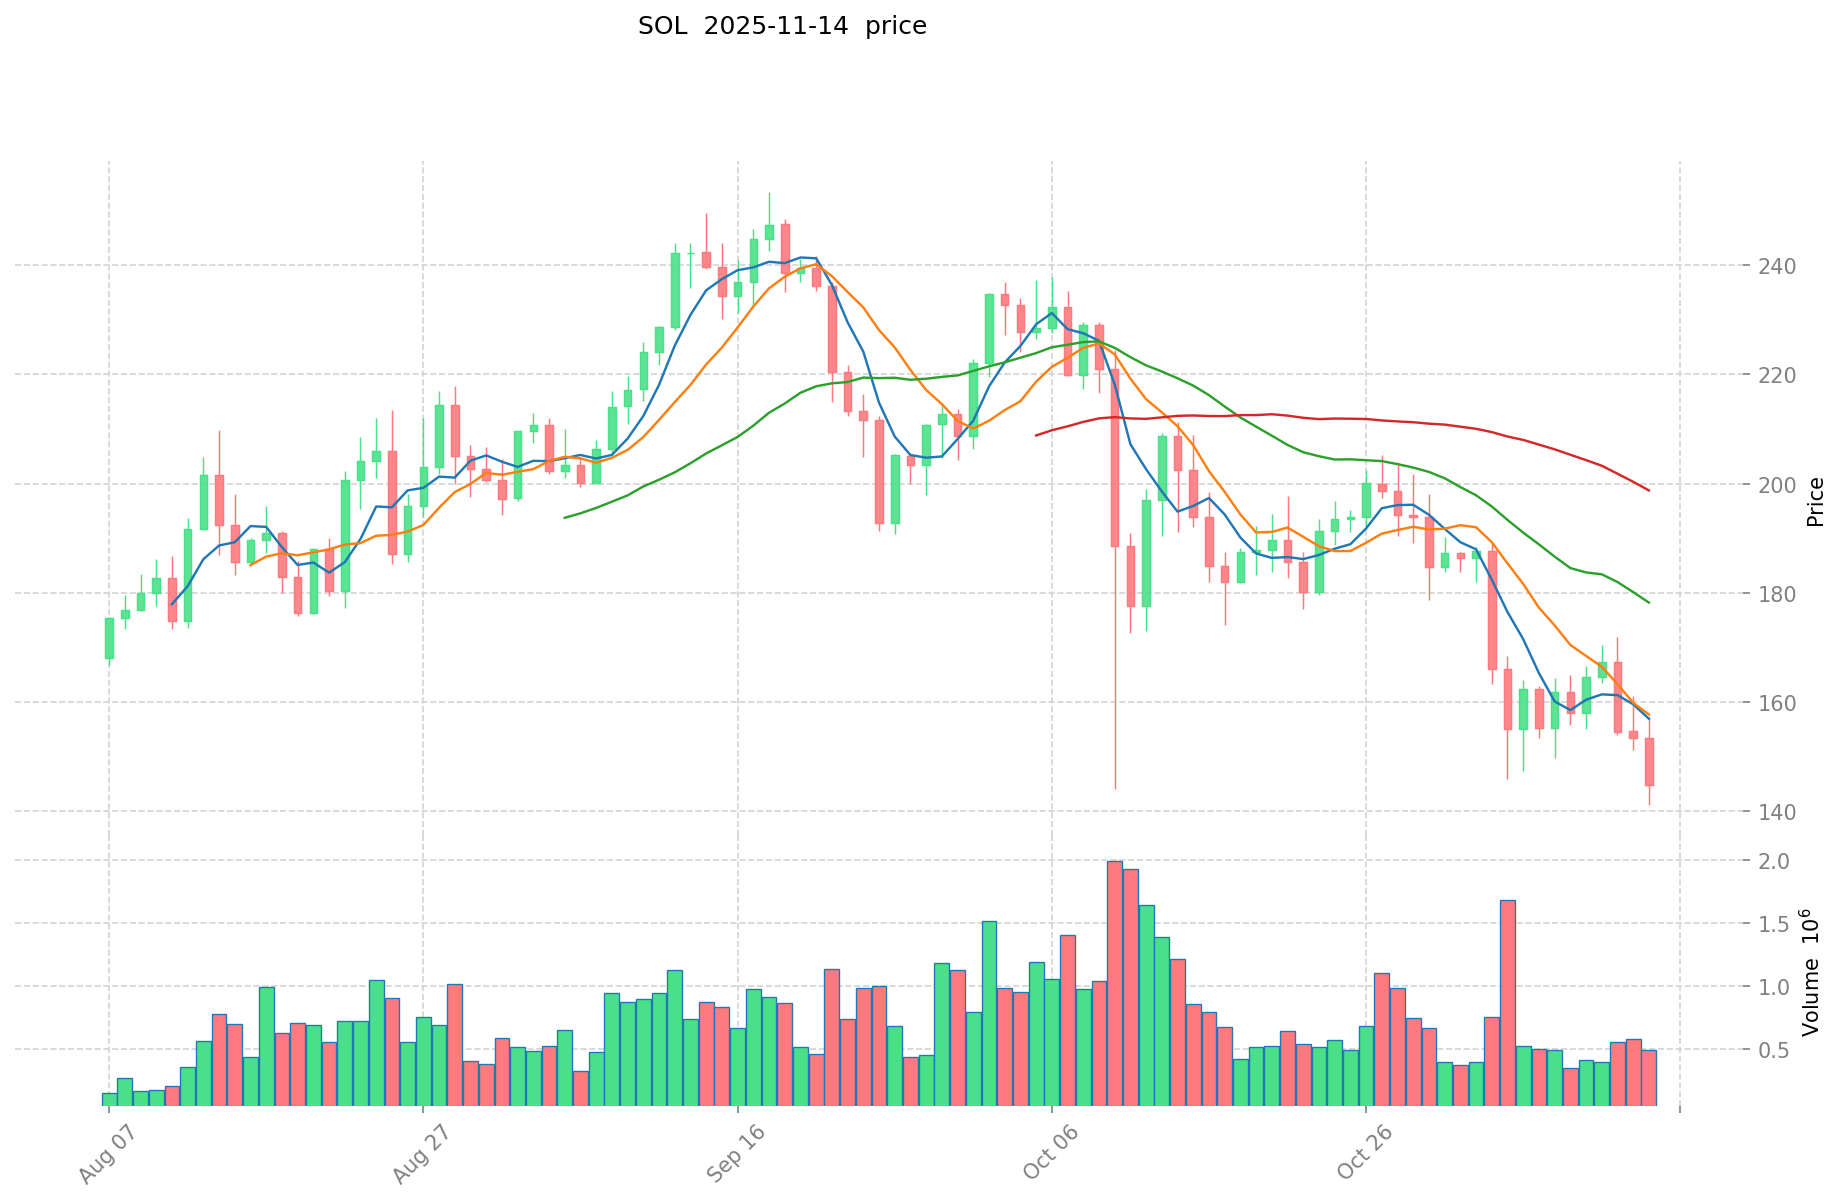
XDC (Coin A) and SOL (Coin B) Historical Price Trends
- 2021: XDC reached its all-time high of $0.192754 on August 21, 2021.
- 2025: SOL hit its historical peak of $293.31 on January 19, 2025.
- Comparative analysis: XDC's all-time low was $0.00039532 on July 22, 2019, while SOL's all-time low was $0.500801 on May 12, 2020.
Current Market Situation (2025-11-15)
- XDC current price: $0.05217
- SOL current price: $139.78
- 24-hour trading volume: XDC $1,739,015.91 vs SOL $75,695,522.94
- Market Sentiment Index (Fear & Greed Index): 16 (Extreme Fear)
Click to view real-time prices:
- Check XDC current price Market Price
- Check SOL current price Market Price
II. Core Factors Affecting Investment Value of XDC vs SOL
Supply Mechanism Comparison (Tokenomics)
- XDC: Total supply of 37.6 billion tokens with a circulating supply of approximately 13.8 billion (36.81%). XDC's consensus mechanism requires validators to stake 10 million XDC.
- SOL: Maximum supply of 569 million with current circulating supply of about 489 million (85.9%). Implements inflation that started at 8% annually and decreases by 15% each year until reaching 1.5%.
- 📌 Historical pattern: SOL's higher inflation rate has created selling pressure during market downturns, while XDC's controlled supply has shown more stability during market volatility.
Institutional Adoption and Market Applications
- Institutional holdings: SOL has more institutional interest with notable investments from Alameda Research, Multicoin Capital, and significant DeFi protocol integrations.
- Enterprise adoption: XDC has gained traction in trade finance and cross-border payments, partnering with organizations like R3 and Trade Finance Distribution Initiative. SOL focuses more on consumer-facing applications and DeFi protocols.
- Regulatory attitudes: XDC's focus on regulatory compliance has earned it favorable positioning in regions like Singapore and India, while SOL faces more regulatory uncertainty in various jurisdictions.
Technical Development and Ecosystem Building
- XDC technical upgrades: Implementing XDPoS 2.0 consensus for greater security and throughput, with a focus on interoperability for financial applications.
- SOL technical development: Implementing fee markets and stake-weighted QoS to address network congestion issues, with core focus on increasing scalability and transaction speeds.
- Ecosystem comparison: SOL leads in DeFi TVL ($1.3B+) and NFT volume. XDC focuses on enterprise applications with growing DeFi ecosystem (XDCFi) but smaller market footprint compared to Solana.
Macroeconomic Factors and Market Cycles
- Inflation performance: XDC's enterprise focus and integration with traditional finance provides stability during inflation, while SOL's more speculative use cases show higher volatility.
- Monetary policy impacts: Both tokens show sensitivity to interest rate changes, with SOL demonstrating higher beta (greater price movement) during Fed policy shifts.
- Geopolitical factors: XDC's cross-border payment solutions position it favorably amid increasing global trade fragmentation, while SOL's consumer applications make it more sensitive to retail investor sentiment.
III. 2025-2030 Price Prediction: XDC vs SOL
Short-term Prediction (2025)
- XDC: Conservative $0.046899 - $0.05211 | Optimistic $0.05211 - $0.0661797
- SOL: Conservative $87.2216 - $140.68 | Optimistic $140.68 - $175.85
Mid-term Prediction (2027)
- XDC may enter a growth phase, with estimated price range of $0.0380892834 - $0.098624037375
- SOL may enter a consolidation phase, with estimated price range of $91.56421575 - $175.09648275
- Key drivers: Institutional capital inflow, ETF, ecosystem development
Long-term Prediction (2030)
- XDC: Base scenario $0.070652287894702 - $0.103900423374562 | Optimistic scenario $0.103900423374562 - $0.146499596958133
- SOL: Base scenario $129.369111802536375 - $187.4914663804875 | Optimistic scenario $187.4914663804875 - $279.362284906926375
Disclaimer
XDC:
| 年份 | 预测最高价 | 预测平均价格 | 预测最低价 | 涨跌幅 |
|---|---|---|---|---|
| 2025 | 0.0661797 | 0.05211 | 0.046899 | 0 |
| 2026 | 0.076888305 | 0.05914485 | 0.050864571 | 13 |
| 2027 | 0.098624037375 | 0.0680165775 | 0.0380892834 | 30 |
| 2028 | 0.095818353553125 | 0.0833203074375 | 0.064156636726875 | 59 |
| 2029 | 0.118231516253812 | 0.089569330495312 | 0.067176997871484 | 71 |
| 2030 | 0.146499596958133 | 0.103900423374562 | 0.070652287894702 | 99 |
SOL:
| 年份 | 预测最高价 | 预测平均价格 | 预测最低价 | 涨跌幅 |
|---|---|---|---|---|
| 2025 | 175.85 | 140.68 | 87.2216 | 0 |
| 2026 | 163.01295 | 158.265 | 142.4385 | 13 |
| 2027 | 175.09648275 | 160.638975 | 91.56421575 | 14 |
| 2028 | 199.76259736125 | 167.867728875 | 88.96989630375 | 20 |
| 2029 | 191.16776964285 | 183.815163118125 | 176.4625565934 | 31 |
| 2030 | 279.362284906926375 | 187.4914663804875 | 129.369111802536375 | 34 |
IV. Investment Strategy Comparison: XDC vs SOL
Long-term vs Short-term Investment Strategies
- XDC: Suitable for investors focused on enterprise adoption, trade finance, and cross-border payment solutions
- SOL: Suitable for investors seeking high-performance blockchain protocols and exposure to DeFi and NFT ecosystems
Risk Management and Asset Allocation
- Conservative investors: XDC: 60% vs SOL: 40%
- Aggressive investors: XDC: 40% vs SOL: 60%
- Hedging tools: Stablecoin allocation, options, cross-currency portfolio
V. Potential Risk Comparison
Market Risks
- XDC: Lower liquidity and trading volume may lead to higher price volatility
- SOL: Higher susceptibility to market sentiment and speculative trading
Technical Risks
- XDC: Scalability, network stability
- SOL: Network congestion, potential security vulnerabilities
Regulatory Risks
- Global regulatory policies have different impacts on both: XDC may face less scrutiny due to its focus on regulatory compliance, while SOL may encounter more regulatory challenges in various jurisdictions
VI. Conclusion: Which Is the Better Buy?
📌 Investment Value Summary:
- XDC advantages: Strong focus on enterprise adoption, regulatory compliance, and stability in trade finance applications
- SOL advantages: High performance, large ecosystem, strong institutional interest, and leadership in DeFi and NFT markets
✅ Investment Advice:
- New investors: Consider a balanced approach with a slight tilt towards XDC for its stability and regulatory compliance
- Experienced investors: Allocate based on risk tolerance, with SOL for higher growth potential and XDC for stability
- Institutional investors: Explore both for different use cases - XDC for trade finance solutions and SOL for DeFi exposure
⚠️ Risk Warning: The cryptocurrency market is highly volatile. This article does not constitute investment advice. None
VII. FAQ
Q1: What are the key differences between XDC and SOL in terms of their use cases? A: XDC focuses on global trade and finance digitization, particularly in trade finance and cross-border payments. SOL is positioned as a high-performance blockchain protocol, primarily used in DeFi, NFTs, and consumer-facing applications.
Q2: How do the supply mechanisms of XDC and SOL differ? A: XDC has a total supply of 37.6 billion tokens with about 36.81% in circulation. SOL has a maximum supply of 569 million with about 85.9% in circulation and implements an inflationary model that decreases over time.
Q3: Which cryptocurrency has shown more stability during market volatility? A: XDC has shown more stability during market volatility due to its controlled supply mechanism, while SOL's higher inflation rate has created more selling pressure during market downturns.
Q4: How do XDC and SOL compare in terms of institutional adoption? A: SOL has attracted more institutional interest and investments from notable firms like Alameda Research and Multicoin Capital. XDC has gained traction in enterprise adoption, particularly in trade finance and cross-border payments.
Q5: What are the main technical developments for each cryptocurrency? A: XDC is implementing XDPoS 2.0 consensus for improved security and throughput. SOL is focusing on implementing fee markets and stake-weighted QoS to address network congestion issues.
Q6: How do XDC and SOL differ in their ecosystem development? A: SOL leads in DeFi Total Value Locked (TVL) and NFT volume. XDC is building its ecosystem around enterprise applications with a growing DeFi ecosystem (XDCFi), but has a smaller market footprint compared to Solana.
Q7: What are the potential risks associated with investing in XDC and SOL? A: XDC faces risks related to lower liquidity and trading volume, which may lead to higher price volatility. SOL is more susceptible to market sentiment and speculative trading, and has faced network congestion issues. Both cryptocurrencies are subject to regulatory risks, with SOL potentially facing more scrutiny in various jurisdictions.
Share
Content
Introduction: XDC vs SOL Investment Comparison
I. Price History Comparison and Current Market Status
II. Core Factors Affecting Investment Value of XDC vs SOL
III. 2025-2030 Price Prediction: XDC vs SOL
IV. Investment Strategy Comparison: XDC vs SOL
V. Potential Risk Comparison
VI. Conclusion: Which Is the Better Buy?
VII. FAQ

