ZBCN vs OP: The Ultimate Showdown of Coding Titans in the Tech Industry
Introduction: Investment Comparison of ZBCN vs OP
In the cryptocurrency market, the comparison between Zebec Protocol (ZBCN) vs Optimism (OP) has been an unavoidable topic for investors. The two not only show significant differences in market cap ranking, application scenarios, and price performance, but also represent different positions in the crypto asset landscape.
Zebec Protocol (ZBCN): Since its launch, it has gained market recognition for its decentralized infrastructure network aimed at facilitating the free and seamless flow of real-world value.
Optimism (OP): Introduced as a low-cost, lightning-fast Ethereum Layer 2 blockchain, it has been addressing the practical needs of developers and users in the Ethereum ecosystem.
This article will provide a comprehensive analysis of the investment value comparison between ZBCN and OP, focusing on historical price trends, supply mechanisms, institutional adoption, technological ecosystems, and future predictions, attempting to answer the question most concerning to investors:
"Which is the better buy right now?"
I. Price History Comparison and Current Market Status
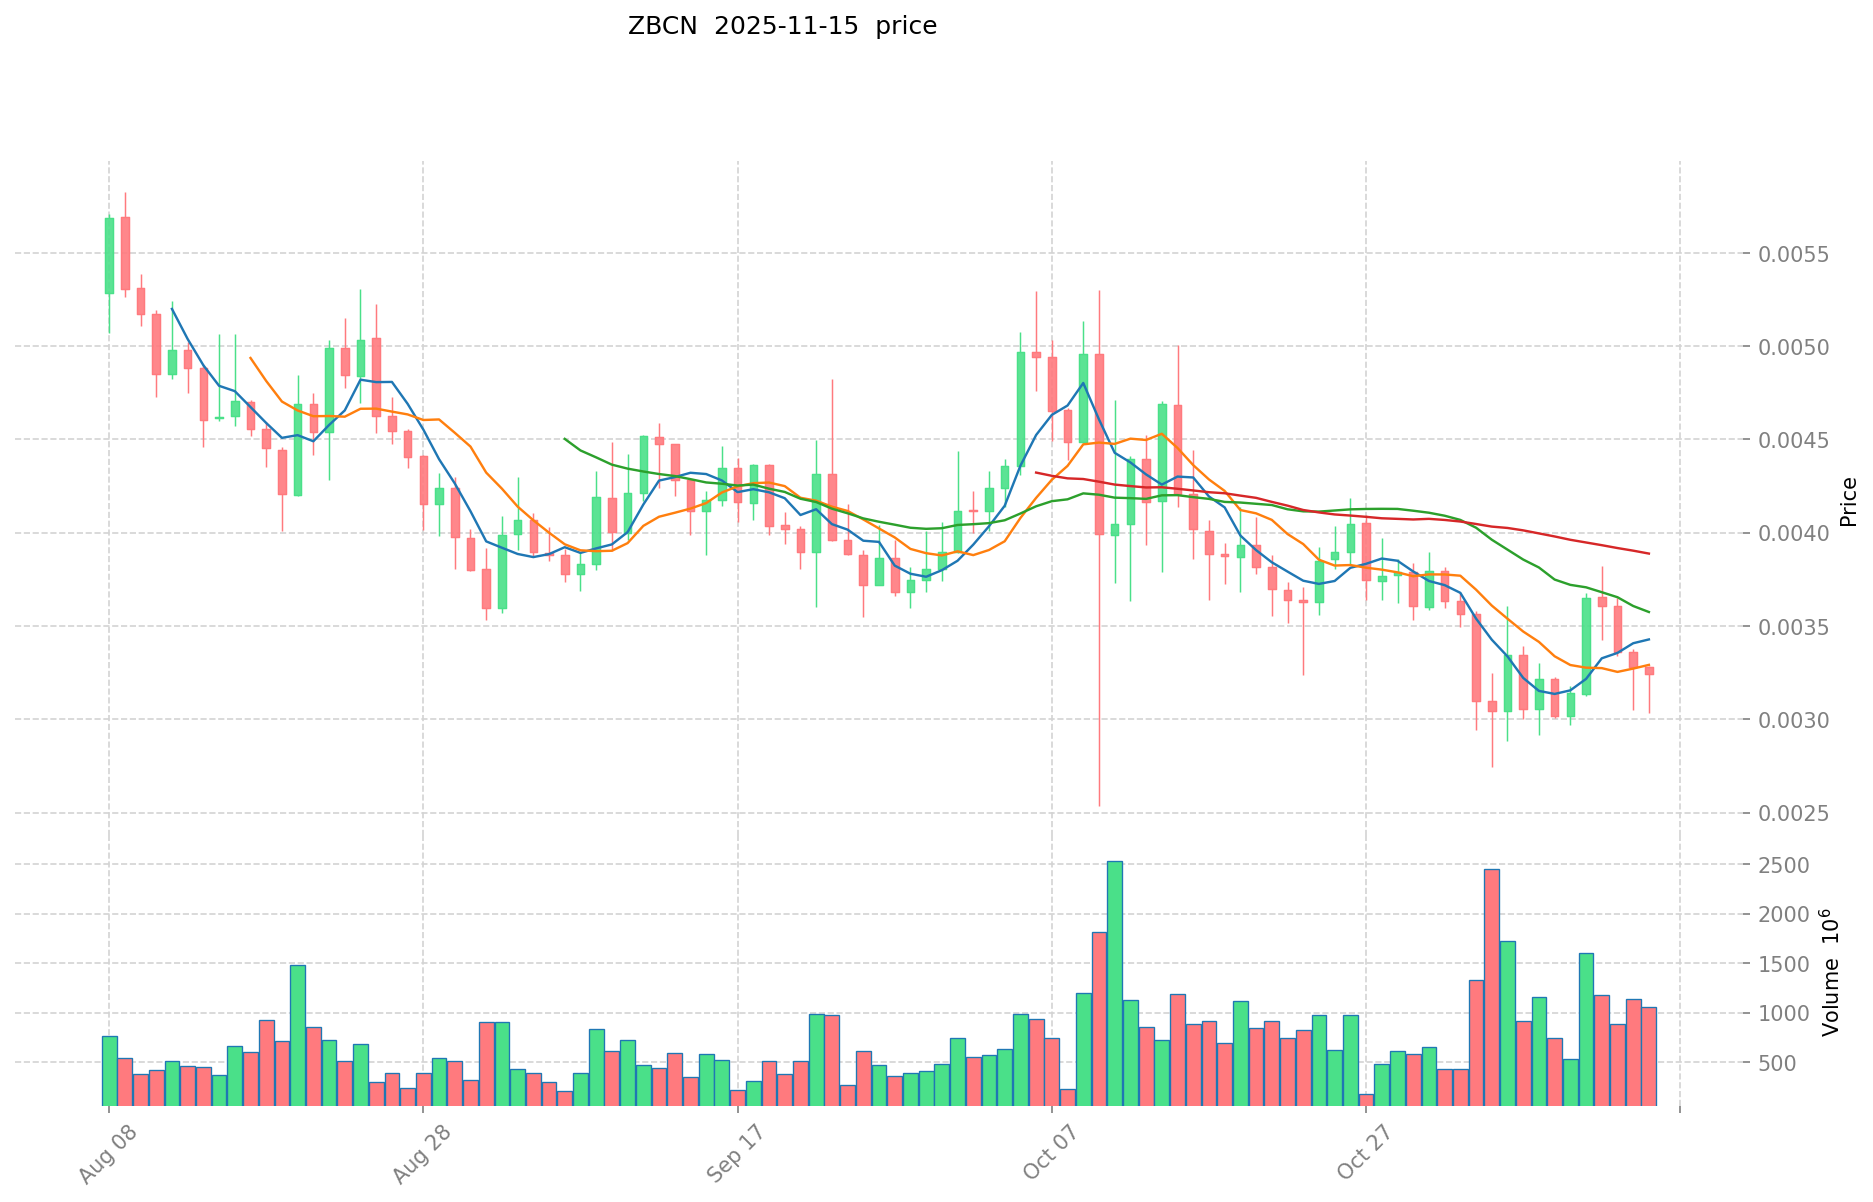
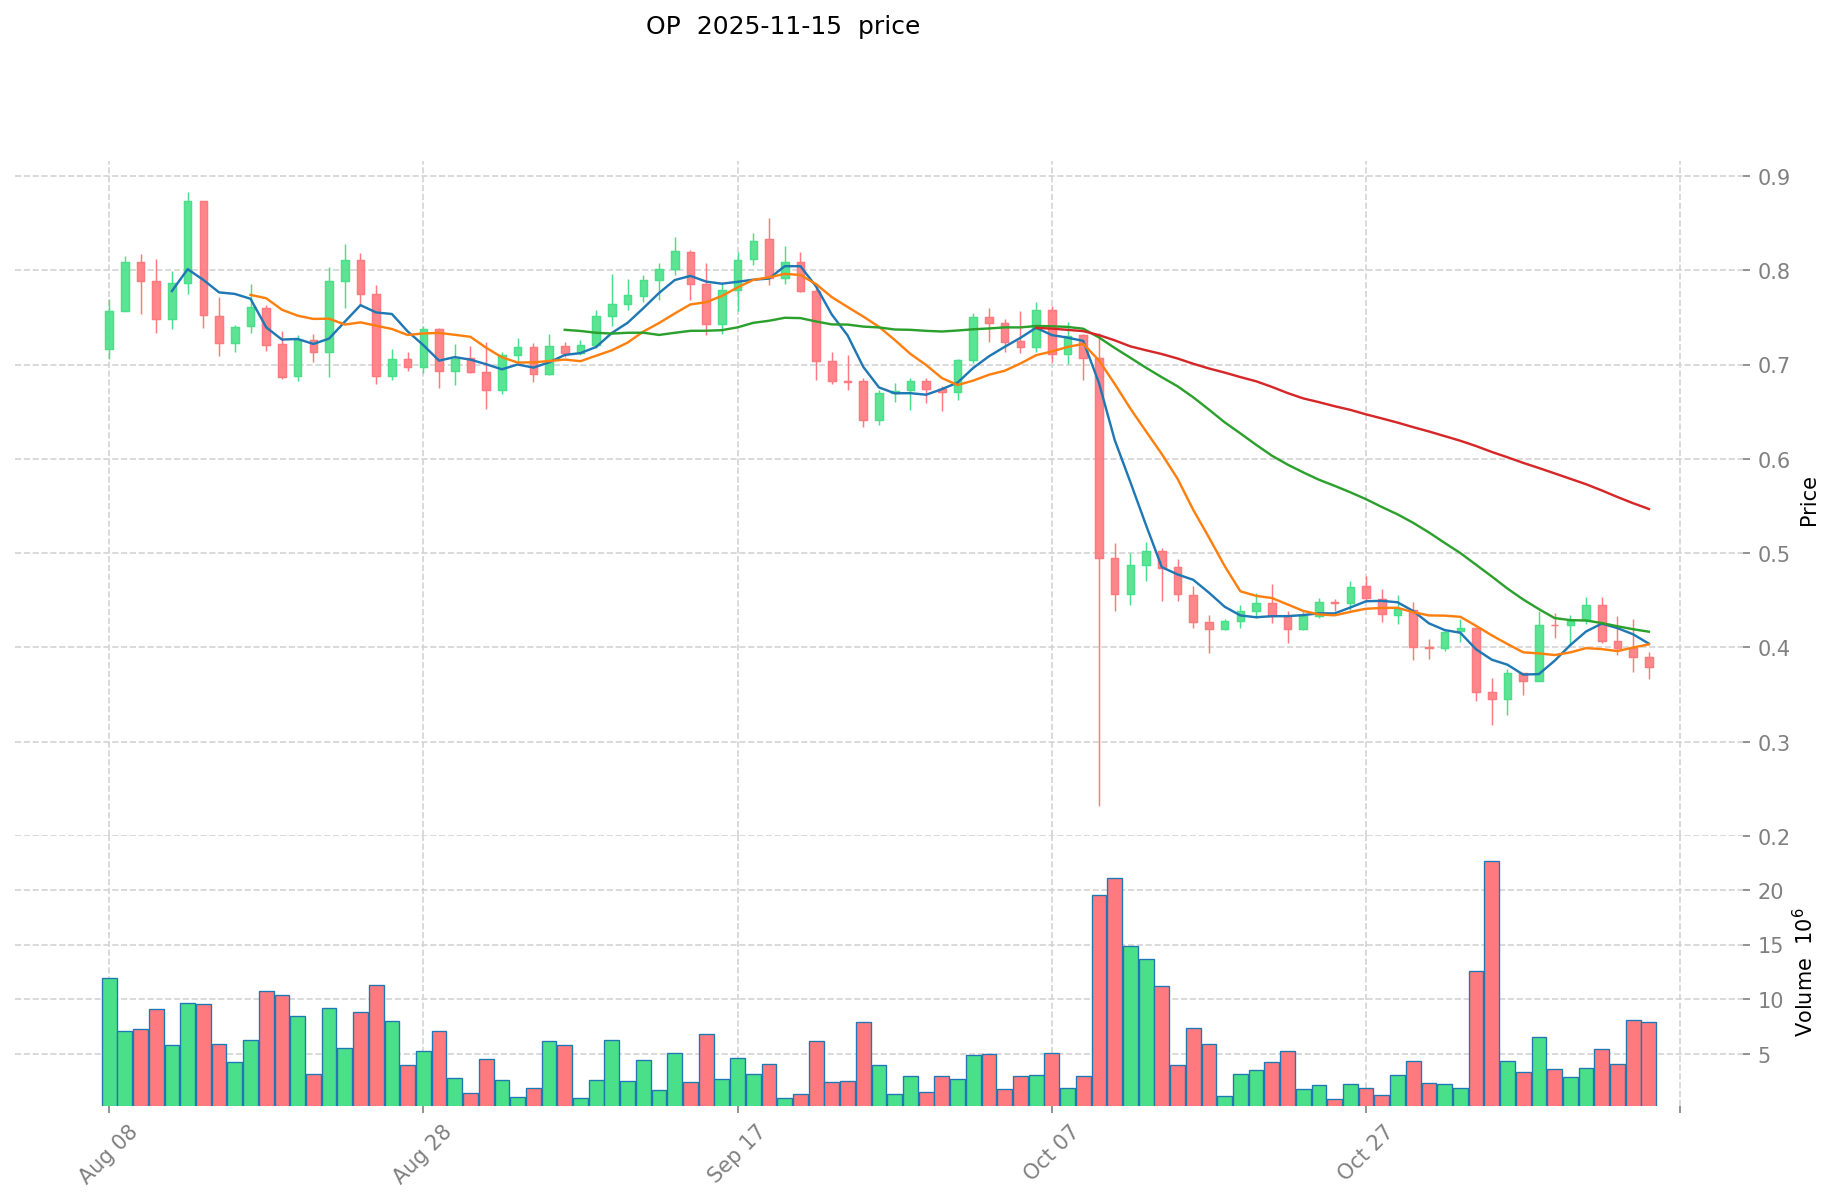
ZBCN (Coin A) and OP (Coin B) Historical Price Trends
- 2024: ZBCN reached its all-time low of $0.000686 on August 5, 2024.
- 2024: OP hit its all-time high of $4.84 on March 6, 2024.
- Comparative Analysis: During the market cycle, ZBCN rose from its low point to reach an all-time high of $0.007193 on May 30, 2025, while OP declined from its peak to a low of $0.322746 on November 5, 2025.
Current Market Situation (2025-11-15)
- ZBCN current price: $0.003145
- OP current price: $0.394
- 24-hour trading volume: ZBCN $3,248,320.93 vs OP $1,918,282.27
- Market Sentiment Index (Fear & Greed Index): 10 (Extreme Fear)
Click to view real-time prices:
- Check ZBCN current price Market Price
- Check OP current price Market Price


II. Core Factors Affecting ZBCN vs OP Investment Value
Supply Mechanism Comparison (Tokenomics)
-
ZBCN: Limited supply mechanism with a maximum cap of 1 billion tokens
-
OP: Inflation model with ongoing token emissions through airdrops and grants
-
📌 Historical Pattern: Limited supply tokens like ZBCN tend to maintain value better during market downturns, while inflationary tokens like OP require strong demand drivers to offset continuous supply increases.
Institutional Adoption and Market Applications
- Institutional Holdings: OP has attracted more institutional investments through Optimism's ecosystem grants program
- Enterprise Adoption: ZBCN appears in more cross-border payment solutions, while OP focuses on Ethereum scaling applications
- Regulatory Attitudes: Both tokens face regulatory uncertainty, though Layer-2 solutions like Optimism generally experience less regulatory scrutiny than independent blockchains
Technical Development and Ecosystem Building
- ZBCN Technical Upgrades: Enhanced cross-chain interoperability and enterprise integration tools
- OP Technical Development: Optimistic rollup improvements and Ethereum alignment with the Superchain vision
- Ecosystem Comparison: OP leads in DeFi application diversity and developer activity, while ZBCN shows stronger adoption in payment and cross-border transaction use cases
Macroeconomic Factors and Market Cycles
- Inflation Performance: ZBCN's capped supply model theoretically offers better inflation protection
- Monetary Policy Impact: Both tokens show correlation with tech equity markets during interest rate changes
- Geopolitical Factors: ZBCN benefits more from cross-border transaction demand in uncertain geopolitical environments
III. 2025-2030 Price Prediction: ZBCN vs OP
Short-term Forecast (2025)
- ZBCN: Conservative $0.0027946 - $0.00314 | Optimistic $0.00314 - $0.003768
- OP: Conservative $0.225036 - $0.3948 | Optimistic $0.3948 - $0.588252
Mid-term Forecast (2027)
- ZBCN may enter a growth phase, with prices expected in the range of $0.00357489 - $0.0052457625
- OP may enter a consolidation phase, with prices expected in the range of $0.337186836 - $0.6924372525
- Key drivers: Institutional capital inflow, ETF, ecosystem development
Long-term Forecast (2030)
- ZBCN: Base scenario $0.005776823095312 - $0.006051909909375 | Optimistic scenario $0.006051909909375 - $0.006758883021515
- OP: Base scenario $0.7759572275385 - $0.852853889727 | Optimistic scenario $0.852853889727 - $0.9311486730462
Disclaimer: The above predictions are based on historical data and market analysis. Cryptocurrency markets are highly volatile and subject to rapid changes. These forecasts should not be considered as financial advice. Always conduct your own research before making investment decisions.
ZBCN:
| 年份 | 预测最高价 | 预测平均价格 | 预测最低价 | 涨跌幅 |
|---|---|---|---|---|
| 2025 | 0.003768 | 0.00314 | 0.0027946 | 0 |
| 2026 | 0.0043175 | 0.003454 | 0.00314314 | 10 |
| 2027 | 0.0052457625 | 0.00388575 | 0.00357489 | 23 |
| 2028 | 0.0064377163125 | 0.00456575625 | 0.0023285356875 | 45 |
| 2029 | 0.006051909909375 | 0.00550173628125 | 0.003466093857187 | 75 |
| 2030 | 0.006758883021515 | 0.005776823095312 | 0.003061716240515 | 84 |
OP:
| 年份 | 预测最高价 | 预测平均价格 | 预测最低价 | 涨跌幅 |
|---|---|---|---|---|
| 2025 | 0.588252 | 0.3948 | 0.225036 | 0 |
| 2026 | 0.7127127 | 0.491526 | 0.35389872 | 24 |
| 2027 | 0.6924372525 | 0.60211935 | 0.337186836 | 52 |
| 2028 | 0.75084282945 | 0.64727830125 | 0.4142581128 | 64 |
| 2029 | 0.852853889727 | 0.69906056535 | 0.55924845228 | 77 |
| 2030 | 0.9311486730462 | 0.7759572275385 | 0.488853053349255 | 96 |
IV. Investment Strategy Comparison: ZBCN vs OP
Long-term vs Short-term Investment Strategy
- ZBCN: Suitable for investors focused on cross-border payment solutions and ecosystem potential
- OP: Suitable for investors interested in Ethereum scaling solutions and DeFi ecosystem growth
Risk Management and Asset Allocation
- Conservative investors: ZBCN: 30% vs OP: 70%
- Aggressive investors: ZBCN: 60% vs OP: 40%
- Hedging tools: Stablecoin allocation, options, cross-currency portfolios
V. Potential Risk Comparison
Market Risk
- ZBCN: Higher volatility due to lower market cap and trading volume
- OP: Susceptible to broader Ethereum ecosystem trends and Layer 2 competition
Technical Risk
- ZBCN: Scalability, network stability
- OP: Reliance on Ethereum's development, potential vulnerabilities in rollup technology
Regulatory Risk
- Global regulatory policies may impact both tokens differently, with Layer 2 solutions like OP potentially facing less scrutiny
VI. Conclusion: Which Is the Better Buy?
📌 Investment Value Summary:
- ZBCN advantages: Limited supply, cross-border payment focus, potential for growth in niche markets
- OP advantages: Established Layer 2 solution, strong developer ecosystem, alignment with Ethereum's future
✅ Investment Advice:
- New investors: Consider a balanced approach, leaning towards OP for its more established ecosystem
- Experienced investors: Explore a diversified portfolio including both tokens, with weightings based on risk tolerance
- Institutional investors: Focus on OP for its institutional-grade infrastructure and ecosystem grants program
⚠️ Risk Warning: The cryptocurrency market is highly volatile. This article does not constitute investment advice. None
VII. FAQ
Q1: What are the key differences between ZBCN and OP? A: ZBCN is focused on decentralized infrastructure for real-world value flow, while OP is an Ethereum Layer 2 scaling solution. ZBCN has a limited supply of 1 billion tokens, whereas OP has an inflationary model. ZBCN is more prominent in cross-border payments, while OP leads in DeFi applications and developer activity.
Q2: Which token has performed better historically? A: Historical performance varies. ZBCN reached its all-time low of $0.000686 in August 2024 and peaked at $0.007193 in May 2025. OP hit its all-time high of $4.84 in March 2024 but declined to $0.322746 by November 2025. Current market conditions and long-term trends should be considered for a comprehensive comparison.
Q3: How do the supply mechanisms of ZBCN and OP differ? A: ZBCN has a limited supply mechanism with a maximum cap of 1 billion tokens. OP, on the other hand, follows an inflationary model with ongoing token emissions through airdrops and grants. This difference can impact their long-term value propositions and market behavior.
Q4: Which token is more suitable for long-term investment? A: Both tokens have potential for long-term investment, but suit different strategies. ZBCN may be more suitable for investors focused on cross-border payment solutions and ecosystem potential, while OP might appeal to those interested in Ethereum scaling solutions and DeFi ecosystem growth. The choice depends on individual investment goals and risk tolerance.
Q5: What are the main risks associated with investing in ZBCN and OP? A: For ZBCN, risks include higher volatility due to lower market cap, and technical risks related to scalability and network stability. OP faces risks tied to Ethereum ecosystem trends, Layer 2 competition, and potential vulnerabilities in rollup technology. Both tokens are subject to regulatory risks, though OP may face less scrutiny as a Layer 2 solution.
Q6: How might institutional adoption affect the future of ZBCN and OP? A: Institutional adoption could significantly impact both tokens. OP has attracted more institutional investments through Optimism's ecosystem grants program, potentially leading to increased development and adoption. ZBCN's adoption in cross-border payment solutions could attract different types of institutional interest, particularly from companies involved in international transactions.
Q7: What factors should be considered when deciding between ZBCN and OP for investment? A: Investors should consider several factors: market cap and liquidity, technological ecosystems and development roadmaps, adoption rates and real-world use cases, regulatory environment, and alignment with personal investment goals. Additionally, the overall crypto market conditions and individual risk tolerance should play a role in the decision-making process.
Share
Content