ZBU vs SOL: The Battle for Cryptocurrency Dominance in Emerging Markets
Introduction: ZBU vs SOL Investment Comparison
In the cryptocurrency market, the comparison between ZBU and SOL has always been a topic that investors can't ignore. The two not only have significant differences in market cap ranking, application scenarios, and price performance, but also represent different cryptocurrency asset positions.
ZEEBU (ZBU): Since its launch, it has gained market recognition for its focus on building a Web3 Neobank for telecoms.
Solana (SOL): Since its inception in 2017, it has been hailed as a high-performance blockchain protocol, and is one of the cryptocurrencies with the highest global trading volume and market capitalization.
This article will comprehensively analyze the investment value comparison between ZBU and SOL, focusing on historical price trends, supply mechanisms, institutional adoption, technological ecosystems, and future predictions, attempting to answer the question that investors care about most:
"Which is the better buy right now?"
I. Price History Comparison and Current Market Status
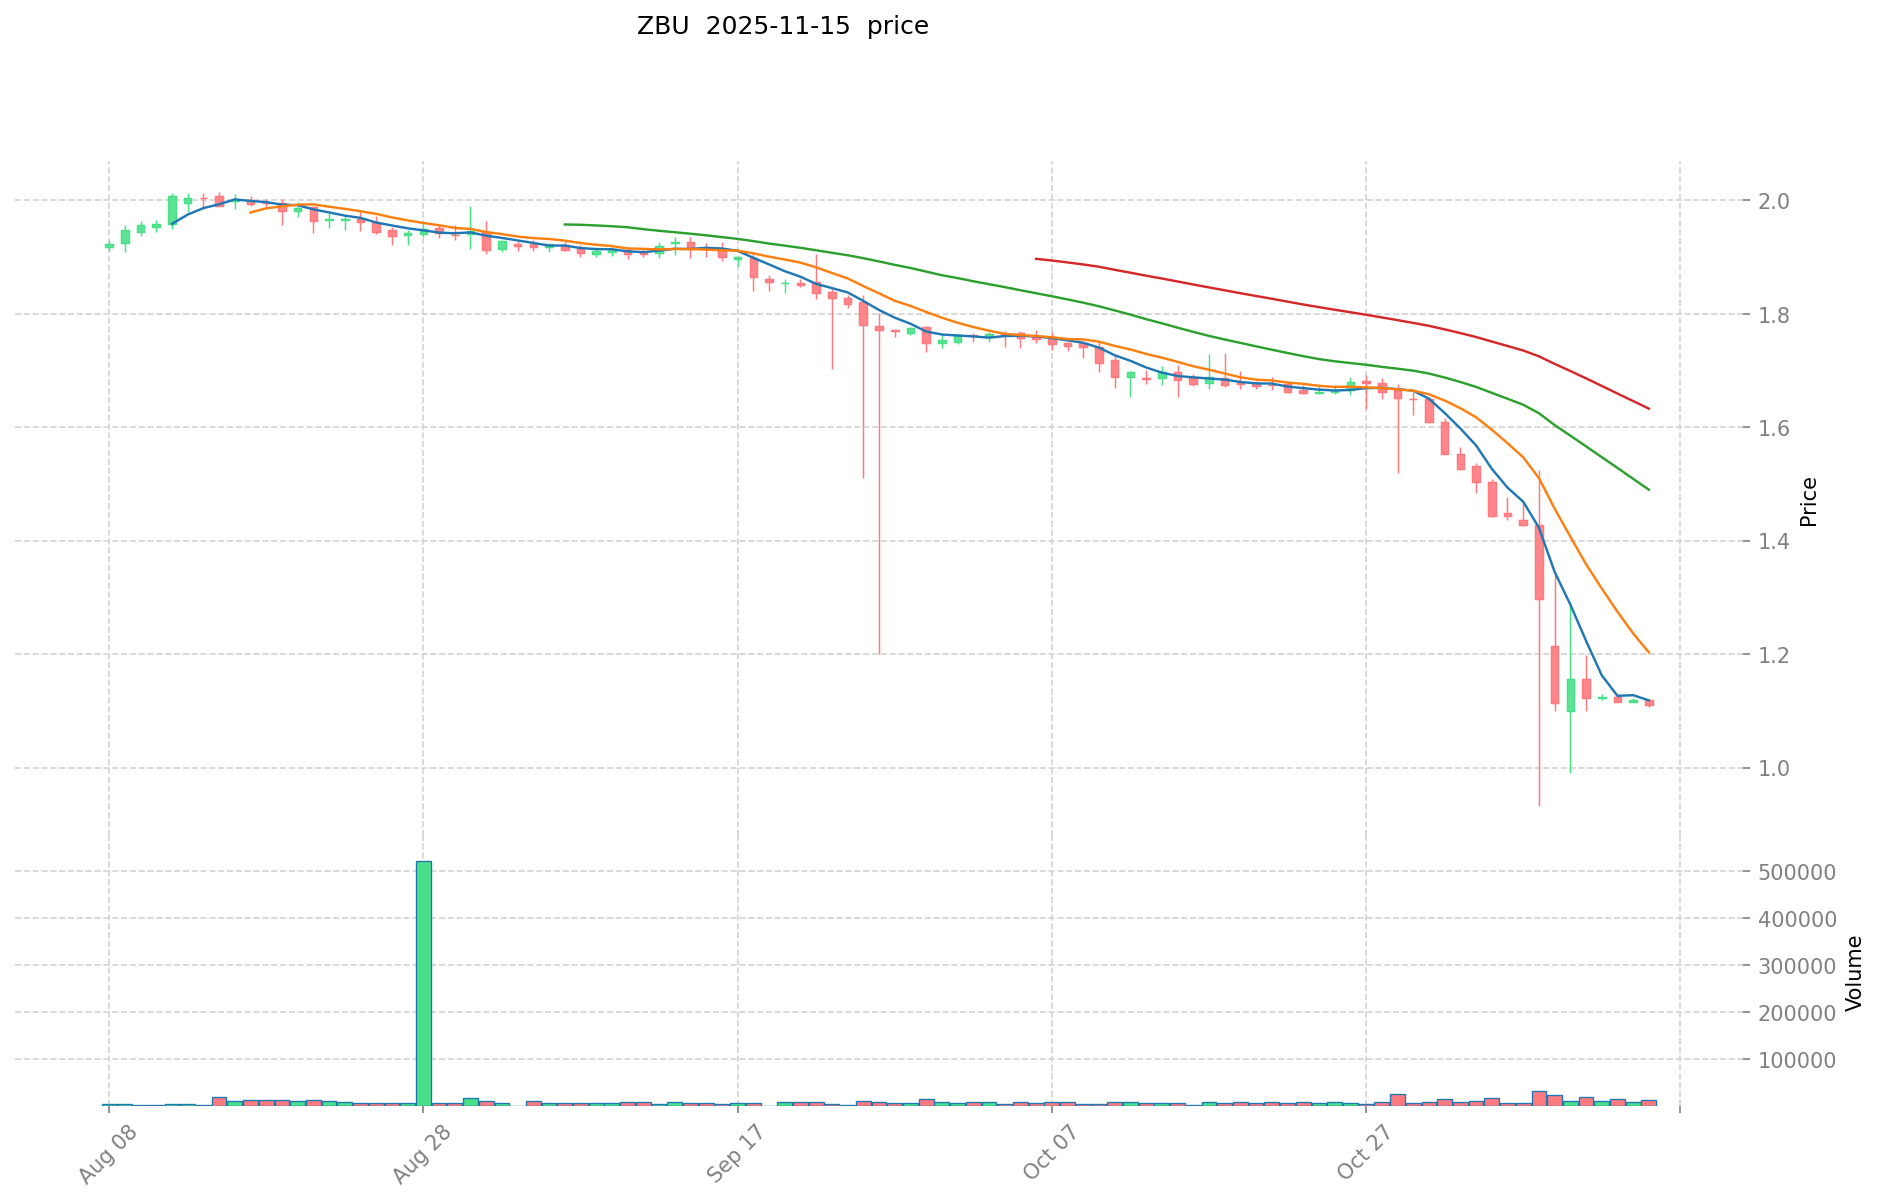
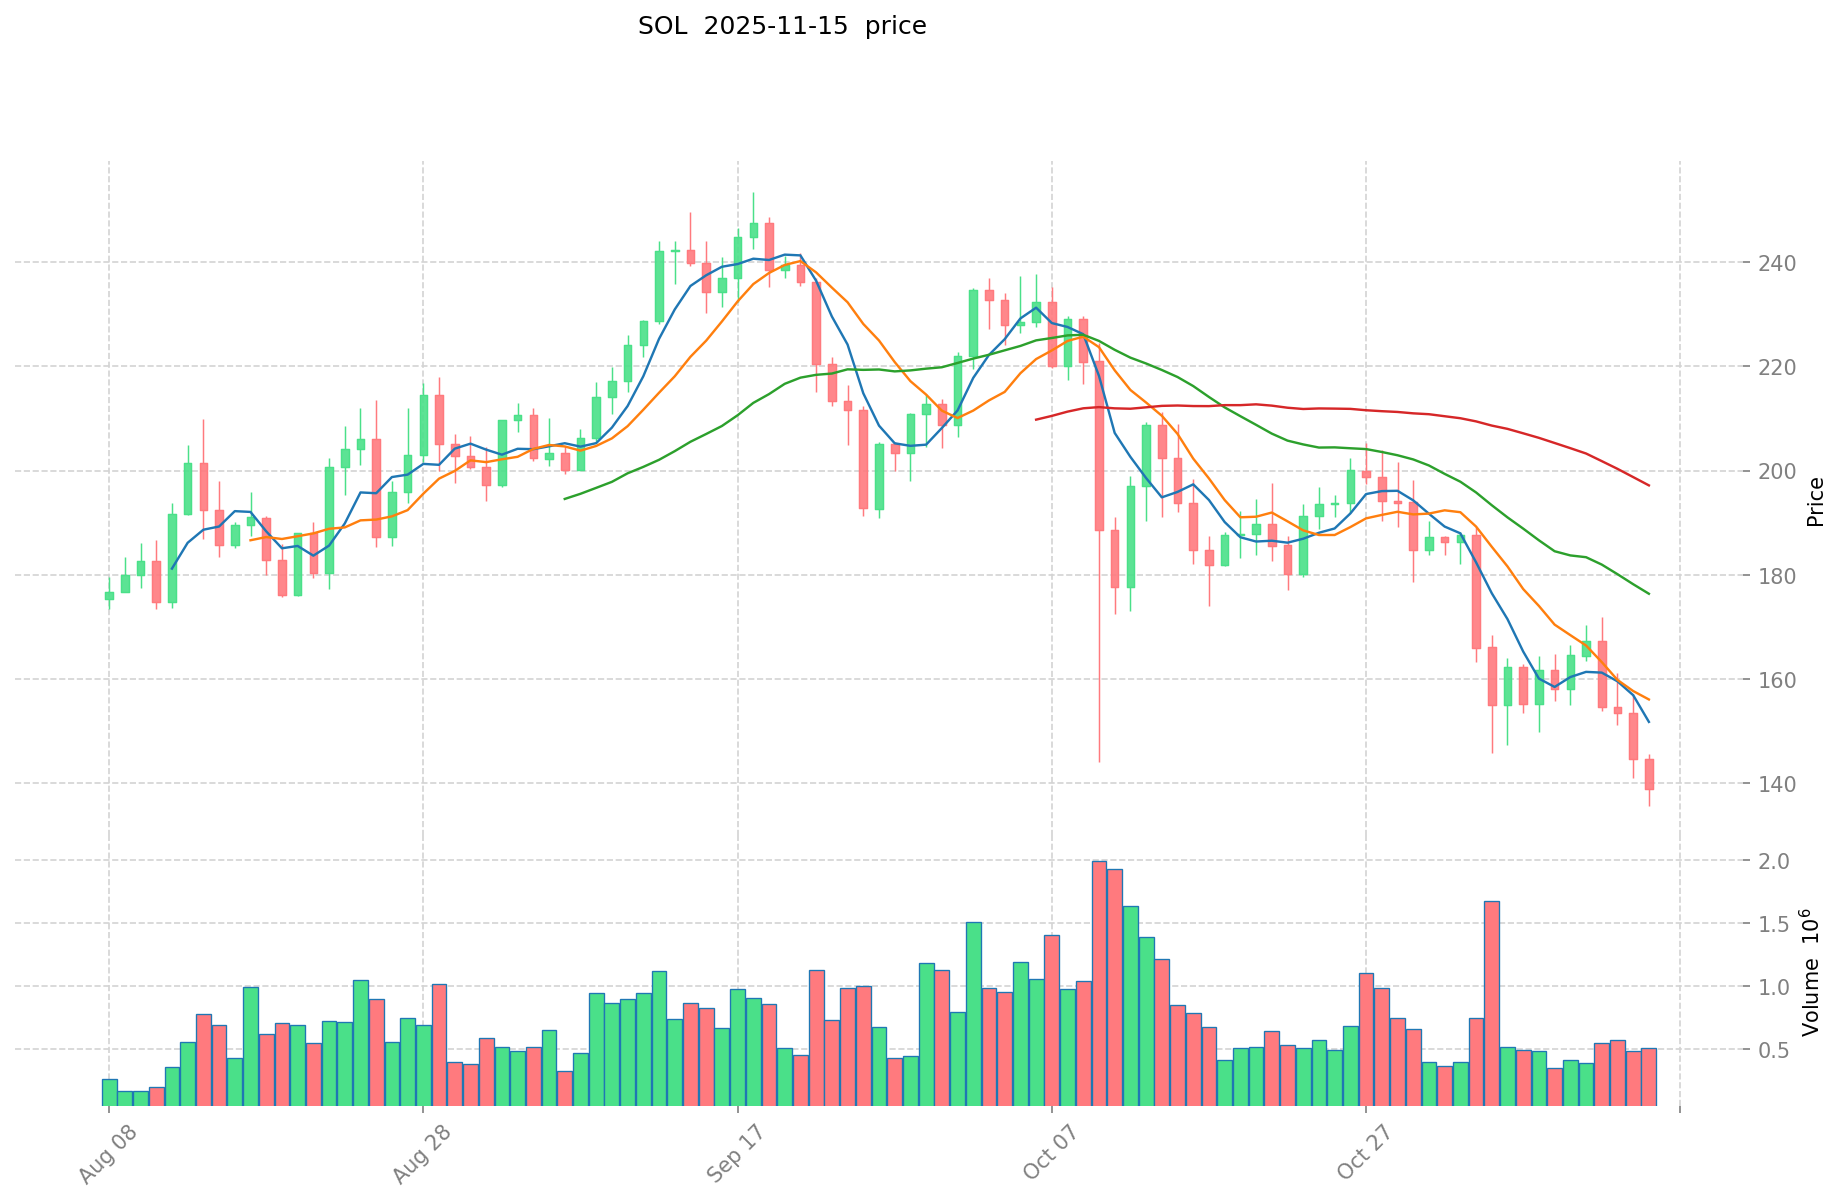
ZBU (Coin A) and SOL (Coin B) Historical Price Trends
- 2023: ZBU launched at $1.6, experiencing price fluctuations in its early stages.
- 2024: SOL reached its all-time high of $293.31 on January 19, 2024, marking a significant milestone for the project.
- Comparative analysis: In the recent market cycle, ZBU dropped from its all-time high of $6.6 to a low of $0.162, while SOL has shown more resilience, currently trading at $142.66 after reaching its all-time high.
Current Market Situation (2025-11-15)
- ZBU current price: $1.105
- SOL current price: $142.66
- 24-hour trading volume: ZBU $12,404.89 vs SOL $72,117,096.71
- Market Sentiment Index (Fear & Greed Index): 10 (Extreme Fear)
Click to view real-time prices:
- Check ZBU current price Market Price
- Check SOL current price Market Price
II. Core Factors Impacting ZBU vs SOL Investment Value
Supply Mechanism Comparison (Tokenomics)
- ZBU: Limited total supply of 10 million tokens with a deflationary model featuring token burns from transaction fees
- SOL: Inflationary tokenomics with initial annual inflation of 8%, gradually decreasing to a long-term stable rate of 1.5%
- 📌 Historical pattern: Deflationary models like ZBU tend to create upward price pressure during high demand periods, while SOL's inflation model can exert downward pressure unless network usage keeps pace.
Institutional Adoption and Market Applications
- Institutional holdings: SOL has attracted more institutional investors, including Alameda Research, Multicoin Capital, and FTX Ventures
- Enterprise adoption: SOL has gained more traction in enterprise solutions for high-throughput applications, while ZBU is positioning for enterprise payment and settlement systems
- Regulatory attitudes: SOL faces fewer regulatory concerns as a pure utility token, while ZBU may encounter more scrutiny from regulators due to its positioning as a digital currency alternative
Technical Development and Ecosystem Building
- ZBU technical upgrades: Implementation of Lightning Network integration for faster transaction processing and lower fees
- SOL technical development: Continuous improvements to Proof of History consensus mechanism and Gulf Stream transaction forwarding protocol to enhance TPS capabilities
- Ecosystem comparison: SOL has a more mature ecosystem with extensive DeFi protocols, NFT marketplaces, and gaming applications, while ZBU is developing its ecosystem with focus on payment solutions and cross-border transactions
Macroeconomic and Market Cycles
- Performance in inflationary environments: ZBU demonstrates stronger anti-inflation properties due to its fixed supply model
- Macroeconomic monetary policy: Both assets show sensitivity to interest rate changes, with ZBU typically experiencing higher volatility during Federal Reserve policy shifts
- Geopolitical factors: ZBU benefits more from cross-border transaction demand and financial uncertainty, while SOL is less correlated with international political developments
III. 2025-2030 Price Prediction: ZBU vs SOL
Short-term Prediction (2025)
- ZBU: Conservative $0.81 - $1.11 | Optimistic $1.11 - $1.46
- SOL: Conservative $94.13 - $142.62 | Optimistic $142.62 - $166.87
Mid-term Prediction (2027)
- ZBU may enter a growth phase, with expected prices ranging from $1.20 to $1.98
- SOL may enter a consolidation phase, with expected prices ranging from $94.73 to $214.47
- Key drivers: Institutional fund inflows, ETFs, ecosystem development
Long-term Prediction (2030)
- ZBU: Base scenario $1.62 - $2.00 | Optimistic scenario $2.00 - $2.50
- SOL: Base scenario $223.39 - $237.65 | Optimistic scenario $237.65 - $351.72
Disclaimer: The information provided is for informational purposes only and should not be considered as financial advice. Cryptocurrency markets are highly volatile and unpredictable. Always conduct your own research before making any investment decisions.
ZBU:
| 年份 | 预测最高价 | 预测平均价格 | 预测最低价 | 涨跌幅 |
|---|---|---|---|---|
| 2025 | 1.46388 | 1.109 | 0.80957 | 0 |
| 2026 | 1.4408128 | 1.28644 | 0.6560844 | 16 |
| 2027 | 1.97725828 | 1.3636264 | 1.199991232 | 23 |
| 2028 | 1.7205556102 | 1.67044234 | 1.5368069528 | 51 |
| 2029 | 2.305878606136 | 1.6954989751 | 1.458129118586 | 53 |
| 2030 | 2.5008609882725 | 2.000688790618 | 1.62055792040058 | 81 |
SOL:
| 年份 | 预测最高价 | 预测平均价格 | 预测最低价 | 涨跌幅 |
|---|---|---|---|---|
| 2025 | 166.8654 | 142.62 | 94.1292 | 0 |
| 2026 | 202.712937 | 154.7427 | 119.151879 | 8 |
| 2027 | 214.4733822 | 178.7278185 | 94.725743805 | 25 |
| 2028 | 222.1586783955 | 196.60060035 | 157.28048028 | 38 |
| 2029 | 265.9121420033925 | 209.37963937275 | 110.9712088675575 | 47 |
| 2030 | 351.71591821834545 | 237.64589068807125 | 223.387137246786975 | 66 |
IV. Investment Strategy Comparison: ZBU vs SOL
Long-term vs Short-term Investment Strategy
- ZBU: Suitable for investors focused on payment solutions and ecosystem potential
- SOL: Suitable for investors seeking stability and high-performance blockchain applications
Risk Management and Asset Allocation
- Conservative investors: ZBU: 20% vs SOL: 80%
- Aggressive investors: ZBU: 40% vs SOL: 60%
- Hedging tools: Stablecoin allocation, options, cross-currency portfolios
V. Potential Risk Comparison
Market Risk
- ZBU: Higher volatility due to lower market cap and trading volume
- SOL: Susceptible to broader crypto market trends and sentiment shifts
Technical Risk
- ZBU: Scalability, network stability
- SOL: Centralization concerns, potential security vulnerabilities
Regulatory Risk
- Global regulatory policies may have different impacts on both assets
VI. Conclusion: Which Is the Better Buy?
📌 Investment Value Summary:
- ZBU advantages: Deflationary model, focus on telecom industry solutions
- SOL advantages: Established ecosystem, high performance, institutional adoption
✅ Investment Advice:
- New investors: Consider a small allocation to SOL as part of a diversified portfolio
- Experienced investors: Balanced approach with both ZBU and SOL based on risk tolerance
- Institutional investors: SOL may be more suitable due to its established market position and liquidity
⚠️ Risk Warning: Cryptocurrency markets are highly volatile. This article does not constitute investment advice. None
VII. FAQ
Q1: What are the main differences between ZBU and SOL? A: ZBU focuses on building a Web3 Neobank for telecoms with a deflationary model, while SOL is a high-performance blockchain protocol with an inflationary tokenomics model. SOL has a more established ecosystem and higher institutional adoption, whereas ZBU is positioning itself for enterprise payment and settlement systems.
Q2: Which cryptocurrency has shown better price performance recently? A: SOL has shown more resilience in recent market cycles. As of 2025-11-15, SOL is trading at $142.66, while ZBU is at $1.105. SOL also reached its all-time high of $293.31 in January 2024, demonstrating stronger price performance compared to ZBU.
Q3: How do the supply mechanisms of ZBU and SOL differ? A: ZBU has a limited total supply of 10 million tokens with a deflationary model featuring token burns from transaction fees. SOL, on the other hand, has an inflationary tokenomics model with an initial annual inflation of 8%, gradually decreasing to a long-term stable rate of 1.5%.
Q4: What are the long-term price predictions for ZBU and SOL by 2030? A: For ZBU, the base scenario predicts a range of $1.62 - $2.00, with an optimistic scenario of $2.00 - $2.50. For SOL, the base scenario predicts a range of $223.39 - $237.65, with an optimistic scenario of $237.65 - $351.72.
Q5: How should investors allocate their portfolio between ZBU and SOL? A: Conservative investors might consider allocating 20% to ZBU and 80% to SOL, while aggressive investors might opt for 40% ZBU and 60% SOL. The exact allocation should be based on individual risk tolerance and investment goals.
Q6: What are the main risks associated with investing in ZBU and SOL? A: ZBU faces higher volatility due to lower market cap and trading volume, as well as potential scalability and network stability issues. SOL is susceptible to broader crypto market trends and has centralization concerns. Both assets may be impacted by global regulatory policies.
Q7: Which cryptocurrency might be more suitable for institutional investors? A: SOL may be more suitable for institutional investors due to its established market position, higher liquidity, and greater institutional adoption. It has attracted investments from notable firms such as Alameda Research, Multicoin Capital, and FTX Ventures.
Share
Content
Introduction: ZBU vs SOL Investment Comparison
I. Price History Comparison and Current Market Status
II. Core Factors Impacting ZBU vs SOL Investment Value
III. 2025-2030 Price Prediction: ZBU vs SOL
IV. Investment Strategy Comparison: ZBU vs SOL
V. Potential Risk Comparison
VI. Conclusion: Which Is the Better Buy?
VII. FAQ

