ZIL vs ENJ: Comparing Two Blockchain Gaming Platforms for Developers and Players
Introduction: ZIL vs ENJ Investment Comparison
In the cryptocurrency market, the comparison between Zilliqa (ZIL) and Enjin Coin (ENJ) has always been a topic that investors can't avoid. The two not only have significant differences in market cap ranking, application scenarios, and price performance, but also represent different positioning in crypto assets.
Zilliqa (ZIL): Since its launch in 2018, it has gained market recognition for its high-throughput public blockchain platform aimed at solving transaction speed and scalability issues.
Enjin Coin (ENJ): Introduced in 2017, it has been hailed as a leading platform for online gaming communities, focusing on virtual goods and blockchain integration for games and communities.
This article will comprehensively analyze the investment value comparison between ZIL and ENJ, focusing on historical price trends, supply mechanisms, institutional adoption, technological ecosystems, and future predictions, attempting to answer the question investors care about most:
"Which is the better buy right now?"
I. Price History Comparison and Current Market Status
ZIL and ENJ Historical Price Trends
- 2021: ZIL reached its all-time high of $0.255376 on May 7, 2021.
- 2021: ENJ hit its all-time high of $4.82 on November 25, 2021.
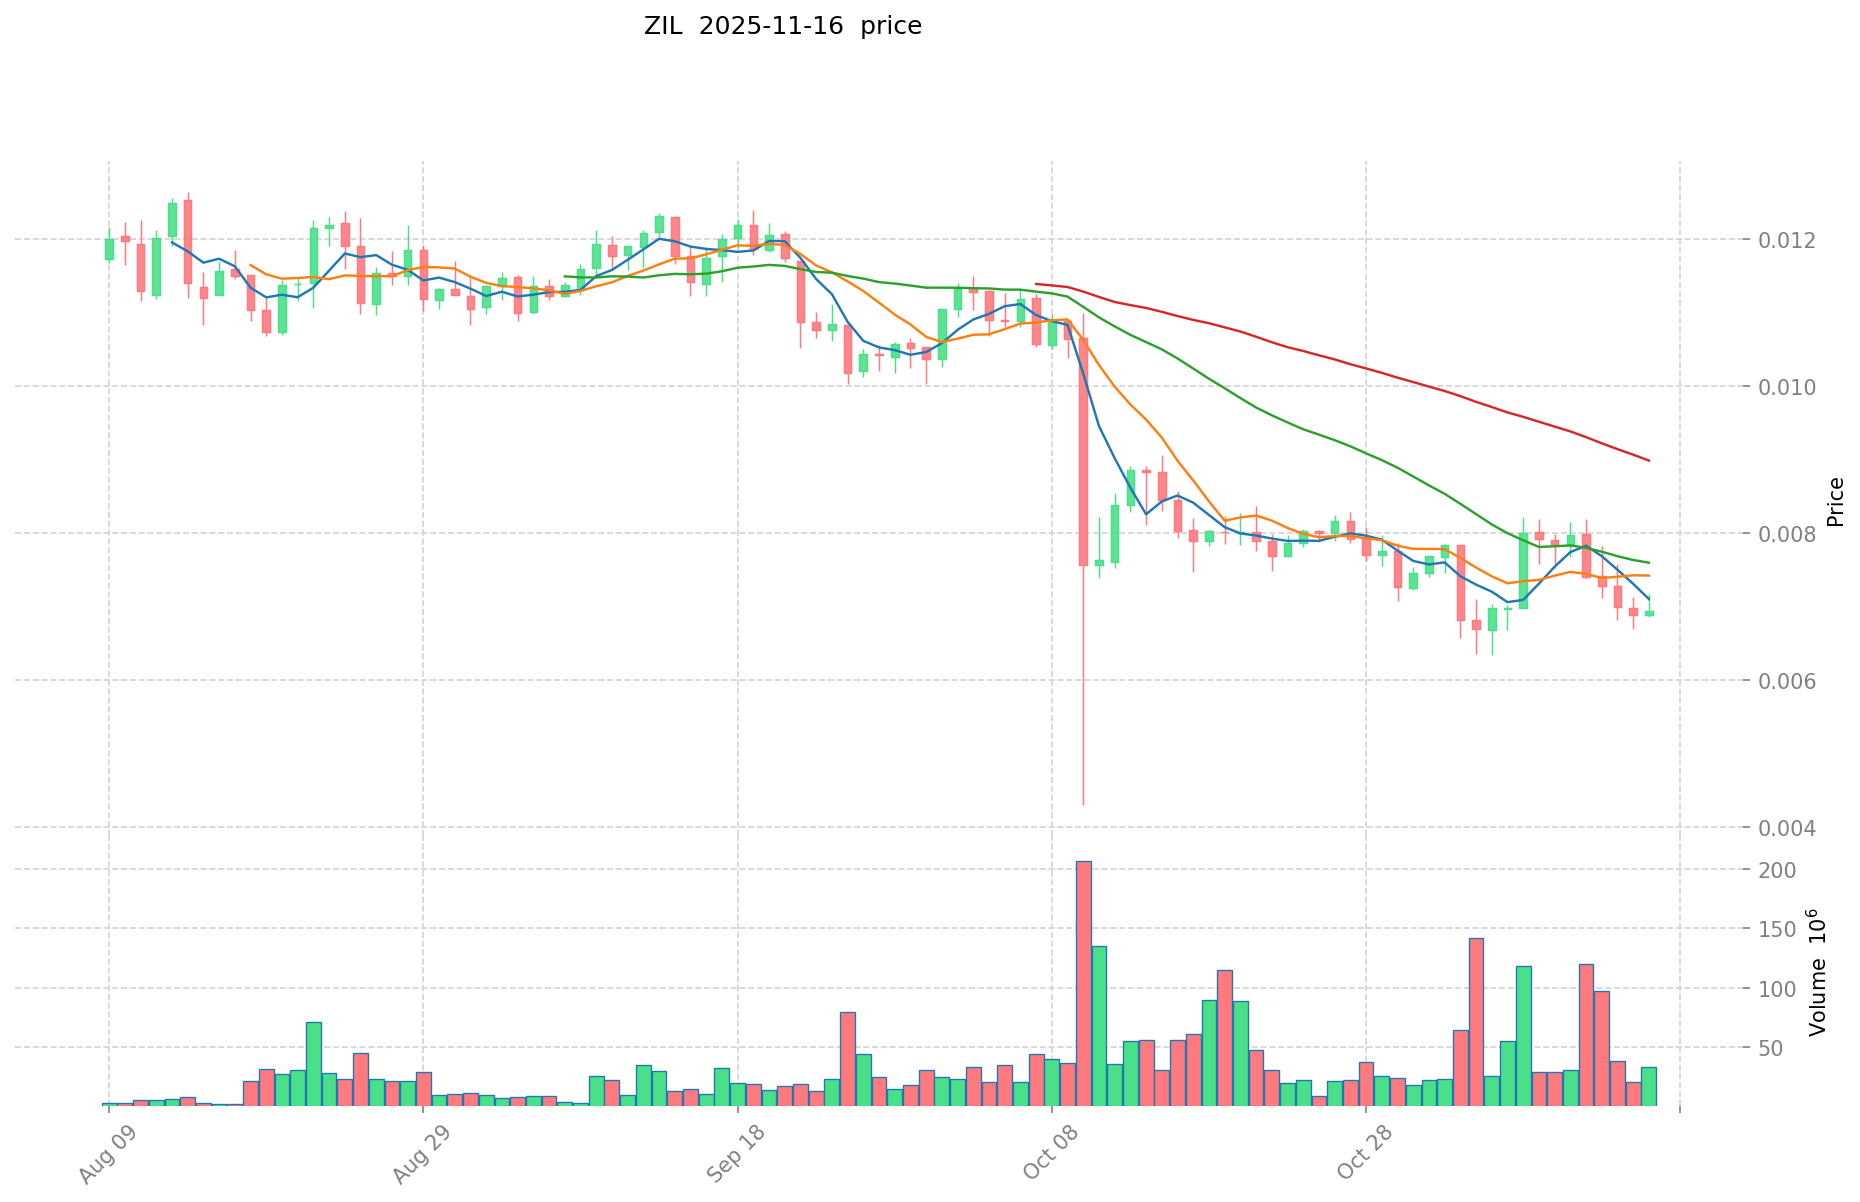
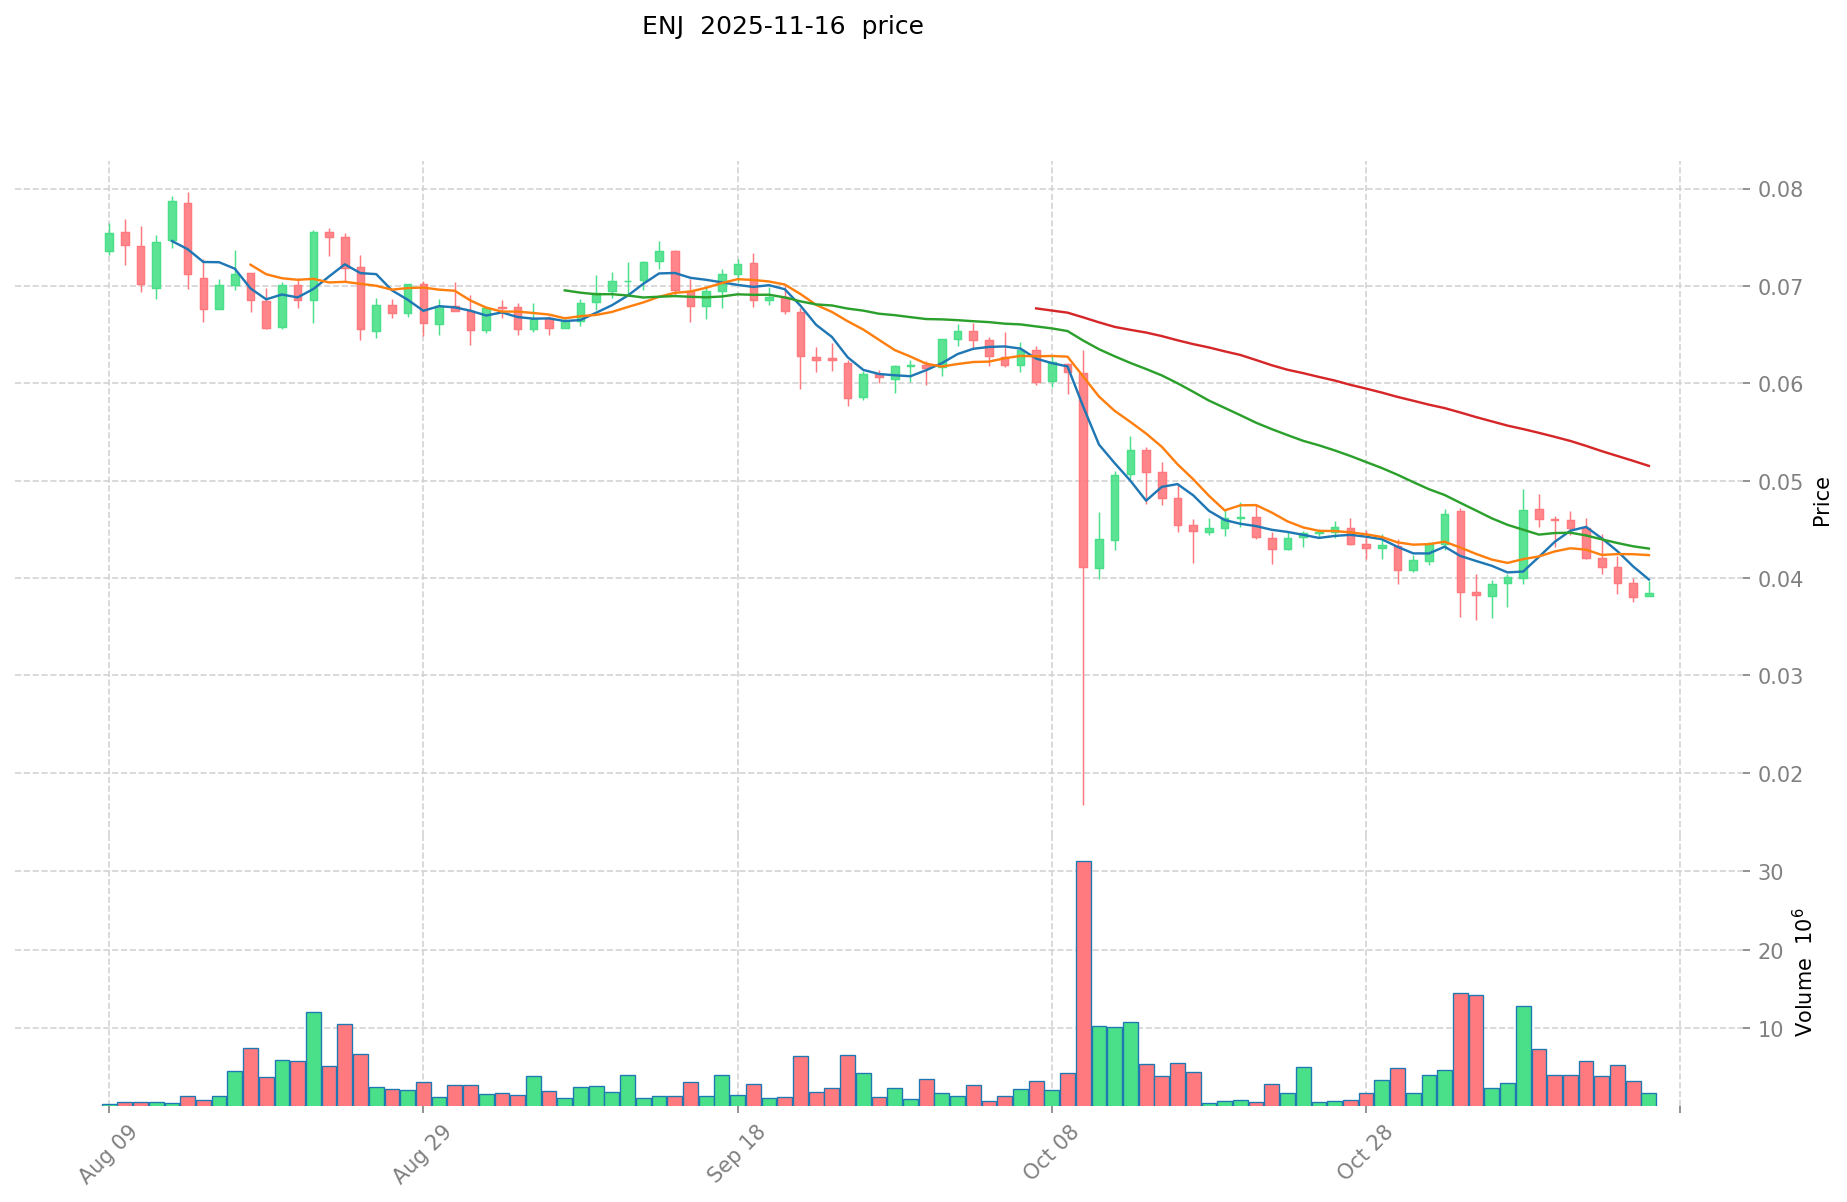
- Comparative analysis: During the market cycle, ZIL dropped from its high of $0.255376 to a current price of $0.006995, while ENJ fell from $4.82 to $0.0384.
Current Market Situation (2025-11-16)
- ZIL current price: $0.006995
- ENJ current price: $0.0384
- 24-hour trading volume: ZIL $236,568.18 vs ENJ $90,991.70
- Market Sentiment Index (Fear & Greed Index): 10 (Extreme Fear)
Click to view real-time prices:
- View ZIL current price Market Price
- View ENJ current price Market Price
II. Core Factors Affecting Investment Value of ZIL vs ENJ
Supply Mechanism Comparison (Tokenomics)
- ZIL: Maximum supply capped at 21 billion ZIL tokens with deflationary mechanism through transaction fee burning
- ENJ: Maximum supply of 1 billion ENJ tokens with deflationary model as tokens get locked in digital assets
- 📌 Historical Pattern: Deflationary tokenomics of both coins have historically supported price stability during market downturns, with ENJ's lower supply cap potentially creating stronger scarcity value.
Institutional Adoption and Market Applications
- Institutional Holdings: ENJ has attracted more institutional interest due to its NFT ecosystem focus and gaming partnerships
- Enterprise Adoption: ZIL focuses on enterprise blockchain solutions and scalability, while ENJ specializes in gaming and NFT infrastructure
- Regulatory Attitudes: Both tokens face varied regulatory treatment across jurisdictions, with gaming-focused tokens like ENJ generally receiving clearer regulatory frameworks than general-purpose blockchains
Technological Development and Ecosystem Building
- ZIL Technical Upgrades: Zilliqa's sharding technology enables high transaction throughput, with recent focus on ZilBridge for cross-chain interoperability
- ENJ Technical Development: Enjin's NFT and gaming infrastructure continues expanding with Efinity parachain on Polkadot for improved scalability
- Ecosystem Comparison: ENJ leads in gaming and NFT applications with concrete use cases, while ZIL offers broader smart contract functionality but with less specialized adoption
Macroeconomic Factors and Market Cycles
- Performance During Inflation: Both assets have struggled during high inflation periods, though ENJ's connection to digital asset ownership provides some inflation hedge characteristics
- Macroeconomic Monetary Policy: Interest rate hikes have historically pressured both assets, with smaller market cap ENJ showing higher volatility to policy changes
- Geopolitical Factors: Cross-border gaming and NFT markets favor ENJ in scenarios where digital ownership transcends geographic boundaries
III. 2025-2030 Price Prediction: ZIL vs ENJ
Short-term Prediction (2025)
- ZIL: Conservative $0.00449472 - $0.007023 | Optimistic $0.007023 - $0.00779553
- ENJ: Conservative $0.03311 - $0.0385 | Optimistic $0.0385 - $0.04389
Mid-term Prediction (2027)
- ZIL may enter a growth phase, with an estimated price range of $0.00777972825 - $0.01120280868
- ENJ may enter a bullish market, with an estimated price range of $0.042397894 - $0.05363589
- Key drivers: Institutional capital inflow, ETF developments, ecosystem growth
Long-term Prediction (2030)
- ZIL: Base scenario $0.012826500203601 - $0.014643128987802 | Optimistic scenario $0.014643128987802 - $0.016289655258573
- ENJ: Base scenario $0.068328292725 - $0.07592032525 | Optimistic scenario $0.07592032525 - $0.07721097077925
Disclaimer: The above predictions are based on historical data and market analysis. Cryptocurrency markets are highly volatile and subject to change. This information should not be considered as financial advice.
ZIL:
| 年份 | 预测最高价 | 预测平均价格 | 预测最低价 | 涨跌幅 |
|---|---|---|---|---|
| 2025 | 0.00779553 | 0.007023 | 0.00449472 | 0 |
| 2026 | 0.0081501915 | 0.007409265 | 0.0051864855 | 5 |
| 2027 | 0.01120280868 | 0.00777972825 | 0.0066127690125 | 11 |
| 2028 | 0.0125284743738 | 0.009491268465 | 0.0072133640334 | 35 |
| 2029 | 0.014643128987802 | 0.0110098714194 | 0.009248291992296 | 57 |
| 2030 | 0.016289655258573 | 0.012826500203601 | 0.010517730166952 | 83 |
ENJ:
| 年份 | 预测最高价 | 预测平均价格 | 预测最低价 | 涨跌幅 |
|---|---|---|---|---|
| 2025 | 0.04389 | 0.0385 | 0.03311 | 0 |
| 2026 | 0.0609686 | 0.041195 | 0.0337799 | 7 |
| 2027 | 0.05363589 | 0.0510818 | 0.042397894 | 33 |
| 2028 | 0.0691136754 | 0.052358845 | 0.04764654895 | 36 |
| 2029 | 0.07592032525 | 0.0607362602 | 0.05162582117 | 58 |
| 2030 | 0.07721097077925 | 0.068328292725 | 0.06491187808875 | 77 |
IV. Investment Strategy Comparison: ZIL vs ENJ
Long-term vs Short-term Investment Strategies
- ZIL: Suitable for investors focused on scalability solutions and enterprise blockchain adoption
- ENJ: Suitable for investors interested in gaming, NFTs, and digital asset ecosystems
Risk Management and Asset Allocation
- Conservative investors: ZIL: 30% vs ENJ: 70%
- Aggressive investors: ZIL: 60% vs ENJ: 40%
- Hedging tools: Stablecoin allocation, options, cross-currency portfolios
V. Potential Risk Comparison
Market Risks
- ZIL: Higher volatility due to lower market cap and trading volume
- ENJ: Exposure to gaming industry fluctuations and NFT market trends
Technical Risks
- ZIL: Scalability challenges, network stability
- ENJ: Smart contract vulnerabilities, ecosystem dependencies
Regulatory Risks
- Global regulatory policies may impact both differently, with ENJ potentially facing more scrutiny in gaming-related regulations
VI. Conclusion: Which Is the Better Buy?
📌 Investment Value Summary:
- ZIL advantages: High-throughput blockchain, enterprise solutions focus
- ENJ advantages: Strong positioning in gaming and NFT markets, lower token supply
✅ Investment Advice:
- New investors: Consider a balanced approach with higher allocation to ENJ due to its more established use cases
- Experienced investors: Explore ZIL for its potential in enterprise blockchain solutions while maintaining exposure to ENJ
- Institutional investors: Evaluate both for different portfolio needs - ZIL for blockchain infrastructure plays, ENJ for digital asset and gaming sector exposure
⚠️ Risk Warning: Cryptocurrency markets are highly volatile. This article does not constitute investment advice. None
VII. FAQ
Q1: What are the main differences between ZIL and ENJ? A: ZIL focuses on high-throughput blockchain solutions for enterprises, while ENJ specializes in gaming and NFT infrastructure. ZIL has a maximum supply of 21 billion tokens, whereas ENJ has a lower cap of 1 billion tokens.
Q2: Which coin has performed better historically? A: ENJ reached a higher all-time high of $4.82 in November 2021, compared to ZIL's peak of $0.255376 in May 2021. However, both have experienced significant drops since their peaks.
Q3: How do their current market situations compare? A: As of 2025-11-16, ZIL is priced at $0.006995 with a 24-hour trading volume of $236,568.18, while ENJ is at $0.0384 with a trading volume of $90,991.70.
Q4: What are the key factors affecting the investment value of ZIL and ENJ? A: Key factors include their supply mechanisms, institutional adoption, technological development, ecosystem building, and macroeconomic factors such as inflation and monetary policy.
Q5: What are the long-term price predictions for ZIL and ENJ? A: By 2030, ZIL is predicted to reach $0.012826500203601 - $0.016289655258573, while ENJ is expected to be in the range of $0.068328292725 - $0.07721097077925.
Q6: How should investors allocate their assets between ZIL and ENJ? A: Conservative investors might consider 30% ZIL and 70% ENJ, while aggressive investors could opt for 60% ZIL and 40% ENJ. This should be adjusted based on individual risk tolerance and market conditions.
Q7: What are the main risks associated with investing in ZIL and ENJ? A: Both face market risks due to volatility, technical risks related to their blockchain infrastructure, and regulatory risks. ZIL may have higher volatility due to its lower market cap, while ENJ is exposed to fluctuations in the gaming and NFT markets.
Share
Content
Introduction: ZIL vs ENJ Investment Comparison
I. Price History Comparison and Current Market Status
II. Core Factors Affecting Investment Value of ZIL vs ENJ
III. 2025-2030 Price Prediction: ZIL vs ENJ
IV. Investment Strategy Comparison: ZIL vs ENJ
V. Potential Risk Comparison
VI. Conclusion: Which Is the Better Buy?
VII. FAQ

