2025 EWT Price Prediction: Expert Analysis and Future Market Outlook for Energy Web Token


Introduction: Market Position and Investment Value of EWT
Energy Web Token (EWT) serves as the native utility token of Energy Web Chain, a verified public blockchain supported by a network of validators comprised of major companies in the licensed energy sector. Since its inception, EWT has established itself as a critical infrastructure asset in the renewable energy and grid modernization ecosystem. As of December 18, 2025, EWT maintains a market capitalization of approximately $59.88 million with a circulating supply of 83.65 million tokens, trading at $0.7159 per unit. This innovative token represents what many industry observers describe as "the bridge between blockchain technology and global energy transition," playing an increasingly vital role in securing distributed energy networks and incentivizing validator participation through transaction fees and verification rewards.
This comprehensive analysis will examine EWT's price trajectory through 2030, integrating historical market patterns, supply-demand dynamics, ecosystem development, and macroeconomic factors to deliver professional price forecasting and actionable investment guidance for stakeholders seeking exposure to the energy Web3 sector. The analysis incorporates real-time market data accessible through platforms such as Gate.com, providing investors with data-driven insights for informed decision-making in this emerging market segment.
I. EWT Price History Review and Current Market Status
EWT Current Market Posture
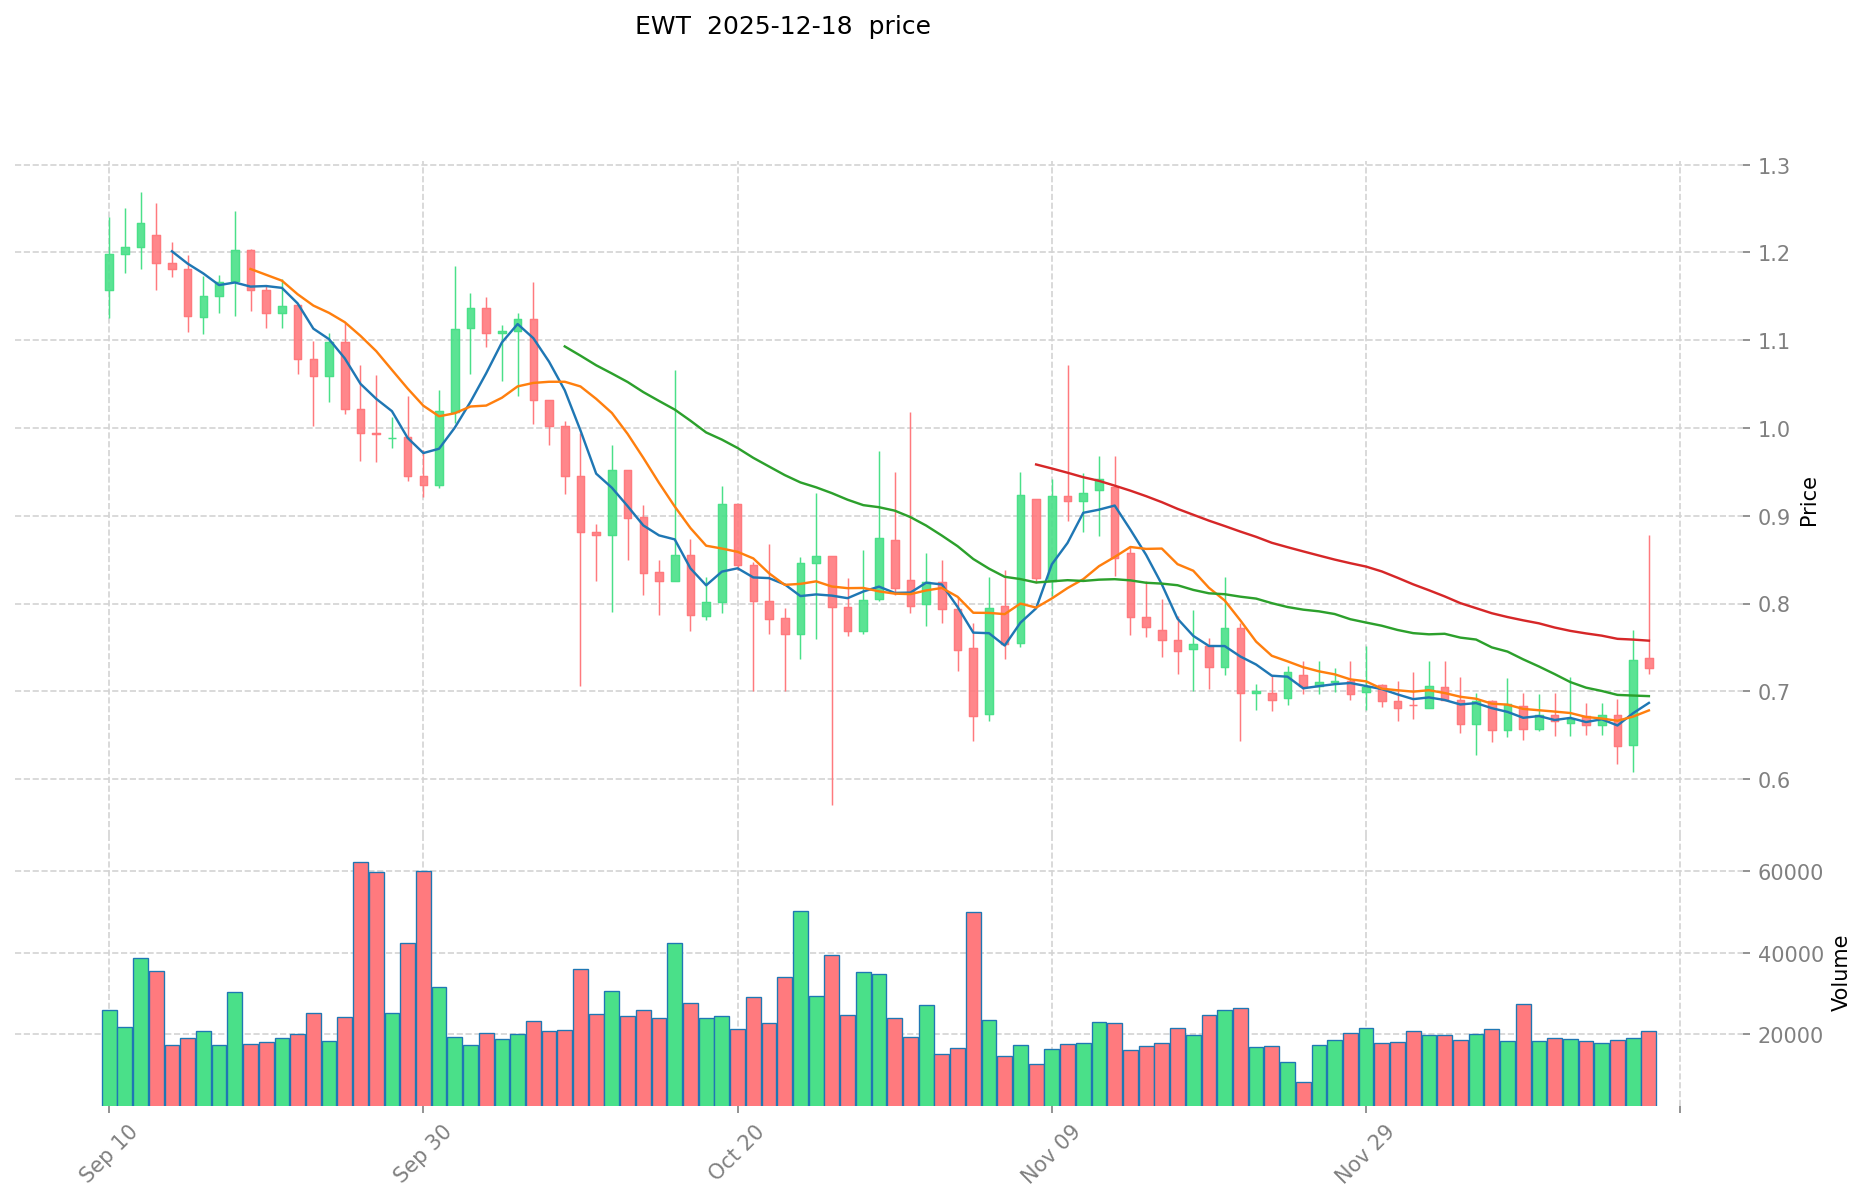
Energy Web Token (EWT) is currently trading at $0.7159 as of December 18, 2025. The token has experienced notable price volatility across different timeframes:
Recent Price Performance:
- 1-Hour Change: -1.42%, with a price decline of $0.0103
- 24-Hour Change: -1.00%, with a price decrease of $0.0072
- 7-Day Change: +9.07%, demonstrating a week-long recovery trend
- 30-Day Change: -2.38%, indicating slight downward pressure over the month
- 1-Year Change: -57.41%, reflecting significant long-term depreciation of $0.9650
Market Capitalization and Supply Metrics: EWT maintains a market capitalization of approximately $59.88 million with a fully diluted valuation of $59.61 million. The circulating supply stands at 83,645,644.69 EWT tokens out of a total supply of 83,261,434.26 tokens, with an unlimited maximum supply. The token currently ranks 456 in the global cryptocurrency market by market capitalization, representing 0.0019% of the total crypto market.
Trading Activity: The 24-hour trading volume for EWT is $15,965.90, reflecting moderate liquidity. The token trades within a 24-hour price range of $0.7197 (low) to $0.878 (high), indicating a trading band of approximately 21.8% over the daily period.
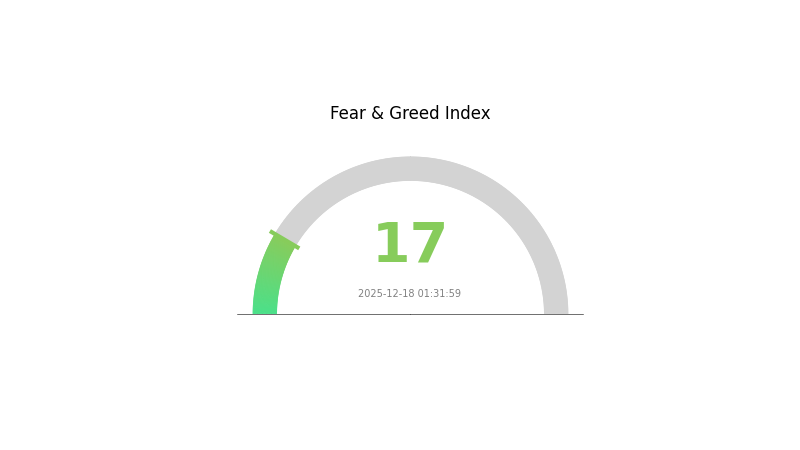
Market Sentiment: Current market conditions reflect extreme fear, with a VIX reading of 17, suggesting heightened market uncertainty and volatility in the broader cryptocurrency ecosystem.
Click to view current EWT market price
EWT Market Sentiment Index
2025-12-18 Fear and Greed Index: 17 (Extreme Fear)
Click to view the current Fear & Greed Index
The cryptocurrency market is currently experiencing extreme fear, with the Fear and Greed Index plummeting to 17. This exceptionally low reading reflects heightened market anxiety and widespread pessimism among investors. During such periods of extreme fear, market volatility typically intensifies, and selling pressure dominates. However, contrarian investors often view extreme fear as potential buying opportunities, as assets may be undervalued. It's crucial to maintain a rational investment strategy and avoid making impulsive decisions driven by emotion. Monitor market developments closely on Gate.com to identify emerging opportunities.
EWT Holdings Distribution
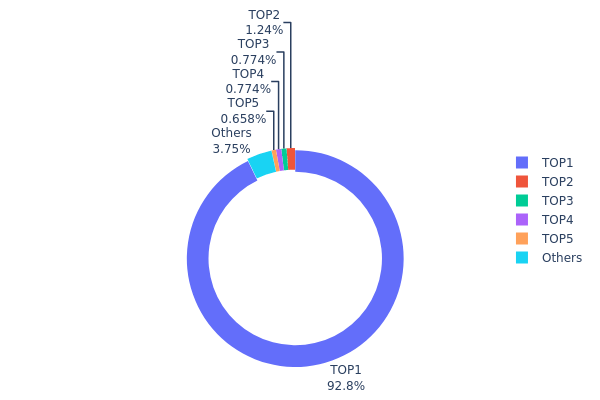
The address holdings distribution provides a comprehensive view of how EWT tokens are allocated across blockchain addresses, serving as a critical indicator of token concentration, market structure health, and potential systemic risks. By analyzing the proportion of tokens held by top addresses relative to total supply, this metric reveals the degree of decentralization and the vulnerability of the asset to potential manipulation or sudden liquidity events.
EWT exhibits a notably pronounced concentration pattern, with the top address commanding 92.81% of the total supply, representing approximately 77.81 million tokens. This extreme concentration level significantly exceeds healthy decentralization thresholds and indicates a highly centralized token distribution structure. The subsequent top four addresses collectively hold only 3.42% of the circulating supply, while all remaining addresses account for merely 3.77%, further emphasizing the dominance of the primary holder and the sharp disparity in token distribution across the network.
This concentration profile presents considerable implications for market dynamics and ecosystem stability. The overwhelming majority stake held by a single address creates substantial vulnerability to price volatility, as any transaction or transfer decision by this holder could trigger significant market movements. Moreover, such extreme concentration raises concerns regarding governance decentralization, fair market participation, and the potential for coordinated market movements. The structural imbalance suggests limited distribution among retail participants and highlights the necessity for sustained distribution efforts to improve token decentralization and enhance the resilience of the underlying market infrastructure over time.
Click to view current EWT Holdings Distribution
| Top | Address | Holding Qty | Holding (%) |
|---|---|---|---|
| 1 | 0x5dde...f0259d | 77811.39K | 92.81% |
| 2 | 0x0d07...b492fe | 1036.01K | 1.23% |
| 3 | 0x69be...6ee5e0 | 648.67K | 0.77% |
| 4 | 0x2677...ccb975 | 648.67K | 0.77% |
| 5 | 0x9642...2f5d4e | 551.86K | 0.65% |
| - | Others | 3141.35K | 3.77% |
II. Core Factors Influencing EWT's Future Price
Macroeconomic Environment
-
Monetary Policy Impact: Major central banks, particularly the Federal Reserve, make interest rate decisions that have a significant impact on EWT's price. When interest rates decline, capital may flow back into alternative assets, potentially supporting EWT valuations. Conversely, rate hikes can divert capital away from crypto assets.
-
Inflation Hedge Properties: EWT's performance in inflationary environments reflects its positioning within the broader crypto market, where digital assets are sometimes perceived as potential inflation hedges alongside traditional alternatives.
-
Geopolitical Factors: International market conditions and policy uncertainties influence broader market sentiment, which in turn affects cryptocurrency price movements including EWT.
III. EWT Price Forecast 2025-2030
2025 Outlook
- Conservative Forecast: $0.3651 - $0.5906
- Neutral Forecast: $0.7159
- Bearish Scenario: Decline to $0.3651 (Market correction phase)
2026-2027 Mid-term Perspective
- Market Stage Expectation: Stabilization and gradual recovery phase with increased adoption
- Price Range Forecast:
- 2026: $0.6052 - $0.8120 (5% upside potential)
- 2027: $0.4497 - $1.0336 (8% growth trajectory)
- Key Catalysts: Ecosystem expansion, institutional interest, protocol upgrades, market sentiment recovery
2028-2030 Long-term Outlook
- Base Case: $0.7199 - $1.3031 (25% growth by 2028, assuming steady adoption and market stabilization)
- Optimistic Scenario: $1.1200 - $1.5280 (52-81% cumulative gains by 2029-2030, contingent on mainstream adoption and positive regulatory developments)
- Transformational Scenario: $1.5284+ (81% growth potential by 2030, assuming breakthrough utility integration and ecosystem maturation)
- December 18, 2025: EWT trading at current market levels (Consolidation and preparation phase for next growth cycle)
Note: These forecasts represent analytical projections based on historical data patterns and should be considered alongside fundamental analysis before making investment decisions on platforms like Gate.com.
| 年份 | 预测最高价 | 预测平均价格 | 预测最低价 | 涨跌幅 |
|---|---|---|---|---|
| 2025 | 0.81613 | 0.7159 | 0.36511 | -1 |
| 2026 | 0.81197 | 0.76601 | 0.60515 | 5 |
| 2027 | 1.03358 | 0.78899 | 0.44973 | 8 |
| 2028 | 1.30314 | 0.91129 | 0.71992 | 25 |
| 2029 | 1.52796 | 1.10721 | 0.77505 | 52 |
| 2030 | 1.5284 | 1.31758 | 1.11995 | 81 |
Energy Web Token (EWT) Professional Investment Strategy and Risk Management Report
IV. EWT Professional Investment Strategy and Risk Management
EWT Investment Methodology
(1) Long-term Holding Strategy
- Target Audience: Investors with strong conviction in renewable energy infrastructure and blockchain adoption in the energy sector; institutional investors seeking ESG-aligned exposure
- Operational Recommendations:
- Accumulate EWT during market downturns when price volatility creates buying opportunities, particularly targeting positions below the 200-day moving average
- Implement dollar-cost averaging (DCA) to reduce timing risk, allocating fixed capital amounts at regular intervals (weekly or monthly) regardless of price fluctuations
- Utilize Gate.com's spot trading features to establish and manage your core holding position with minimal trading fees
(2) Active Trading Strategy
-
Technical Analysis Tools:
- Moving Average Convergence Divergence (MACD): Use MACD crossovers to identify momentum shifts; buy signals occur when the MACD line crosses above the signal line, while sell signals emerge on crossovers below
- Relative Strength Index (RSI): Monitor RSI levels below 30 for oversold conditions indicating potential reversal points; conversely, RSI above 70 suggests overbought territory where profit-taking becomes prudent
-
Wave Trading Key Points:
- Establish entry positions near identified support levels (0.7197 as recent 24-hour low) with stop-loss orders positioned 5-8% below support
- Take partial profits at resistance levels identified through technical analysis, with remaining positions trailing stop-losses to capture extended uptrends
EWT Risk Management Framework
(1) Asset Allocation Principles
- Conservative Investors: Allocate 0-2% of total portfolio to EWT, positioning this as a speculative long-term bet on energy sector digitalization
- Aggressive Investors: Allocate 3-7% of total portfolio to EWT, allowing for more dynamic position sizing and tactical adjustments
- Professional Investors: Allocate 2-5% of total portfolio to EWT as part of diversified blockchain infrastructure exposure, with systematic rebalancing protocols
(2) Risk Hedging Strategies
- Stablecoin Reserve Maintenance: Keep 20-30% of allocated capital in USDT or USDC on Gate.com to enable rapid deployment during price corrections or to lock in profits during rallies
- Position Sizing with Stop-Loss Discipline: Implement strict stop-loss orders at 10-15% below entry prices to contain downside exposure; use Gate.com's conditional orders to automate this process
(3) Secure Storage Solutions
- Hot Wallet Strategy: Gate.com Web3 wallet recommended for active traders requiring frequent transactions with moderate holdings; provides institutional-grade security with user-friendly interface
- Cold Storage Approach: For long-term holders with substantial positions, transfer tokens to self-custody solutions after purchase on Gate.com; maintain secure backups of private keys in geographically distributed locations
- Security Considerations: Never share private keys or seed phrases; enable two-factor authentication on all exchange accounts; verify contract addresses before token transfers to prevent phishing attacks
V. EWT Potential Risks and Challenges
EWT Market Risks
- Liquidity Risk: With 24-hour trading volume of approximately $15,965 and a market cap of $59.6 million, EWT exhibits relatively modest liquidity compared to major Layer 1 tokens; large transactions may experience significant slippage
- Volatility Exposure: Historical volatility patterns show 1-year price decline of -57.41%, indicating substantial downside risk despite 7-day gains of 9.07%; investors should prepare for potential 30-50% drawdowns
- Market Sentiment Dependency: As a mid-cap asset with limited institutional adoption, EWT price movements remain heavily influenced by broader crypto market sentiment and renewable energy sector momentum
EWT Regulatory Risks
- Energy Sector Regulation Uncertainty: Different jurisdictions implement varying regulatory frameworks for renewable energy and carbon credit tokenization; changes in energy policy could impact EWT utility value
- Classification Risk: Regulatory bodies may reclassify EWT or the Energy Web Chain as a security rather than utility token, triggering potential delisting from certain exchanges and compliance requirements
- Compliance Evolution: Emerging regulations regarding environmental claims and ESG compliance could create operational constraints for Energy Web Chain validators or token holders
EWT Technical Risks
- Validator Network Concentration: The permissioned validator structure, while providing security guarantees, creates centralization risks; validator set changes or consensus failures could undermine network reliability
- Cross-Chain Interoperability: Technical challenges in bridging EWT across multiple blockchains may limit adoption and create liquidity fragmentation across different chain implementations
- Smart Contract Vulnerability: Despite established operations, unforeseen technical vulnerabilities in the Energy Web Chain infrastructure could result in network disruptions or token value impairment
VI. Conclusion and Action Recommendations
EWT Investment Value Assessment
Energy Web Token represents a differentiated exposure to the intersection of blockchain technology and renewable energy infrastructure. The project's positioning within the energy sector—supported by major industry participants through the permissioned validator network—provides fundamental differentiation. However, the 57.41% year-over-year decline reflects market challenges in token-based environmental initiatives, limited retail adoption, and broader cryptocurrency volatility. The current market cap of $59.6 million indicates meaningful room for growth if the Energy Web Chain achieves increased adoption among enterprise energy stakeholders, though execution risks remain substantial.
EWT Investment Recommendations
✅ Beginners: Allocate a small exploratory position (0.5-1% of total crypto allocation) through Gate.com's spot trading to gain exposure with limited capital at risk; use this position to develop understanding of the Energy Web ecosystem before scaling commitment
✅ Experienced Investors: Implement a core-satellite strategy with 40% in long-term holdings for conviction exposure and 60% in tactical trading positions; utilize Gate.com's advanced order types for systematic entry and exit execution
✅ Institutional Investors: Evaluate 2-5% allocation within blockchain infrastructure thematic exposure, combining spot accumulation during weakness with direct engagement opportunities with Energy Web validators or ecosystem partners
EWT Trading Participation Methods
- Spot Trading on Gate.com: Execute buy and sell orders on Gate.com's spot market for EWT; access immediate settlement with competitive fees and high liquidity pairs
- Dollar-Cost Averaging Program: Establish automated purchase schedules through Gate.com to accumulate EWT at predetermined intervals, reducing timing risk and emotional decision-making
- Technical Trading Execution: Utilize Gate.com's charting tools and order management systems for swing trading and wave-based position management with real-time monitoring capabilities
Cryptocurrency investment carries extreme risk. This report does not constitute investment advice. Investors should make decisions based on their individual risk tolerance and financial circumstances. It is strongly recommended to consult with professional financial advisors before making investment commitments. Never invest funds you cannot afford to lose entirely.
FAQ
What is the price prediction for EWT crypto in 2030?
Based on current market analysis, EWT crypto price prediction for 2030 ranges from $0.2894 to $0.5376. This forecast reflects expected growth trends in the energy sector and blockchain adoption.
What crypto will 1000x prediction?
Emerging altcoins with strong fundamentals and early-stage pricing show 1000x potential. Bitcoin Hyper and similar projects with innovative use cases and community support are top candidates. However, 1000x gains require careful project analysis and market timing.
How high could etc go?
Ethereum Classic could realistically reach $50-$100 in a strong bull market, with some long-term forecasts suggesting $150 or more during favorable market conditions.
Will TRX reach $1 in 2025?
TRX reaching $1 in 2025 is possible with strong market conditions and increased adoption. Technological advancements and growing institutional interest could support this milestone. However, the outcome remains dependent on overall market dynamics.
Share
Content
Introduction: Market Position and Investment Value of EWT
I. EWT Price History Review and Current Market Status
II. Core Factors Influencing EWT's Future Price
III. EWT Price Forecast 2025-2030
IV. EWT Professional Investment Strategy and Risk Management
V. EWT Potential Risks and Challenges
VI. Conclusion and Action Recommendations
FAQ
How to Buy Cryptocurrency


Trending Cryptocurrencies


XZXX: A Comprehensive Guide to the BRC-20 Meme Token in 2025

Bitcoin Fear and Greed Index: Market Sentiment Analysis for 2025

Top Crypto ETFs to Watch in 2025: Navigating the Digital Asset Boom

5 ways to get Bitcoin for free in 2025: Newbie Guide

Bitcoin Market Cap in 2025: Analysis and Trends for Investors

2025 Bitcoin Price Prediction: Trump's Tariffs' Impact on BTC

Copy Trading Mechanism Guide

Unlock SEI Network Rewards: Step-by-Step Airdrop Participation Guide

Exploring Cryptocurrency within Islamic Finance: Halal or Haram?

Understanding Ethereum Classic's Hard Fork Process

Exploring Reserve Protocol: A Guide to Real-World Stablecoin Integration