Is deBridge (DBR) a good investment?: A Comprehensive Analysis of the Cross-Chain Bridge Protocol's Potential and Risks

Introduction: deBridge (DBR) Investment Position and Market Prospects
DBR is an important asset in the cryptocurrency field. As of December 2025, deBridge has established itself as DeFi's internet of liquidity, enabling real-time movement of assets and information across the DeFi landscape. The project has achieved a market capitalization of $202.4 million with a circulating supply of 1.8 billion tokens, and the current price is maintained at approximately $0.02024. With its positioning as a solution that eliminates liquidity pool bottlenecks and risks while delivering deep liquidity, tight spreads, and guaranteed rates for cross-chain interactions, deBridge has gradually become a focal point when investors discuss "Is deBridge (DBR) a good investment?" This article will comprehensively analyze deBridge's investment value, historical price trends, future price predictions, and investment risks to provide investors with reference insights.
deBridge (DBR) Research Report
I. Price History Review and Current Investment Value Status
DBR Historical Price Trends and Investment Performance
All-Time High and Low Data:
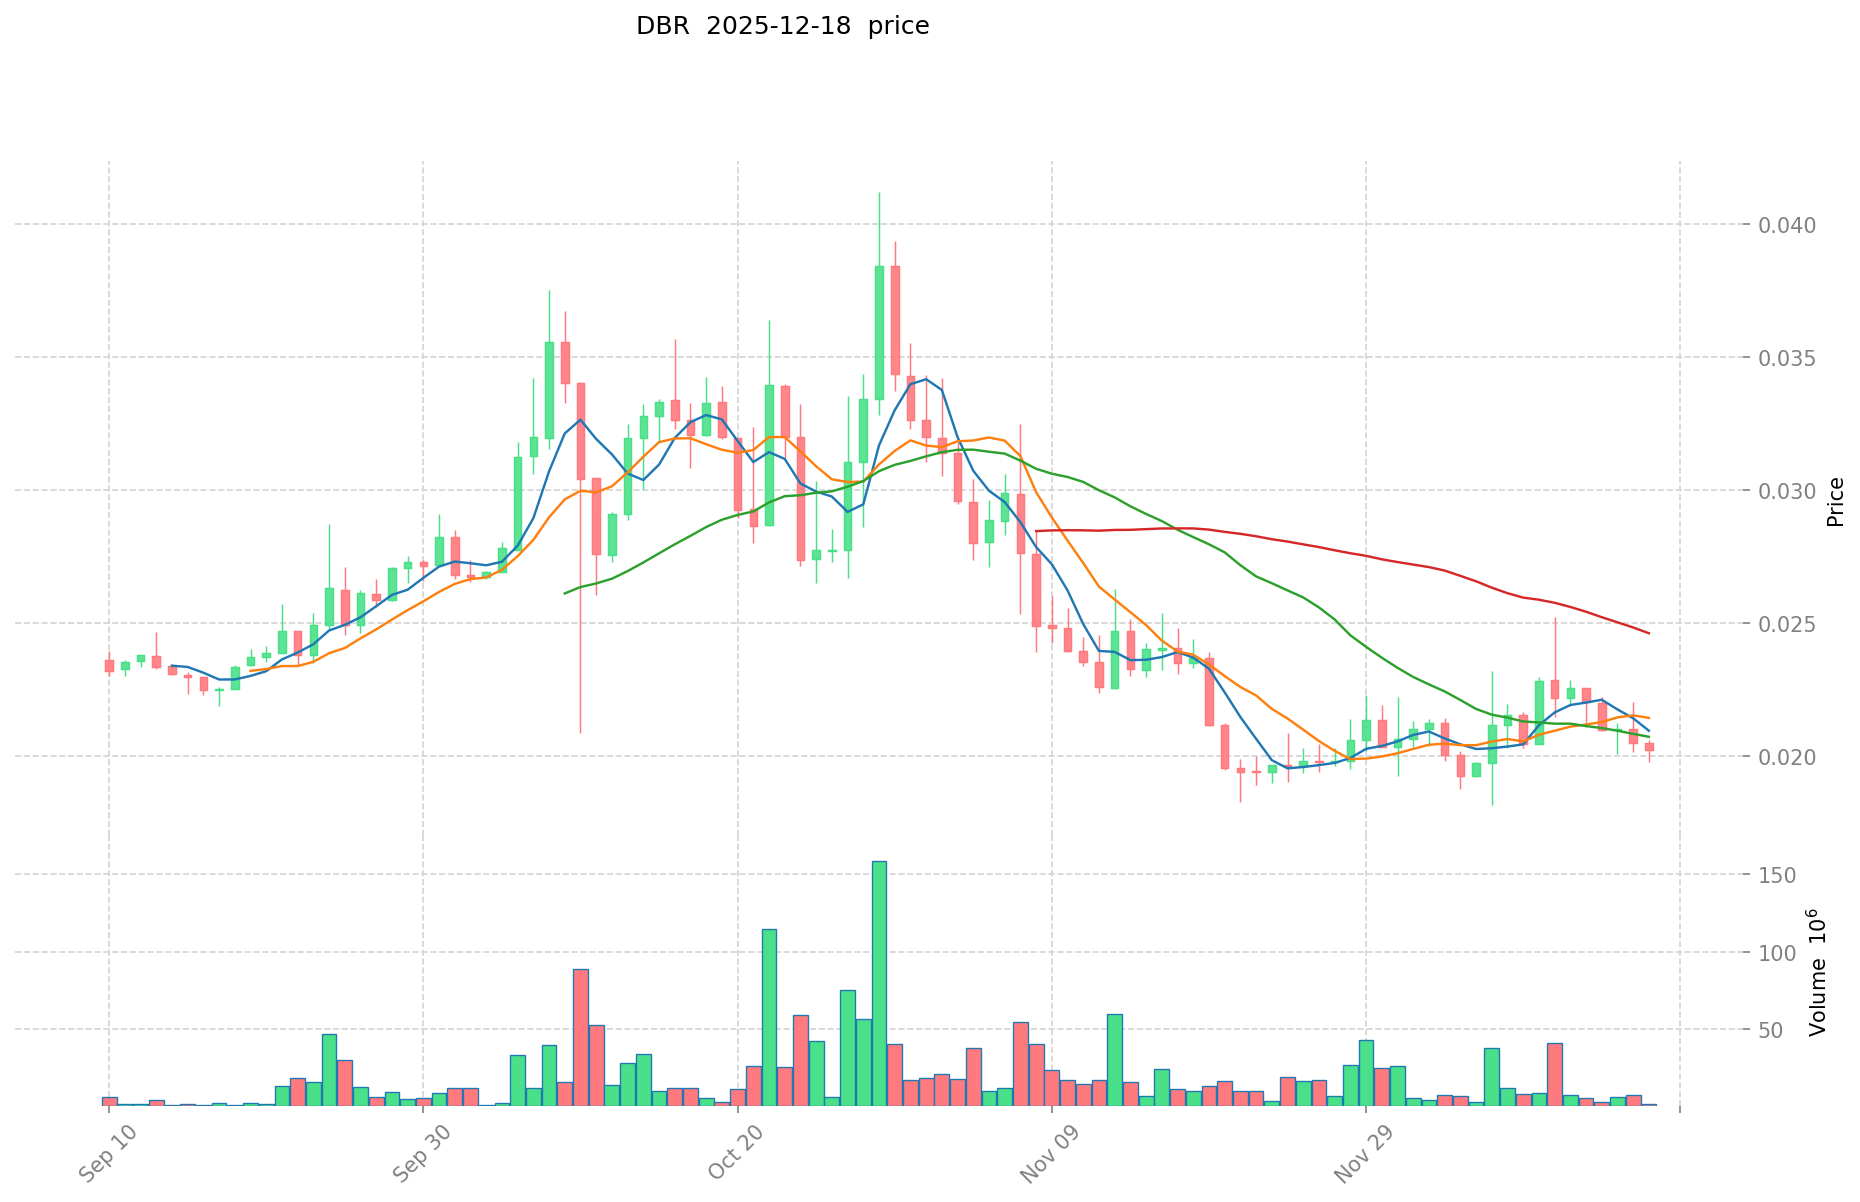
- All-Time High (ATH): $0.05764 on December 22, 2024
- All-Time Low (ATL): $0.005 on October 17, 2024
- ATH to ATL Decline: Approximately 90.33% depreciation from peak to trough
Price Performance Across Multiple Timeframes (as of December 19, 2025):
- 1-Hour Change: -0.49%
- 24-Hour Change: -0.44%
- 7-Day Change: -9.8%
- 30-Day Change: -14.81%
- 1-Year Change: -41.44%
The price data reveals significant volatility since the token's public release on October 17, 2024. DBR experienced rapid appreciation reaching its ATH in late December 2024, followed by a sustained downtrend extending into the current period.
Current DBR Market Status (December 19, 2025)
Key Market Metrics:
- Current Price: $0.02024
- 24-Hour Trading Volume: $40,793.78
- Total Market Capitalization: $202,400,000
- Circulating Supply: 1,800,000,000 DBR
- Total Supply: 10,000,000,000 DBR
- Circulating Supply Ratio: 18.0%
- Market Dominance: 0.0066%
- Number of Holders: 91,422
- Trading Pairs Available: 26 exchanges
24-Hour Price Range:
- High: $0.02087
- Low: $0.01991
Market Sentiment: Neutral (score: 1)
For real-time DBR market price data, visit Gate DBR Price
II. Project Overview and Technical Foundation
Project Introduction
deBridge positions itself as "DeFi's internet of liquidity," enabling real-time movement of assets and information across the decentralized finance landscape. The protocol addresses fundamental infrastructure challenges in cross-chain interactions by eliminating the bottlenecks and risks associated with traditional liquidity pools.
Core Value Proposition:
- Facilitates deep liquidity for cross-chain transactions
- Enables tight bid-ask spreads
- Provides guaranteed rates for cross-chain interactions
- Operates without reliance on centralized liquidity pool constraints
Blockchain Infrastructure
Token Standard: SPL20 (Solana Program Library)
Primary Deployment:
- Chain: Solana (SOL)
- Contract Address: DBRiDgJAMsM95moTzJs7M9LnkGErpbv9v6CUR1DXnUu5
- Explorer: https://explorer.solana.com/account/DBRiDgJAMsM95moTzJs7M9LnkGErpbv9v6CUR1DXnUu5
Token Distribution:
- Max Supply: 10,000,000,000 DBR
- Total Supply: 10,000,000,000 DBR
- Circulating Supply: 1,800,000,000 DBR (18% of total supply)
- Public Release Date: October 17, 2024
- Initial Public Price: $0.03
III. Market Position and Network Activity
Market Ranking: 599th by market capitalization
Community Engagement:
- Active community through official social channels
- Official Website: https://debridge.finance/
- Documentation: https://docs.debridge.finance/
- Social Media: https://x.com/deBridgeFinance
Exchange Distribution: Available on 26 cryptocurrency exchanges, indicating reasonable liquidity accessibility.
IV. Price Volatility Analysis
Recent Price Movements
The token demonstrates substantial price volatility characteristic of early-stage crypto assets:
| Timeframe | Change Percentage | Price Movement |
|---|---|---|
| 1 Hour | -0.49% | -$0.000099664 |
| 24 Hours | -0.44% | -$0.000089450 |
| 7 Days | -9.8% | -$0.002199024 |
| 30 Days | -14.81% | -$0.003518657 |
| 1 Year | -41.44% | -$0.014322842 |
Observation: DBR has experienced consistent downward pressure across all measured timeframes, with accelerating losses over longer periods. The 30-day decline of -14.81% and year-to-date decline of -41.44% reflect significant depreciation from the token's peak valuation established in late December 2024.
V. Valuation Metrics
Market Cap to FDV Ratio: 18%
This metric indicates that the fully diluted valuation substantially exceeds the current market capitalization, suggesting significant potential token dilution as additional tokens enter circulation from the remaining 82% of supply not yet in active circulation.
Fully Diluted Valuation (FDV): $202,400,000
VI. Key Considerations
The significant divergence between current market valuation and historical price peaks, combined with the extended downtrend across all major timeframes, reflects market reassessment of the project's value proposition and competitive positioning within the cross-chain liquidity infrastructure sector. The availability of 82% of total token supply yet to be circulated presents ongoing dilution risks for current holders.
The protocol's focus on Solana ecosystem integration aligns with that blockchain's infrastructure development trajectory, though broader market conditions and competitive developments in cross-chain technology will significantly influence future market dynamics.
deBridge (DBR) Research Report
I. Project Overview
Basic Information
deBridge is positioned as "DeFi's internet of liquidity," enabling real-time movement of assets and information across the DeFi landscape. Without the bottlenecks and risks of liquidity pools, deBridge can power all types of cross-chain interactions with deep liquidity, tight spreads, and guaranteed rates.
Token Specifications
| Metric | Value |
|---|---|
| Token Symbol | DBR |
| Blockchain | Solana (SPL20) |
| Contract Address | DBRiDgJAMsM95moTzJs7M9LnkGErpbv9v6CUR1DXnUu5 |
| Total Supply | 10,000,000,000 |
| Circulating Supply | 1,800,000,000 |
| Circulating Ratio | 18.0% |
| Launch Date | October 17, 2024 |
Market Position
| Metric | Value |
|---|---|
| Current Price (As of Dec 19, 2025) | $0.02024 |
| Market Capitalization | $36,432,000 |
| Fully Diluted Valuation | $202,400,000 |
| Market Rank | 599 |
| 24-Hour Volume | $40,793.78 |
| Active Holders | 91,422 |
| Listed Exchanges | 26 |
II. Core Factors Influencing Whether deBridge (DBR) Is a Good Investment
Supply Mechanism and Scarcity
- Total Supply Structure: With a maximum supply of 10 billion tokens and circulating supply of 1.8 billion (18% circulation ratio), the token maintains a significant unlock schedule that may impact future price dynamics.
- Scarcity Implications: The low circulation ratio relative to total supply indicates potential dilution risk as tokens enter circulation over time, which investors should carefully monitor.
Market Adoption and Network Growth
- Cross-Chain Integration: deBridge processed $1.53B in volume during October 2025, driven by integrations with major blockchain networks including Tron (hosting $82B USDT) and BNB Chain ($1.1B monthly activity).
- Liquidity Infrastructure: The protocol's positioning as a liquidity internet provides foundational infrastructure for DeFi ecosystem expansion, supporting its long-term utility value.
Macroeconomic Context
- Crypto Market Conditions: As of December 2025, broader cryptocurrency market sentiment and liquidity conditions remain key variables affecting cross-chain protocol valuations and investor risk appetite.
III. Price Performance Analysis
Current Price Metrics
| Time Period | Change | Amount |
|---|---|---|
| 1 Hour | -0.49% | -$0.00009966 |
| 24 Hours | -0.44% | -$0.00008945 |
| 7 Days | -9.80% | -$0.00219902 |
| 30 Days | -14.81% | -$0.00351866 |
| 1 Year | -41.44% | -$0.01432284 |
Historical Price Range
- All-Time High: $0.05764 (December 22, 2024)
- All-Time Low: $0.005 (October 17, 2024)
- 24-Hour Range: $0.01991 - $0.02087
- Price Decline from ATH: -64.89%
IV. Investment Outlook and Risk Considerations
Current Market Sentiment
Market analysis indicates generally bearish technical indicators for the short to medium term. Existing price predictions show significant divergence, ranging from pessimistic forecasts around $0.01862 to more optimistic scenarios projecting prices between $0.0414 - $0.0604 by end of 2025.
Key Risk Factors
- High Volatility: The token has experienced substantial price fluctuations since launch, with -41.44% decline over one year reflecting significant market uncertainty.
- Token Dilution Risk: Ongoing release of the 82% of tokens in circulation represents a structural headwind for price appreciation.
- Market Liquidity: Despite 26 exchange listings, relatively modest 24-hour trading volume may indicate limited market depth.
- Competitive Landscape: Cross-chain bridge and liquidity solutions face increasing competition in the DeFi sector.
Investment Considerations
The decision to invest in DBR depends entirely on individual risk tolerance and investment thesis. The token operates in the cross-chain infrastructure segment, which remains foundational to DeFi ecosystem development, yet faces execution risks and market adoption uncertainties.
Data Last Updated: December 19, 2025 Disclaimer: This report presents factual data and market information. It does not constitute investment advice or recommendations.
III. DBR Future Investment Predictions and Price Outlook (Is deBridge(DBR) worth investing in 2025-2030)
Short-term Investment Prediction (2026, short-term DBR investment outlook)
- Conservative forecast: $0.01441 - $0.02255
- Neutral forecast: $0.02287 - $0.03248
- Optimistic forecast: $0.03248 - $0.04000
Mid-term Investment Outlook (2027-2028, mid-term deBridge(DBR) investment forecast)
- Market stage expectation: deBridge enters an accelerated growth phase with increased cross-chain liquidity adoption and expanding DeFi ecosystem integration.
- Investment return predictions:
- 2027: $0.02518 - $0.03625 (estimated gain of 36%)
- 2028: $0.02845 - $0.04411 (estimated gain of 57%)
- Key catalysts: Enhanced protocol adoption, ecosystem partnerships, increased institutional participation in cross-chain solutions, and broader DeFi market expansion.
Long-term Investment Outlook (Is deBridge a good long-term investment?)
- Base scenario: $0.02000 - $0.04000 (assuming steady adoption of cross-chain protocols and stable market conditions)
- Optimistic scenario: $0.04000 - $0.06000 (assuming significant scaling of deBridge infrastructure and mainstream DeFi integration)
- Risk scenario: $0.01000 - $0.02000 (reflecting potential regulatory headwinds and competitive pressures)
For detailed DBR long-term investment and price predictions, please visit: Price Prediction
2025-12-19 to 2030 Long-term Outlook
- Base scenario: $0.03546 - $0.04220 USD (corresponding to steady protocol adoption and mainstream application advancement)
- Optimistic scenario: $0.05320 - $0.06500 USD (corresponding to large-scale adoption and favorable market conditions)
- Transformative scenario: $0.08000 USD and above (if ecosystem achieves breakthrough progress and achieves mainstream adoption)
- 2030-12-31 predicted high point: $0.05320 USD (based on optimistic development assumptions)
Disclaimer: This analysis is based on historical data and market forecasts as of December 19, 2025. Price predictions are speculative in nature and subject to significant market volatility and unforeseen circumstances. Past performance does not guarantee future results. Investors should conduct their own research and consult with financial advisors before making investment decisions. This content does not constitute financial advice.
| 年份 | 预测最高价 | 预测平均价格 | 预测最低价 | 涨跌幅 |
|---|---|---|---|---|
| 2025 | 0.0255024 | 0.02024 | 0.01518 | 0 |
| 2026 | 0.032477104 | 0.0228712 | 0.014408856 | 13 |
| 2027 | 0.03625313912 | 0.027674152 | 0.02518347832 | 36 |
| 2028 | 0.0441098308728 | 0.03196364556 | 0.0284476445484 | 57 |
| 2029 | 0.046404820624008 | 0.0380367382164 | 0.025484614604988 | 87 |
| 2030 | 0.053198182069457 | 0.042220779420204 | 0.035465454712971 | 108 |
deBridge (DBR) Investment Analysis Report
I. Executive Summary
deBridge is a decentralized finance (DeFi) liquidity infrastructure protocol operating on the Solana blockchain. As of December 19, 2025, DBR is trading at $0.02024 with a market capitalization of $36.43 million and a fully diluted valuation of $202.4 million. The token has experienced significant price decline of -41.44% over the past year, reflecting broader market volatility in the DeFi sector.
II. Project Overview
Protocol Definition
deBridge is DeFi's internet of liquidity, enabling real-time movement of assets and information across the DeFi landscape. Without the bottlenecks and risks of liquidity pools, deBridge can power all types of cross-chain interactions with deep liquidity, tight spreads, and guaranteed rates.
Technical Specifications
- Token Standard: SPL20 (Solana Program Library)
- Blockchain: Solana (SOL)
- Contract Address: DBRiDgJAMsM95moTzJs7M9LnkGErpbv9v6CUR1DXnUu5
- Total Supply: 10,000,000,000 DBR
- Circulating Supply: 1,800,000,000 DBR (18% of total supply)
- Active Holders: 91,422
III. Market Performance & Metrics
Price Performance
| Timeframe | Change | Current Price |
|---|---|---|
| 1 Hour | -0.49% | $0.02024 |
| 24 Hours | -0.44% | $0.02024 |
| 7 Days | -9.8% | - |
| 30 Days | -14.81% | - |
| 1 Year | -41.44% | - |
Historical Price Levels
- All-Time High: $0.05764 (December 22, 2024)
- All-Time Low: $0.005 (October 17, 2024)
- 24H High: $0.02087
- 24H Low: $0.01991
Market Capitalization
- Market Cap: $36,432,000
- Fully Diluted Valuation (FDV): $202,400,000
- Market Cap/FDV Ratio: 18%
- Market Dominance: 0.0066%
Trading Metrics
- 24H Trading Volume: $40,793.78
- Listed on Exchanges: 26
- Publishing Price (ICO): $0.03
IV. Investment Strategy & Risk Management
Investment Methodologies
- Long-Term Holdings (HODL DBR): Suitable for conservative investors seeking exposure to cross-chain DeFi liquidity infrastructure with extended holding periods
- Active Trading: Dependent on technical analysis and volatility trading strategies given the token's significant price fluctuations
Risk Management Framework
-
Asset Allocation Ratios:
- Conservative investors: 2-5% allocation to speculative DeFi tokens
- Aggressive investors: 5-15% allocation with portfolio hedging
- Institutional investors: Strategic position sizing with derivatives hedging
-
Risk Mitigation Strategies:
- Multi-asset portfolio diversification across established and emerging DeFi protocols
- Implementation of stop-loss orders to contain downside risk
- Position sizing relative to overall portfolio volatility tolerance
-
Secure Storage:
- Hot wallets (MetaMask, Phantom) for active trading
- Hardware wallets (Ledger, Trezor) for long-term holdings
- Cold storage solutions for significant positions
V. Investment Risks & Challenges
Market Risk
- Extreme Volatility: DBR has experienced 41.44% annual decline with continued short-term volatility
- Liquidity Risk: Relatively modest 24-hour trading volume of ~$40,793 may impact large position execution
- Price Discovery: Limited market depth across 26 exchanges may result in price slippage
Regulatory Risk
- Protocol Regulation: Cross-chain liquidity protocols face evolving regulatory scrutiny
- Jurisdictional Uncertainty: Global regulatory frameworks for DeFi infrastructure remain undefined
- Compliance Changes: Potential impact on operational parameters and token utility
Technical Risk
- Smart Contract Risk: Potential vulnerabilities in cross-chain bridging mechanisms
- Network Security: Dependence on Solana network stability and consensus mechanisms
- Upgrade Risk: Protocol modifications may introduce unforeseen technical issues
VI. Conclusion: Is deBridge a Good Investment?
Investment Value Assessment
deBridge operates in the critical DeFi infrastructure segment addressing genuine liquidity fragmentation across blockchain networks. However, the token faces significant headwinds with 41.44% annual depreciation and limited trading volume, suggesting market skepticism regarding near-term value drivers or competitive positioning relative to alternative cross-chain solutions.
Investor Recommendations
✅ Beginners: Dollar-cost averaging into small positions combined with secure hardware wallet storage for long-term exposure to cross-chain DeFi infrastructure without attempting to time market entry
✅ Experienced Investors: Technical analysis-driven swing trading around support/resistance levels with strict risk parameters; portfolio allocation not exceeding 5-10% of high-risk allocation
✅ Institutional Investors: Strategic accumulation during market weakness with multi-year investment horizon; requires thorough due diligence on competitive moat versus alternative bridging solutions
⚠️ Disclaimer: Cryptocurrency investments carry substantial risk including potential total loss of capital. This analysis is provided for informational purposes only and does not constitute investment advice, financial recommendation, or solicitation to buy or sell securities. Conduct independent research and consult qualified financial advisors before making investment decisions.
Report Generated: December 19, 2025
Data Source: deBridge Protocol Market Data
deBridge (DBR) Investment Analysis - Frequently Asked Questions
I. FAQ
Q1: What is deBridge (DBR) and what problem does it solve in the DeFi ecosystem?
A: deBridge is positioned as "DeFi's internet of liquidity," operating on the Solana blockchain as an SPL20 token. It enables real-time movement of assets and information across the decentralized finance landscape without the bottlenecks and risks associated with traditional liquidity pools. The protocol provides deep liquidity, tight bid-ask spreads, and guaranteed rates for cross-chain interactions, addressing fundamental infrastructure challenges in cross-chain asset transfers.
Q2: What are the current market metrics for DBR as of December 19, 2025?
A: As of December 19, 2025, DBR is trading at $0.02024 with a market capitalization of $36.43 million and a fully diluted valuation of $202.4 million. The token has a circulating supply of 1.8 billion DBR (18% of total supply), active holders of 91,422, and is listed on 26 exchanges. The 24-hour trading volume stands at $40,793.78, with a market rank of 599 by capitalization.
Q3: What is the price history and volatility of DBR?
A: DBR was publicly released on October 17, 2024, at $0.03. The token reached its all-time high of $0.05764 on December 22, 2024, but has experienced significant depreciation since then. Current price performance shows -0.49% in the last hour, -9.8% over 7 days, -14.81% over 30 days, and -41.44% over the past year. The significant volatility reflects market uncertainty regarding the protocol's competitive positioning and near-term value drivers.
Q4: What are the key risks associated with investing in DBR?
A: Primary risks include: (1) Token dilution risk—82% of total supply remains uncirculated, representing ongoing pressure on token value; (2) Market liquidity risk—modest 24-hour trading volume may impact large position execution; (3) Competitive risk—cross-chain bridge solutions face increasing competition in the DeFi sector; (4) Regulatory risk—evolving regulatory frameworks for DeFi infrastructure protocols remain uncertain; (5) Technical risk—potential vulnerabilities in cross-chain bridging mechanisms and dependence on Solana network stability.
Q5: What are the price predictions for DBR through 2030?
A: Price forecasts vary by scenario: Short-term (2026) ranges from $0.01441 (conservative) to $0.04000 (optimistic). Mid-term (2027-2028) predicts $0.02518-$0.03625 (2027, +36% gain) and $0.02845-$0.04411 (2028, +57% gain). Long-term (2030): Base scenario projects $0.03546-$0.04220; optimistic scenario forecasts $0.05320-$0.06500; transformative scenario suggests $0.08000 and above. These predictions remain speculative and subject to significant market volatility.
Q6: Is DBR suitable for beginner investors, and what investment approach is recommended?
A: For beginners, DBR can be appropriate through dollar-cost averaging into small positions combined with secure hardware wallet storage for long-term exposure. The strategy emphasizes avoiding market timing and maintaining positions aligned with overall cryptocurrency portfolio allocation (2-5% for conservative investors). Beginners should prioritize understanding the protocol's cross-chain infrastructure value proposition before committing capital and should never invest more than they can afford to lose entirely.
Q7: What network activity and adoption metrics support DBR's investment case?
A: deBridge processed $1.53 billion in transaction volume during October 2025, driven by integrations with major blockchain networks including Tron (hosting $82 billion USDT) and BNB Chain ($1.1 billion monthly activity). The protocol supports 26 exchange listings and maintains an active holder base of 91,422 addresses, indicating reasonable ecosystem adoption. However, modest 24-hour trading volume suggests that market depth remains limited relative to more established DeFi infrastructure protocols.
Q8: What is the relationship between DBR's circulating supply and its price appreciation potential?
A: DBR currently has only 18% of its total supply in circulation (1.8 billion of 10 billion tokens). The remaining 82% represents a significant dilution headwind for price appreciation, as token releases enter the market over time. This structural factor means that achieving substantial price increases would require either exceptional protocol adoption growth or significant market sentiment shifts that outpace the dilutive effect of token releases. Investors should carefully monitor the token unlock schedule before making long-term investment decisions.
Share
How to Buy Cryptocurrency


Trending Cryptocurrencies


2025 RAYPrice Prediction: Analyzing Growth Factors and Market Potential for RAY Token in the Coming Years

2025 RAY Price Prediction: Will This Layer-1 Protocol Reach New Heights in the Evolving DeFi Landscape?

2025 KMNO Price Prediction: Market Trends, Key Factors and Investment Outlook

2025 JUP Price Prediction: Analyzing Jupiter's Potential in the Evolving Crypto Market

2025 JTO Price Prediction: Will the Jito Network Token Reach New Heights in the DeFi Landscape?

2025 RAY Price Prediction: Analyzing Market Trends and Potential Growth Factors

Unlocking FIAS: A Guide to Acquiring the Revolutionary Metaverse Token

How to Analyze On-Chain Data for MON Token: Active Addresses, Transaction Volume, and Whale Movement

Understanding Crypto Launchpad Mechanisms: A Beginner's Guide
How does Kaspa (KAS) price volatility compare to Bitcoin with a -5.31% 24-hour swing and $0.048 current value?

What does on-chain data analysis reveal about KAS whale accumulation and transaction trends?