TRX vs GRT: A Comprehensive Comparison of Two Leading Blockchain Tokens in the Crypto Market

Introduction: TRX vs GRT Investment Comparison
In the cryptocurrency market, the comparison between TRON (TRX) and The Graph (GRT) has always been a topic that investors cannot overlook. The two differ significantly in market capitalization rankings, application scenarios, and price performance, representing different positioning of crypto assets.
TRON (TRX): Since its launch in 2017, it has gained market recognition by establishing itself as a large public chain with decentralized stablecoin capabilities and sovereign state partnerships. In May 2022, TRON announced the launch of USDD, a decentralized ultra-collateralized stablecoin, and in October of the same year, Dominica designated TRON as its official national blockchain infrastructure.
The Graph (GRT): Since its launch in 2020, it has been recognized as a decentralized protocol for indexing and querying blockchain data applied to Ethereum. The protocol enables simplified data query operations through subgraphs while utilizing GRT tokens for indexer staking and curator signaling functions.
This article will comprehensively analyze the investment value comparison between TRX and GRT across historical price trends, supply mechanisms, protocol utilities, technical ecosystems, and market positioning, while attempting to address the question that investors care most about:
"Which is the better buy right now?"
TRON (TRX) and The Graph (GRT) Comparative Market Analysis Report
I. Historical Price Comparison and Current Market Status
TRON and The Graph Historical Price Trends
TRON (TRX):
- All-time high: $0.431288 (December 4, 2024)
- All-time low: $0.00180434 (November 12, 2017)
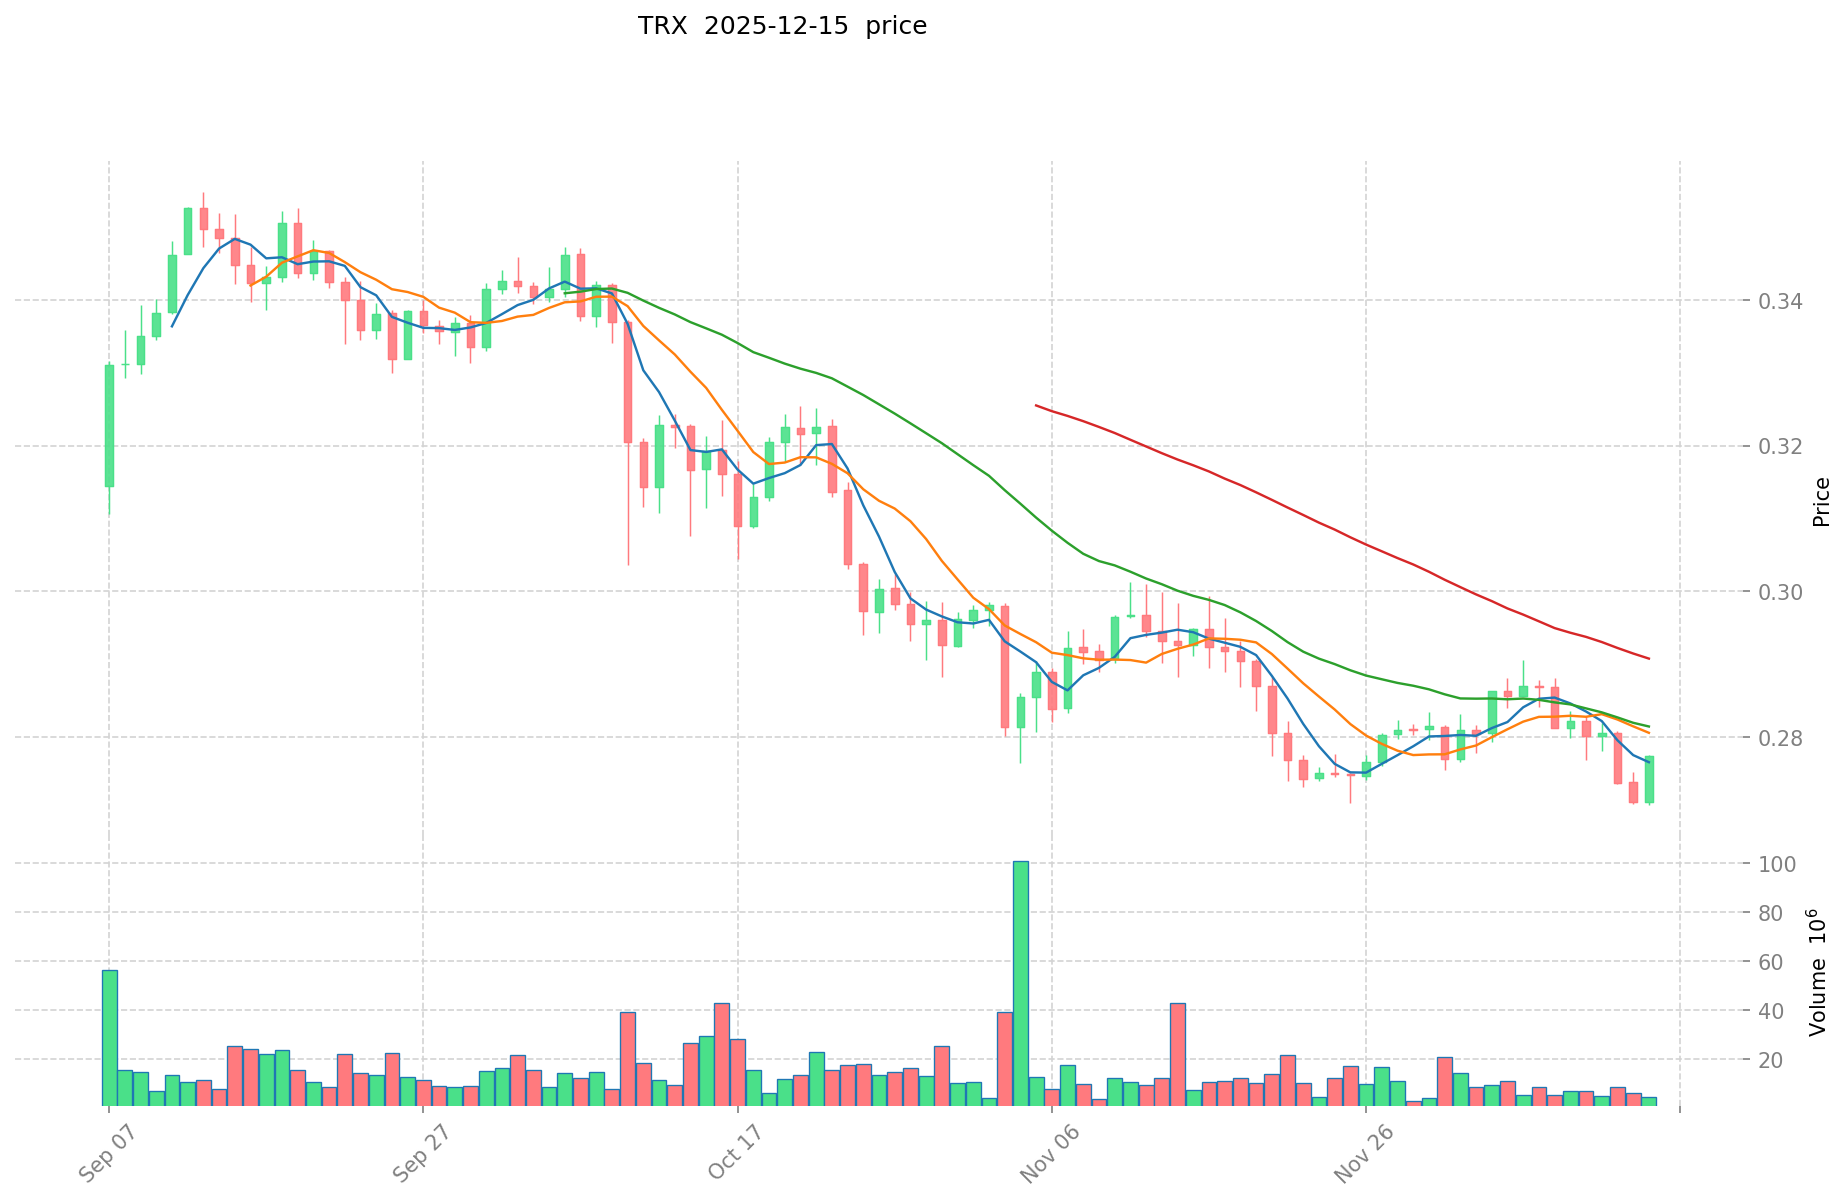
- Current price (December 15, 2025): $0.28192
- 24-hour change: +2.78%
The Graph (GRT):
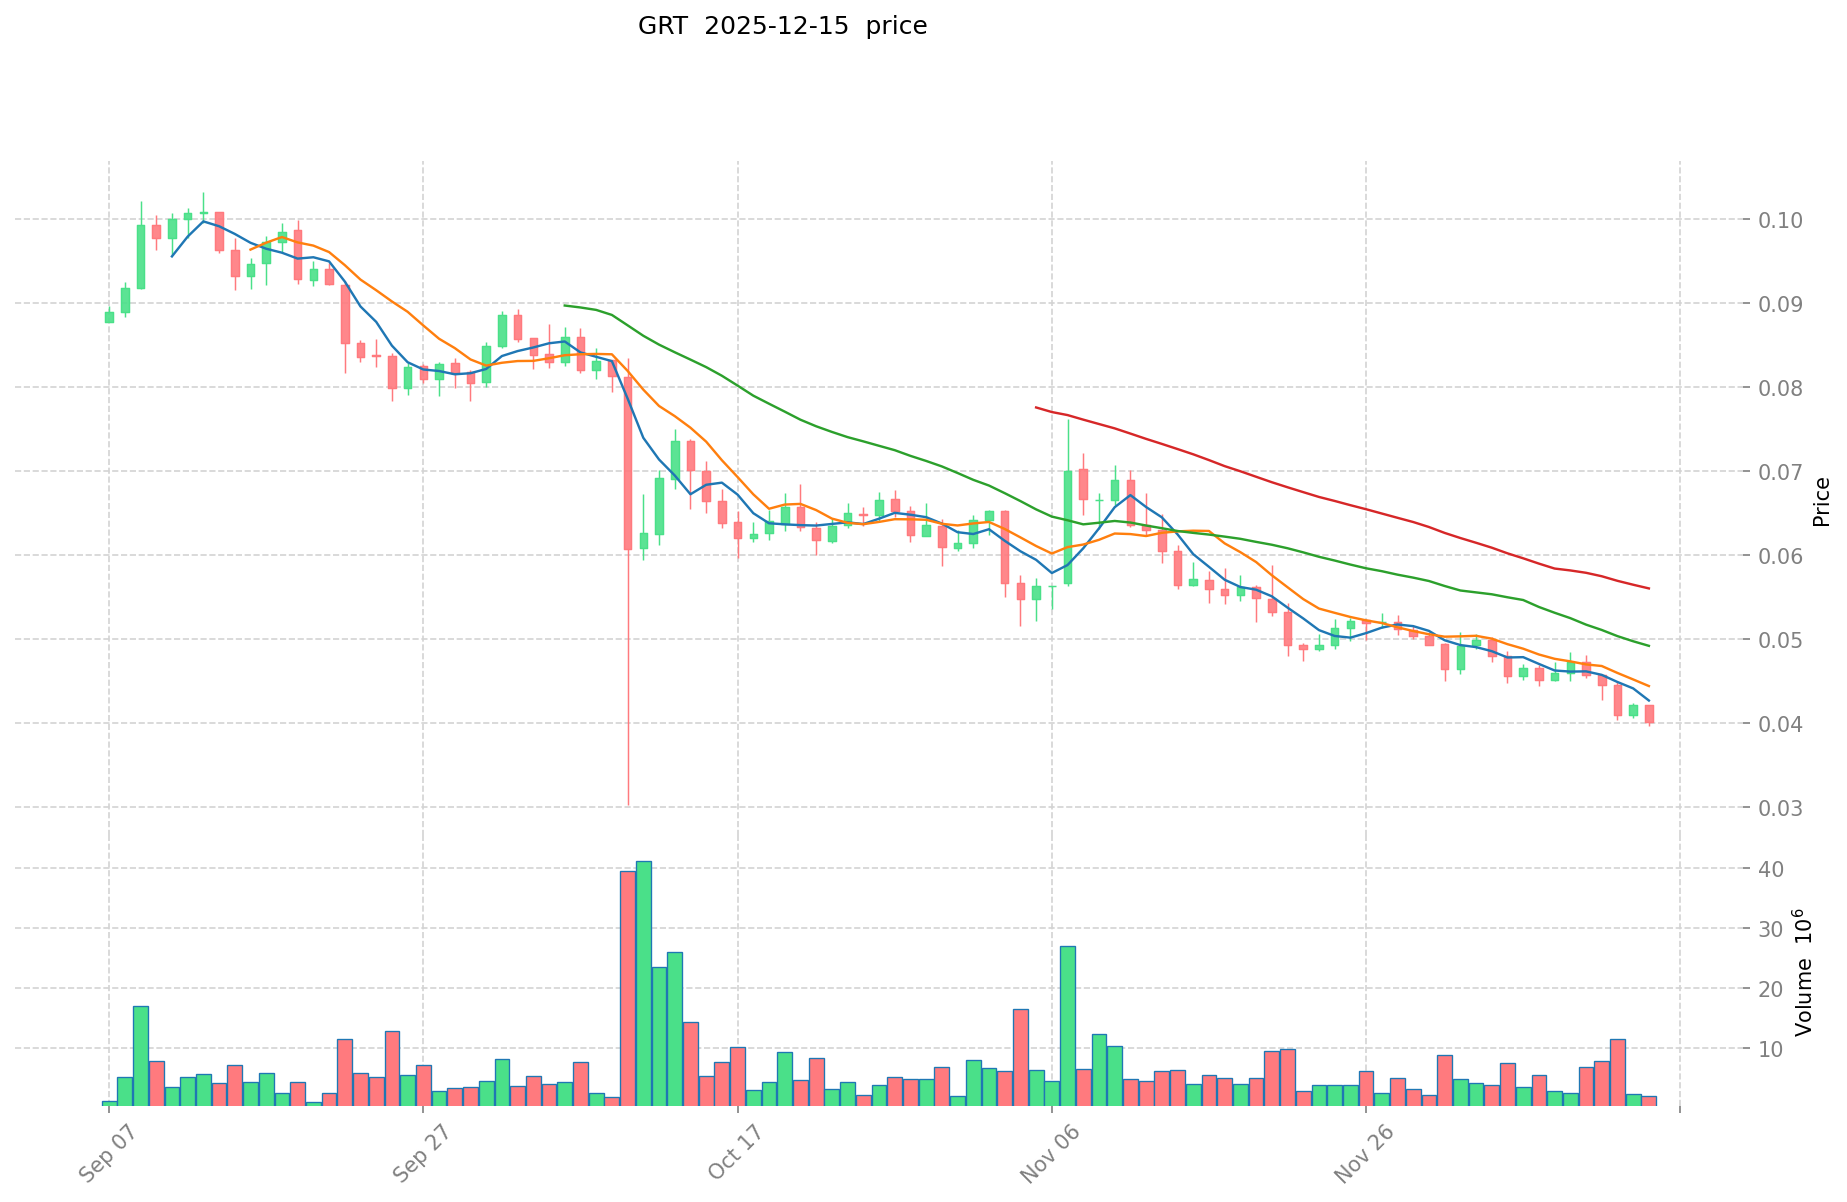
- All-time high: $2.84 (February 12, 2021)
- All-time low: $0.03998415 (December 15, 2025)
- Current price (December 15, 2025): $0.04027
- 24-hour change: -1.00%
Comparative Analysis
TRON demonstrates significantly different market dynamics compared to The Graph. From inception through the current period, TRX has appreciated substantially, currently trading near its all-time high and showing positive short-term momentum. In contrast, The Graph has experienced a dramatic decline from its 2021 peak of $2.84, representing an approximately 98.6% depreciation. The Graph reached a new all-time low on the very date of this report, indicating severe bearish pressure.
Current Market Conditions (December 15, 2025)
Price Metrics:
- TRON current price: $0.28192
- The Graph current price: $0.04027
- TRON 24-hour trading volume: $1,966,683.02 million
- The Graph 24-hour trading volume: $175,946.61 million
Market Capitalization:
- TRON market cap: $26,693,578,584.55
- The Graph market cap: $434,926,583.60
Market Sentiment:
- Crypto Fear & Greed Index: 16 (Extreme Fear)
Current market conditions reflect extreme fear sentiment among crypto market participants, with The Graph experiencing capitulation-level pricing while TRON maintains relative stability near historical highs.
II. Project Overview and Utility Analysis
TRON Protocol Fundamentals
TRON is a large-scale public blockchain that achieved significant milestone recognition in 2022. In May 2022, TRON announced the launch of USDD, a decentralized over-collateralized stablecoin backed by the TRON Joint Reserve, marking TRON's formal entry into the decentralized stablecoin sector. Subsequently, in October 2022, Dominica designated TRON as its official national blockchain infrastructure, positioning TRON as a sovereign-state-partnered blockchain platform.
Key Metrics:
- Market ranking: 10th
- Circulating supply: 94,684,742,914.33 TRX
- Circulating ratio: 99.99979%
- Maximum supply: Unlimited
- Listed on 72 exchanges
The Graph Protocol Fundamentals
The Graph is a decentralized protocol designed for indexing and querying blockchain data on Ethereum. The protocol democratizes data accessibility by enabling any participant to build and publish open APIs (subgraphs), making blockchain data readily available to decentralized applications.
GRT Token Functions:
- Indexer Staking: Indexers stake GRT tokens to become discoverable in the query marketplace while providing economic security during work execution
- Curator Signaling: Curators stake GRT tokens in the curation market to predict valuable subgraphs, earning rewards for accurate predictions
- Settlement Unit: Query payments in ETH or DAI ultimately settle in GRT to maintain a unified accounting system
- Monetary Policy Tool: Native token holdings enable incentive mechanisms through dynamic inflation adjustments
Key Metrics:
- Market ranking: 142nd
- Circulating supply: 10,628,136,053.00 GRT
- Circulating ratio: 98.41%
- Maximum supply: 10,800,262,823.32
- Listed on 58 exchanges
III. Price Performance Analysis
Short-Term Performance (1-30 Days)
| Time Period | TRON Change | The Graph Change |
|---|---|---|
| 1 Hour | +0.13% | -0.25% |
| 24 Hours | +2.78% | -1.00% |
| 7 Days | -1.47% | -13.77% |
| 30 Days | -3.35% | -29.32% |
| 1 Year | -0.16% | -85.18% |
Analysis: TRON exhibits short-term bullish momentum, gaining 2.78% over 24 hours while maintaining relative stability on longer timeframes. The Graph shows consistent bearish pressure across all measured periods, with particularly severe declines over 30-day (-29.32%) and 1-year (-85.18%) intervals.
Market Share and Dominance
- TRON market dominance: 0.82% of total crypto market
- The Graph market dominance: 0.013% of total crypto market
TRON commands approximately 63 times greater market dominance than The Graph, reflecting significantly different ecosystem scales and market recognition.
IV. Market Risk Assessment
Volatility and Liquidity Considerations
TRON:
- Daily trading range (24h): $0.27427 – $0.28289
- Market depth: High liquidity across 72 trading venues
- Volatility profile: Moderate, with stable positioning near historical highs
The Graph:
- Daily trading range (24h): $0.03961 – $0.04116
- Market depth: Moderate liquidity across 58 trading venues
- Volatility profile: Elevated, with new all-time low established on reporting date
Price Pressure Factors
The Graph faces sustained downward pressure evidenced by:
- 85.18% annual depreciation
- Establishment of new all-time low on December 15, 2025
- Consecutive monthly declines exceeding 29%
- Market capitalization compression to approximately $435 million
TRON maintains stability supported by:
- Proximity to all-time high ($0.431288)
- Positive 24-hour momentum
- Large market capitalization ($26.7 billion)
- Governmental recognition as national blockchain infrastructure
V. Community and Ecosystem
Developer Activity and Adoption
TRON:
- Active GitHub repositories with multiple protocol implementations
- Official websites and explorers operational
- Strong social media presence across Twitter and Reddit
- 213.5 million token holders
The Graph:
- Multiple GitHub repositories for protocol components
- Active development on graph-node, graph-ts, and graph-cli
- 173,440 token holders
- Infrastructure focus within Ethereum ecosystem
VI. Summary and Observations
TRON and The Graph represent fundamentally different market positions within the cryptocurrency landscape. TRON operates as an established large-cap protocol with sovereign-state partnership recognition, demonstrating price stability and positive short-term momentum. The Graph functions as an infrastructure protocol experiencing significant market contraction, reflected in substantial price depreciation and new all-time lows.
The extreme fear sentiment (Index: 16) reflected in the broader crypto market indicates challenging conditions for protocols experiencing weakness like The Graph, while established platforms like TRON maintain relative resilience during this period of market stress.
Current Fear & Greed Index: 16 (Extreme Fear)
Disclaimer: This analysis is provided for informational purposes only and does not constitute investment advice. Cryptocurrency markets are highly volatile and unpredictable. Past performance does not guarantee future results. Individuals should conduct independent research and consult qualified financial advisors before making investment decisions.
TRON (TRX) Investment Value Analysis Report
Executive Summary
This report analyzes TRON (TRX) as a Layer-1 blockchain asset based on available market data as of November 2025. The analysis covers market fundamentals, valuation factors, price forecasts, and associated risks. This document is for informational purposes only and does not constitute investment advice.
I. Market Overview and Current Status
Market Position and Scale
TRON (TRX) maintains a significant position within the cryptocurrency ecosystem:
- Market Capitalization: USD 27,725,851,919 (as of November 2025)
- Circulating Supply: Approximately 94,669,480,387 tokens
- Current Price: USD 0.29287
- 24-Hour Trading Volume: USD 5,119,944.98
Historical Performance Context
- 2017: Initial Token Offering (ICO) phase launched with early investors achieving substantial returns
- Network Scale: Processes over 8 million transactions daily
- Stablecoin Market Share: Commands approximately 60% of global stablecoin transaction volume
II. Core Factors Influencing TRX Investment Value
Supply Mechanism and Scarcity
The reference materials indicate that supply mechanisms represent a fundamental factor in TRX valuation, though specific tokenomic details regarding inflation rates or emission schedules are not detailed in the provided sources.
Institutional Adoption and Market Application
Enterprise and Institutional Use Cases:
- TRON functions as infrastructure for decentralized stablecoin transactions, particularly USDT transfers
- 2023 Annual Revenue: Approximately USD 400-500 million, with 75% derived from USDT transfer fees
- This generated estimated profits of approximately USD 400 million in 2023
Cross-Border Transaction Applications:
- TRON supports billions of dollars in daily transfer settlement
- Primary use case centers on stablecoin movement and transaction processing rather than speculative trading
Valuation Metrics:
- Price-to-Earnings (P/E) ratio approximately 10x, significantly lower than alternative Layer-1 blockchains
- Comparative valuation suggests potential undervaluation relative to DeFi application standards
Technology Development and Ecosystem
Transaction Processing Capabilities:
- Daily transaction capacity exceeds 8 million transactions
- Decentralized exchange functionality integrated within ecosystem
- EVM (Ethereum Virtual Machine) compatibility supports developer accessibility
Regulatory Positioning:
- Described as a "large-scale public chain collaborating with sovereign nations"
- International partnerships extending ecosystem reach
Macroeconomic and Market Cycle Factors
Relative to broader cryptocurrency market dynamics, TRON's core value proposition centers on utility-based fundamentals rather than speculative sentiment:
- Recurring Revenue Model: Transaction fee-based revenue generation provides stable economic foundation
- Market Volatility: Cryptocurrency markets exhibit significant price fluctuations, requiring cautious evaluation
- Comparative Advantage: Low fee structure and high transaction throughput create competitive advantages in payment-focused applications
III. Price Forecasts and Valuation Projections
Short-Term Outlook (2025-2026)
2025-2026 Price Range Predictions:
| Scenario | Price Range (USD) |
|---|---|
| Conservative | 0.2555 - 0.2937 |
| Neutral | 0.2937 - 0.3289 |
| Optimistic | 0.3289 - 0.3642 |
Medium-Term Projections (2027-2028)
| Year | Price Range (USD) |
|---|---|
| 2027 | 0.2369 - 0.4777 |
| 2028 | 0.3751 - 0.4537 |
Long-Term Outlook (2030)
2030 Price Range Scenarios:
| Scenario | Price Range (USD) |
|---|---|
| Base Case | 0.4045 - 0.6407 |
| Optimistic | 0.5005 - 0.6407 |
Conditional Factors: Long-term valuation assumes sustained mainstream application growth and favorable market environmental conditions. Optimistic scenarios incorporate accelerated ecosystem expansion and market-supportive conditions.
IV. Risk Assessment and Investment Considerations
Market-Related Risks
- Volatility: Cryptocurrency markets experience substantial price fluctuations
- Market Cycles: Asset valuations remain highly correlated with broader crypto market sentiment
- Competition: Ongoing competition from alternative Layer-1 blockchain solutions
Fundamental Risks
- Competitive Sustainability: Future value depends critically on TRON's ability to maintain competitive advantages
- Regulatory Challenges: Evolution of regulatory frameworks across jurisdictions presents uncertainty
- Macro Market Conditions: Broader cryptocurrency market performance significantly influences asset valuations
Investment Considerations
Factors Requiring Evaluation:
- Overall cryptocurrency market fundamental trends
- Project-specific information and development pipeline
- Current market valuation relative to historical and peer benchmarks
- Current price positioning within market cycles
Key Decision Points:
- Whether current market conditions present appropriate entry opportunities
- Alignment with individual risk tolerance and investment time horizon
- Portfolio diversification implications
V. Conclusion
TRON demonstrates operational fundamentals centered on transaction processing and stablecoin infrastructure, with a comparatively conservative valuation multiple relative to alternative blockchain platforms. The asset's future performance depends on sustained competitiveness, regulatory navigation, and broader cryptocurrency market conditions.
Disclaimer: This analysis is provided for informational purposes only and does not constitute investment advice. Cryptocurrency investments carry substantial risk. Investors should conduct independent research and consider their individual circumstances before making investment decisions.
Report Date: December 15, 2025
Data Reference: November 2025 Market Information
III. 2025-2030 Year Price Prediction: TRX vs GRT
Short-term Prediction (2025)
- TRX: Conservative $0.1438-$0.2819 | Optimistic $0.4144
- GRT: Conservative $0.0383-$0.0403 | Optimistic $0.0512
Mid-term Prediction (2027-2028)
- TRX may enter a consolidation phase with recovery signals, projected price range $0.3443-$0.4684
- GRT may enter an early growth phase with gradual accumulation, projected price range $0.0382-$0.0754
- Key drivers: Institutional capital inflow, ETF integration, ecosystem development
Long-term Prediction (2029-2030)
- TRX: Base case $0.3237-$0.4496 | Optimistic scenario $0.5036-$0.6053
- GRT: Base case $0.0529-$0.0630 | Optimistic scenario $0.0775-$0.0914
Disclaimer: These predictions are based on historical data analysis and market modeling. Actual market performance may differ significantly. Cryptocurrency markets are highly volatile and subject to regulatory, technological, and macroeconomic uncertainties. This analysis does not constitute investment advice. Investors should conduct independent research and consult financial advisors before making investment decisions.
TRX:
| 年份 | 预测最高价 | 预测平均价格 | 预测最低价 | 涨跌幅 |
|---|---|---|---|---|
| 2025 | 0.4144077 | 0.28191 | 0.1437741 | 0 |
| 2026 | 0.452606505 | 0.34815885 | 0.194968956 | 23 |
| 2027 | 0.468447732675 | 0.4003826775 | 0.34432910265 | 42 |
| 2028 | 0.464824269443625 | 0.4344152050875 | 0.417038596884 | 54 |
| 2029 | 0.50357410573743 | 0.449619737265562 | 0.323726210831205 | 59 |
| 2030 | 0.6052780903069 | 0.476596921501496 | 0.452767075426421 | 69 |
GRT:
| 年份 | 预测最高价 | 预测平均价格 | 预测最低价 | 涨跌幅 |
|---|---|---|---|---|
| 2025 | 0.051181 | 0.0403 | 0.038285 | 0 |
| 2026 | 0.053516385 | 0.0457405 | 0.039794235 | 13 |
| 2027 | 0.0516135802 | 0.0496284425 | 0.038213900725 | 23 |
| 2028 | 0.0754253069115 | 0.05062101135 | 0.046571330442 | 25 |
| 2029 | 0.077518485730822 | 0.06302315913075 | 0.05293945366983 | 56 |
| 2030 | 0.091352069160022 | 0.070270822430786 | 0.063946448412015 | 74 |
TRON (TRX) vs The Graph (GRT) Comprehensive Investment Analysis Report
IV. Investment Strategy Comparison: TRX vs GRT
Long-Term vs Short-Term Investment Strategies
TRON (TRX): Best suited for investors prioritizing utility-based fundamentals, stablecoin infrastructure exposure, and recurring revenue models. The asset demonstrates stability near historical highs with positive short-term momentum, making it appropriate for both income-focused and growth-oriented investment horizons.
The Graph (GRT): Best suited for investors with high risk tolerance seeking recovery plays or deeply contrarian positions. Early accumulation strategies may appeal to investors betting on infrastructure protocol maturation, though substantial downside risks persist given the 85.18% annual depreciation and new all-time low established on the reporting date.
Risk Management and Asset Allocation
Conservative Investor Profile:
- TRON: 75% | The Graph: 5% | Stablecoins/Cash: 20%
- Rationale: Emphasis on established market cap, positive momentum, and recurring revenue model
Aggressive Investor Profile:
- TRON: 50% | The Graph: 35% | Stablecoins/Cash: 15%
- Rationale: Increased exposure to turnaround potential while maintaining foundational position in proven performer
Hedging Instruments:
- Stablecoin allocation (USDT/USDC) to reduce volatility during market downturns
- Cross-asset diversification across Layer-1 blockchains to mitigate protocol-specific risks
- Options strategies for downside protection on concentrated positions
V. Comparative Risk Assessment
Market-Related Risks
TRON:
- Positive 24-hour momentum may reverse during broader cryptocurrency downturns
- Market dominance (0.82%) remains concentrated relative to larger Layer-1 competitors
- Stablecoin transaction dependency creates revenue concentration risk
The Graph:
- Sustained downward pressure evidenced by 85.18% annual depreciation
- New all-time low establishment on December 15, 2025 indicates potential capitulation
- Market capitalization compression to $435 million creates liquidity concerns for large positions
- 98.6% decline from 2021 peak suggests significant investor losses and potential continued selling pressure
Technical and Ecosystem Risks
TRON:
- Network scalability dependent on continuous optimization given 8 million daily transactions
- EVM compatibility creates potential security considerations through cross-chain interactions
- Competitive pressure from alternative stablecoin infrastructure solutions
The Graph:
- Protocol indexing accuracy and data freshness dependent on sufficient indexer participation
- Economic security model vulnerable to incentive structure changes
- Ethereum ecosystem concentration creates dependency on ETH network health and adoption
Regulatory Risks
TRON:
- Stablecoin regulatory scrutiny may intensify given increased government attention to decentralized stablecoins
- Sovereignty partnerships (Dominica designation) may face diplomatic or policy changes
- Cross-border transaction facilitation could attract enhanced regulatory oversight
The Graph:
- Infrastructure protocols face emerging regulatory frameworks around data indexing and query services
- Token incentive mechanisms may encounter regulatory classification challenges
- Ethereum ecosystem regulatory status influences downstream protocol positioning
VI. Conclusion: Which Is the Better Buy?
📌 Investment Value Summary
TRON Advantages:
- Established market position with $26.7 billion market capitalization (63x larger than GRT)
- Proximity to all-time high ($0.431288) with positive short-term momentum (+2.78% 24-hour change)
- Recurring revenue model generating $400-500 million annually with 75% from USDT transaction fees
- Governmental recognition as Dominica's official national blockchain infrastructure
- High liquidity across 72 trading venues with stable price positioning
- 213.5 million token holders indicating broad adoption
The Graph Advantages:
- Decentralized data indexing infrastructure addressing fundamental blockchain query needs
- Staking and curation mechanisms provide economic participation opportunities
- Potential for recovery appreciation from capitulation-level pricing (new all-time low)
- 2027-2028 price projections suggest potential 25% upside in mid-term scenarios
- Infrastructure protocol positioning may benefit from long-term blockchain adoption acceleration
- Lower entry price ($0.04027) enables substantial upside participation if recovery materializes
✅ Investment Recommendations
Beginner Investors: Prioritize TRON as primary allocation. The established market position, clear revenue generation model, and relative stability provide lower complexity and reduced monitoring requirements. Avoid significant The Graph exposure until demonstrated signs of stabilization and potential recovery confirmation.
Experienced Investors: Consider 70-80% TRON allocation with 20-30% tactical exposure to The Graph. Experienced investors may employ position-scaling strategies into Graph weakness, establishing staged entry positions below $0.04 with defined risk parameters. Utilize technical analysis to identify potential bottoming patterns and support level confirmations.
Institutional Investors:
- TRON: Suitable for yield-oriented mandates seeking recurring transaction fee exposure with proven operational track record. Stablecoin infrastructure positioning aligns with institutional liquidity and settlement needs.
- The Graph: Appropriate for venture-style allocations targeting infrastructure protocol recovery scenarios, employing defined allocation limits and monitoring frameworks for ecosystem development metrics.
- Portfolio Construction: Consider both assets within diversified Layer-1 exposure rather than exclusive selection, employing size-based weighting favoring established TRON fundamentals.
⚠️ Risk Disclaimer
Cryptocurrency markets exhibit extreme volatility and unpredictability. The Graph has established new all-time lows on the reporting date with sustained 85.18% annual depreciation, indicating severe downside risk. TRON, while demonstrating relative stability, remains subject to cryptocurrency market cycles and regulatory uncertainties.
This analysis is provided for informational purposes only and does not constitute investment advice. All cryptocurrency investments carry substantial risk of loss. Past performance does not guarantee future results. Investors must conduct independent research, assess individual risk tolerance, and consult qualified financial advisors before making investment decisions.
Current Market Conditions (December 15, 2025): Extreme Fear sentiment (Fear & Greed Index: 16) indicates heightened market stress favoring defensive positioning and established protocols over recovery plays.
Report Date: December 15, 2025
Data Currency: December 15, 2025
None
TRON (TRX) vs The Graph (GRT) Investment Comparison FAQ
I. Frequently Asked Questions
Q1: What are the main differences between TRON and The Graph in terms of market position?
A: TRON holds a significantly stronger market position with a $26.7 billion market capitalization ranking 10th globally, while The Graph ranks 142nd with only $435 million market cap. TRON trades near its all-time high of $0.431288 at $0.28192 with positive momentum, whereas The Graph has experienced a 98.6% decline from its 2021 peak of $2.84 to $0.04027, establishing a new all-time low on December 15, 2025. TRON commands 63 times greater market dominance and demonstrates high liquidity across 72 exchanges compared to The Graph's 58 exchanges.
Q2: What is the primary utility and use case for each protocol?
A: TRON functions as a Layer-1 blockchain focused on transaction processing and decentralized stablecoin infrastructure, generating $400-500 million in annual revenue with 75% derived from USDT transfer fees. It processes over 8 million daily transactions and serves as Dominica's official national blockchain infrastructure. The Graph operates as a decentralized data indexing and querying protocol for Ethereum, enabling developers to build and publish open APIs (subgraphs) for blockchain data accessibility, with GRT tokens serving staking, curation signaling, and settlement functions.
Q3: Which asset demonstrates better price performance and momentum?
A: TRON exhibits significantly superior performance with +2.78% 24-hour gains and stability near historical highs, while The Graph shows consistent bearish pressure with -1.00% 24-hour decline, -13.77% 7-day decline, and -29.32% 30-day decline. Over one year, TRON declined -0.16% while The Graph deteriorated -85.18%. Current market sentiment (Crypto Fear & Greed Index: 16 indicating extreme fear) particularly pressures infrastructure protocols like The Graph while relatively stabilizing established platforms like TRON.
Q4: What are the price predictions for 2025-2030?
A: TRON projections show conservative range of $0.1438-$0.2819 for 2025, escalating to $0.3237-$0.6053 by 2030 under base case scenarios. The Graph predictions range from conservative $0.0383-$0.0403 in 2025 to $0.0529-$0.0914 by 2030. Mid-term convergence (2027-2028) suggests TRON consolidation at $0.3443-$0.4684 while The Graph potentially enters early growth phase at $0.0382-$0.0754, assuming favorable market conditions and institutional capital inflow.
Q5: What are the primary investment risks for each asset?
A: TRON risks include revenue concentration from stablecoin transaction fees, regulatory scrutiny of decentralized stablecoins, and competitive pressure from alternative Layer-1 solutions. TRON also faces stablecoin regulatory intensification and sovereignty partnership policy uncertainty. The Graph faces more severe risks including 85.18% annual depreciation, new all-time low capitulation pricing, liquidity concerns from $435 million market cap compression, and economic security model vulnerability to incentive structure changes. Both face cryptocurrency market cycle volatility and regulatory evolution uncertainty.
Q6: Which asset is better suited for different investor profiles?
A: Conservative investors should prioritize TRON with 75% allocation for its established $26.7 billion market cap, proven $400-500 million annual revenue model, positive momentum, and governmental recognition. Experienced investors may employ 70-80% TRON / 20-30% tactical Graph exposure, utilizing staged entry strategies during Graph weakness below $0.04. Aggressive investors with high risk tolerance might allocate 50% TRON / 35% Graph for turnaround exposure. Institutional investors should consider TRON for yield-oriented mandates and The Graph for venture-style infrastructure recovery allocations with defined monitoring frameworks.
Q7: What current market conditions should influence investment decisions?
A: The extreme fear sentiment (Fear & Greed Index: 16) observed on December 15, 2025 creates challenging conditions for weakened protocols like The Graph while relatively stabilizing established platforms like TRON. TRON's proximity to all-time highs combined with positive momentum suggests relative resilience during market stress. The Graph's new all-time low establishment on the reporting date indicates potential capitulation but carries unproven recovery prospects. Current extreme fear conditions favor defensive positioning in proven protocols rather than speculative recovery plays.
Q8: Which asset represents the better investment opportunity right now?
A: TRON represents the superior near-term investment choice for most investor profiles due to established market position, positive momentum, proven recurring revenue model, and relative stability during extreme fear market conditions. The Graph presents only tactical opportunity for experienced investors seeking contrarian recovery exposure with high risk tolerance and defined position sizing limits. TRON's $26.7 billion market capitalization, $400-500 million annual revenue generation, and governmental partnership partnerships provide substantially lower risk profiles compared to The Graph's 85.18% annual depreciation and new all-time low pricing. Beginners should exclusively prioritize TRON; experienced investors may employ limited tactical Graph exposure below $0.04 with strict risk management protocols.
Disclaimer: This analysis is provided for informational purposes only and does not constitute investment advice. Cryptocurrency markets are highly volatile and unpredictable. Past performance does not guarantee future results. All cryptocurrency investments carry substantial risk of loss. Investors must conduct independent research and consult qualified financial advisors before making investment decisions.
Share
Content
Introduction: TRX vs GRT Investment Comparison
I. Historical Price Comparison and Current Market Status
II. Project Overview and Utility Analysis
III. Price Performance Analysis
IV. Market Risk Assessment
V. Community and Ecosystem
VI. Summary and Observations
Executive Summary
I. Market Overview and Current Status
II. Core Factors Influencing TRX Investment Value
III. Price Forecasts and Valuation Projections
IV. Risk Assessment and Investment Considerations
V. Conclusion
III. 2025-2030 Year Price Prediction: TRX vs GRT
IV. Investment Strategy Comparison: TRX vs GRT
V. Comparative Risk Assessment
VI. Conclusion: Which Is the Better Buy?
I. Frequently Asked Questions
How to Buy Cryptocurrency


Trending Cryptocurrencies


XZXX: A Comprehensive Guide to the BRC-20 Meme Token in 2025

Bitcoin Fear and Greed Index: Market Sentiment Analysis for 2025

Top Crypto ETFs to Watch in 2025: Navigating the Digital Asset Boom
5 ways to get Bitcoin for free in 2025: Newbie Guide

Bitcoin Market Cap in 2025: Analysis and Trends for Investors

2025 Bitcoin Price Prediction: Trump's Tariffs' Impact on BTC

Is Pre Market A Good Trading Indicator? What Early Price Moves Really Mean
How Many Ethereum Nodes Power the Networks

How Do MACD, RSI, and KDJ Indicators Predict Crypto Price Movements?
# What Are the Biggest Crypto Security Risks: Smart Contract Vulnerabilities, Exchange Hacks, and Centralized Custody Dangers?
What is TUSD: A Comprehensive Guide to TrueUSD Stablecoin and Its Role in Cryptocurrency Markets