Trade
Basic
Futures
Futures
Hundreds of contracts settled in USDT or BTC
TradFi
Gold
Trade global traditional assets with USDT in one place
Options
Hot
Trade European-style vanilla options
Unified Account
Maximize your capital efficiency
Demo Trading
Futures Kickoff
Get prepared for your futures trading
Futures Events
Participate in events to win generous rewards
Demo Trading
Use virtual funds to experience risk-free trading
Earn
Launch
CandyDrop
Collect candies to earn airdrops
Launchpool
Quick staking, earn potential new tokens
HODLer Airdrop
Hold GT and get massive airdrops for free
Launchpad
Be early to the next big token project
Alpha Points
Trade on-chain assets and enjoy airdrop rewards!
Futures Points
Earn futures points and claim airdrop rewards
Investment
Simple Earn
Earn interests with idle tokens
Auto-Invest
Auto-invest on a regular basis
Dual Investment
Buy low and sell high to take profits from price fluctuations
Soft Staking
Earn rewards with flexible staking
Crypto Loan
0 Fees
Pledge one crypto to borrow another
Lending Center
One-stop lending hub
VIP Wealth Hub
Customized wealth management empowers your assets growth
Private Wealth Management
Customized asset management to grow your digital assets
Quant Fund
Top asset management team helps you profit without hassle
Staking
Stake cryptos to earn in PoS products
Smart Leverage
New
No forced liquidation before maturity, worry-free leveraged gains
GUSD Minting
Use USDT/USDC to mint GUSD for treasury-level yields
More
Changmin
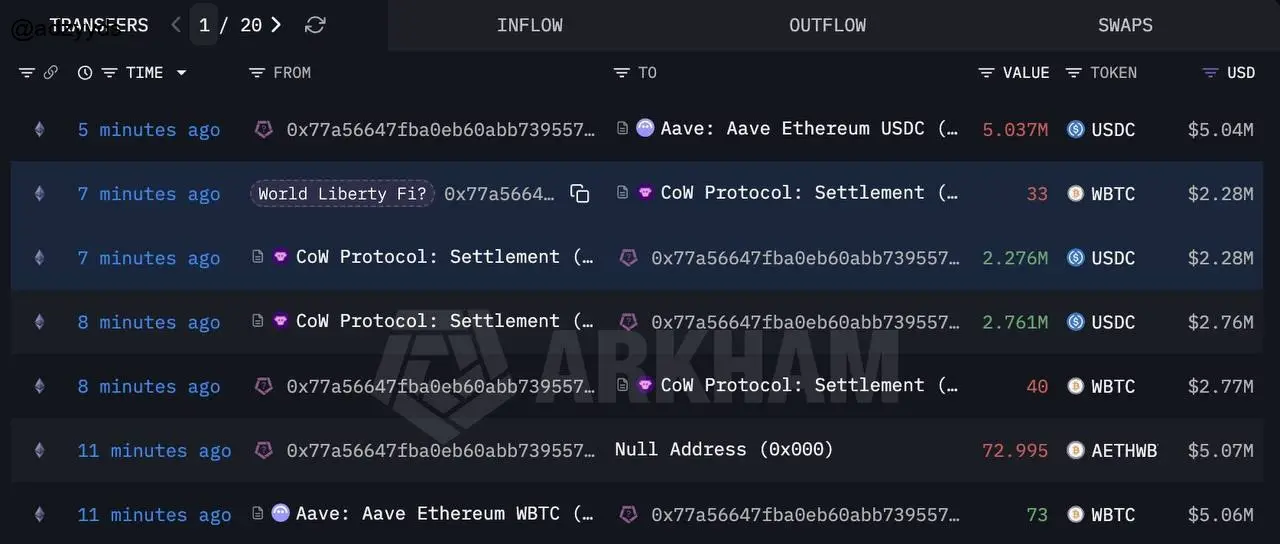
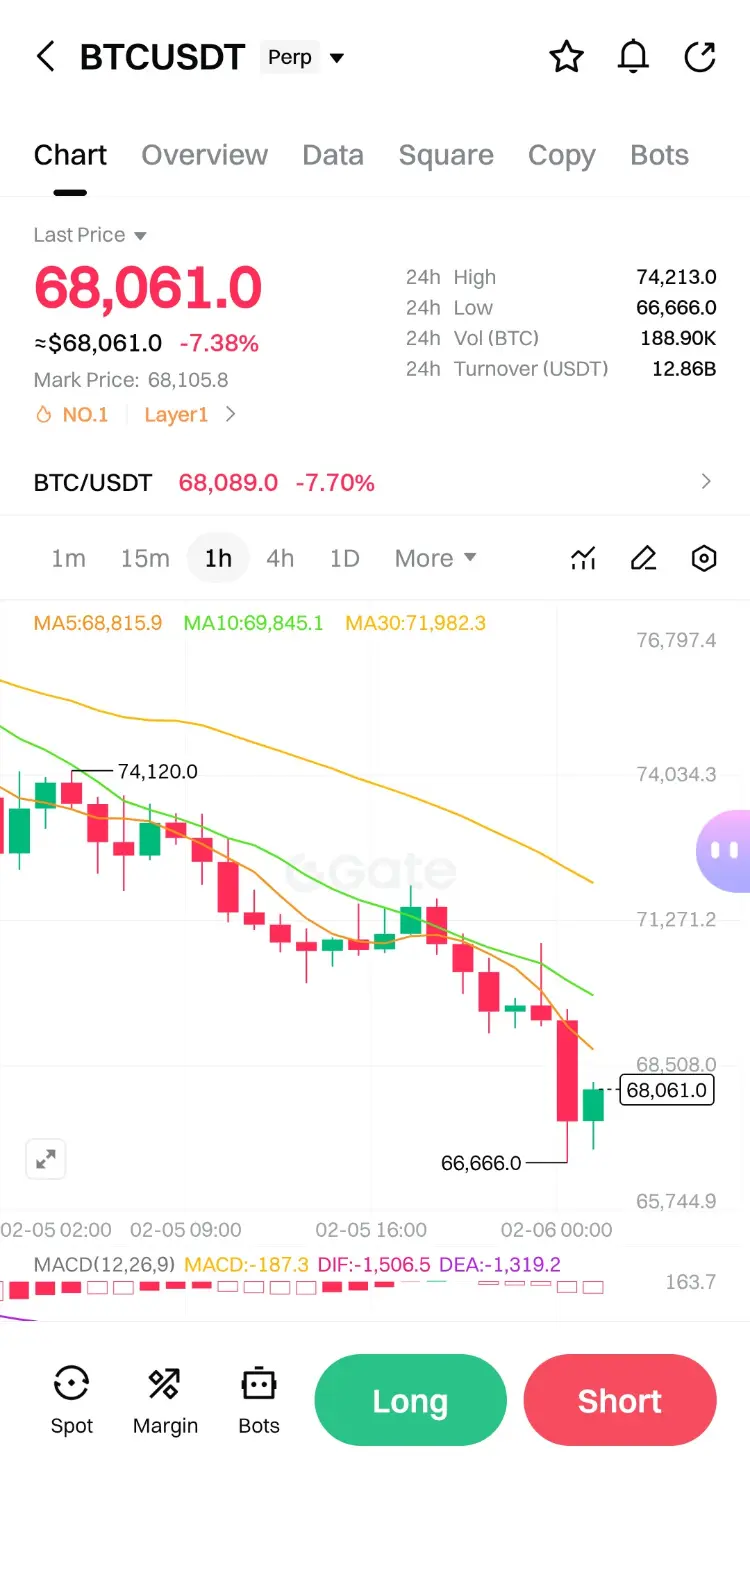
Breaking News: At 10 PM, Trump's World Freedom Company just sold 73 WBTC (worth $5.04 million) at a price of $69,000.
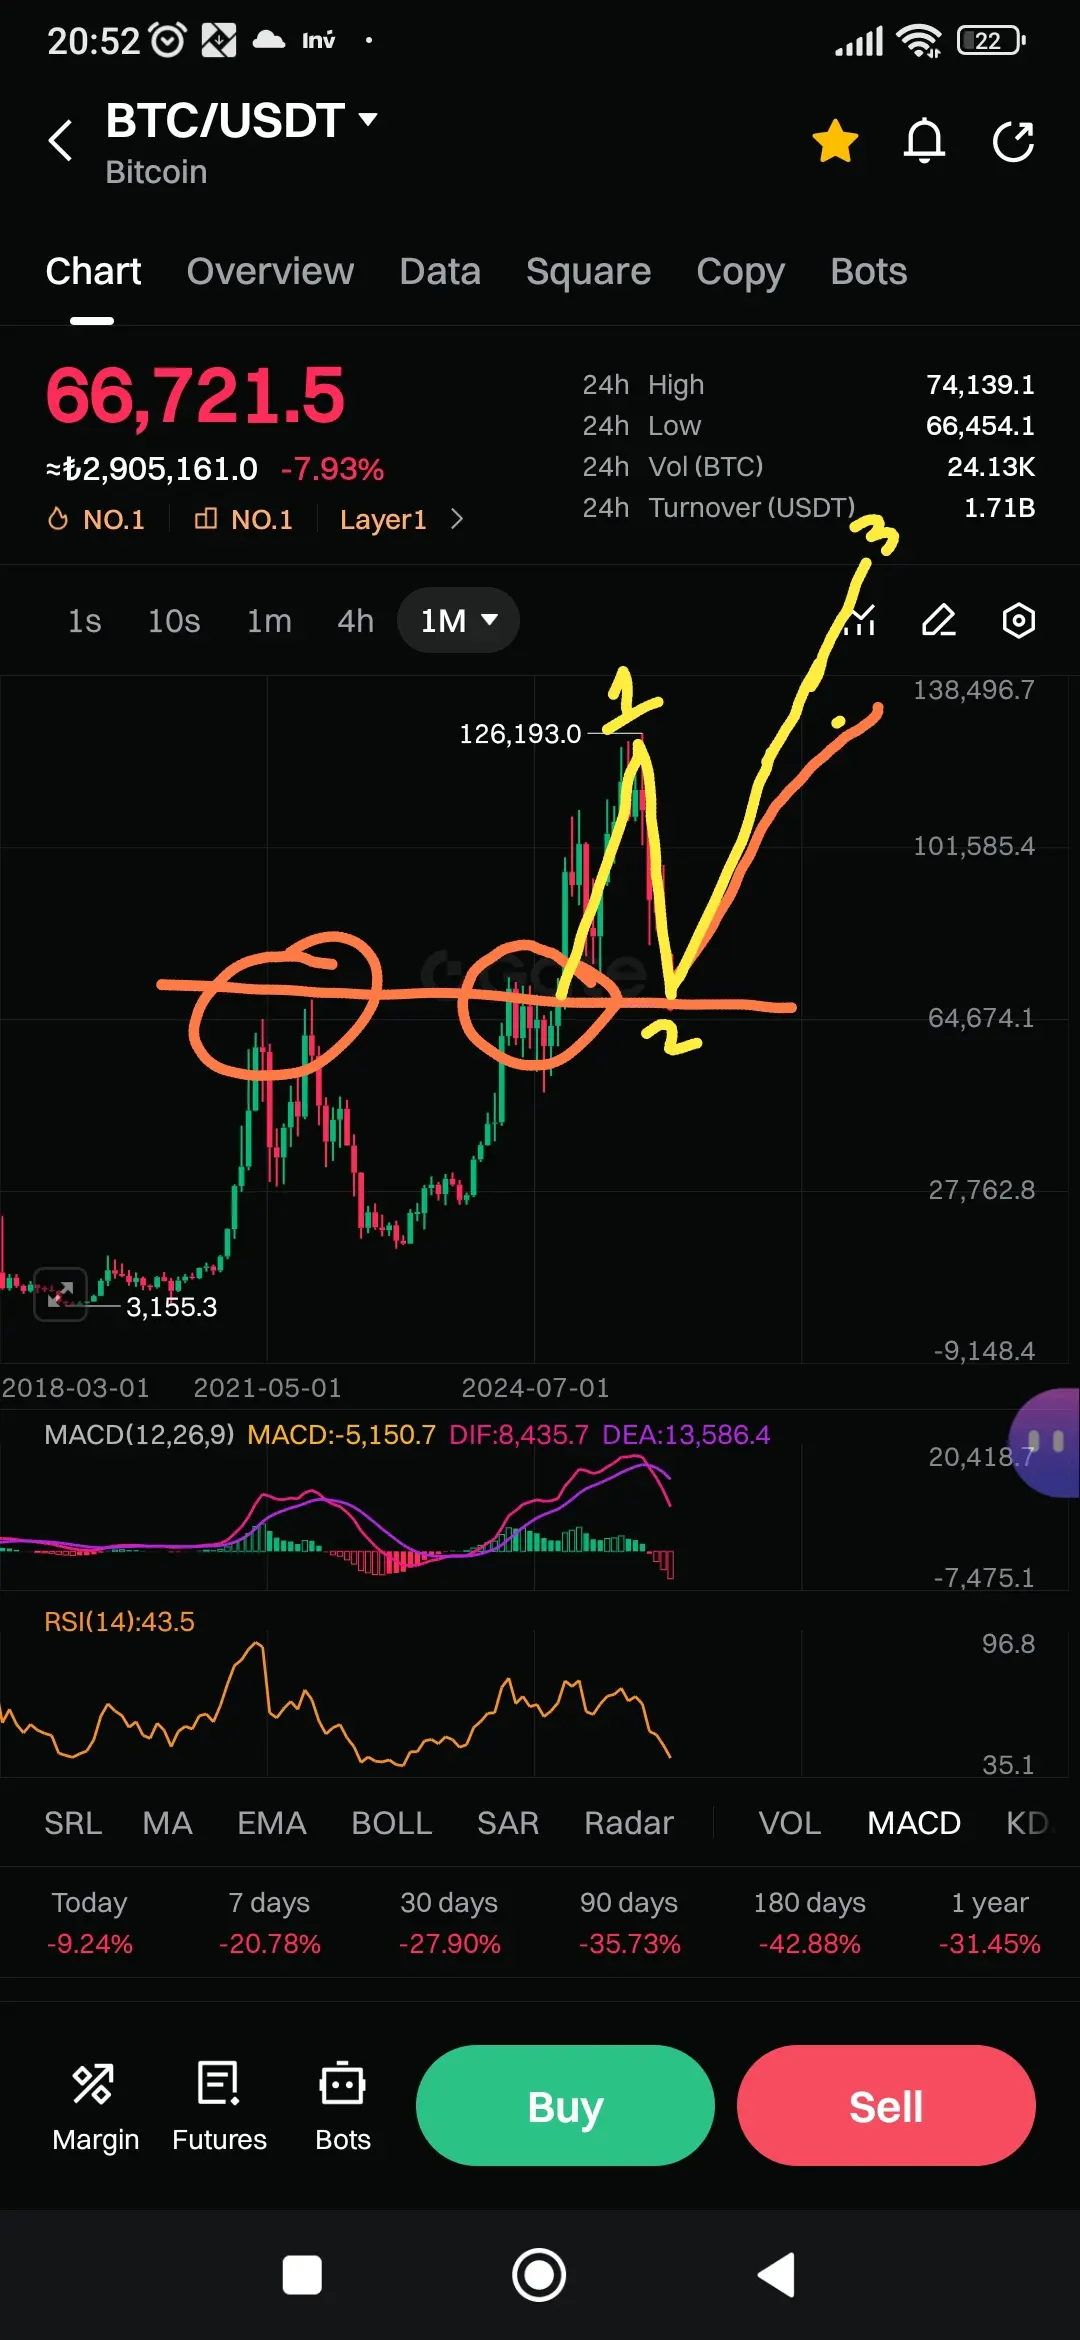
Currently, in this market, brothers, don't guess the bottom, don't buy the dip, don't act recklessly. Hold your bullets, be patient, and wait for the best market conditions. In this level of market, not losing money or losing less is a victory #btc $BTC
Currently, in this market, brothers, don't guess the bottom, don't buy the dip, don't act recklessly. Hold your bullets, be patient, and wait for the best market conditions. In this level of market, not losing money or losing less is a victory #btc $BTC
BTC-9.41%
[The user has shared his/her trading data. Go to the App to view more.]
- Reward
- 1
- 3
- Repost
- Share
ZeyuanSmilesAtYou :
:
ReceivedView More
星星之火
星星之火
Created By@gatefunuser_936d
Listing Progress
100.00%
MC:
$2.4K
Create My Token
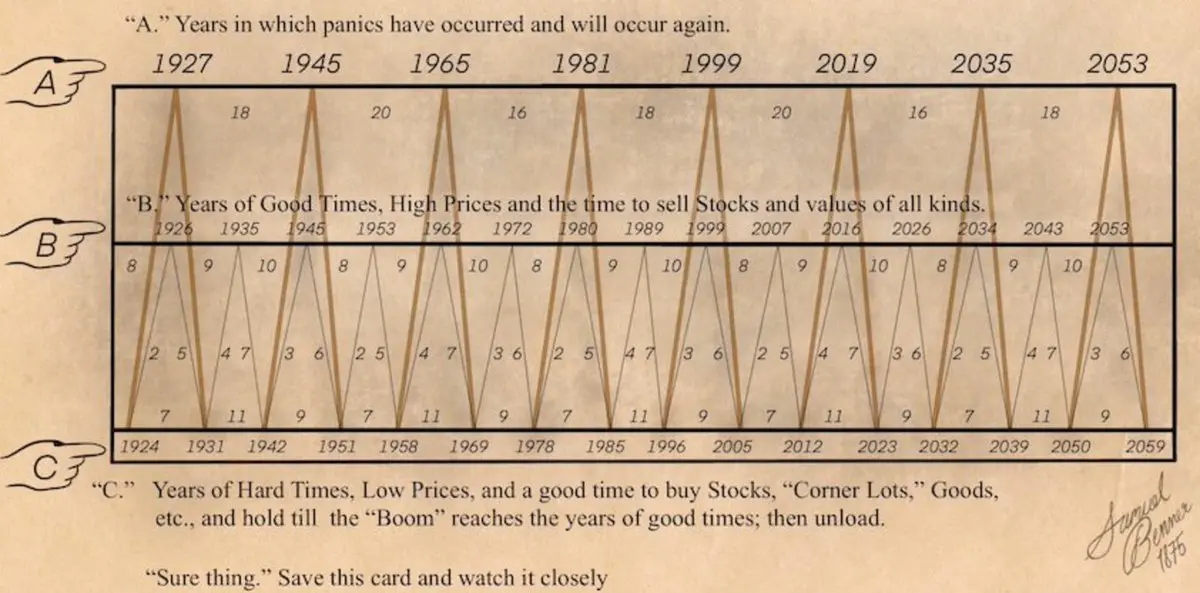
We faded that guy on Reddit Don’t fade this chart 2026Isn’t the year for speculative assets
- Reward
- like
- Comment
- Repost
- Share
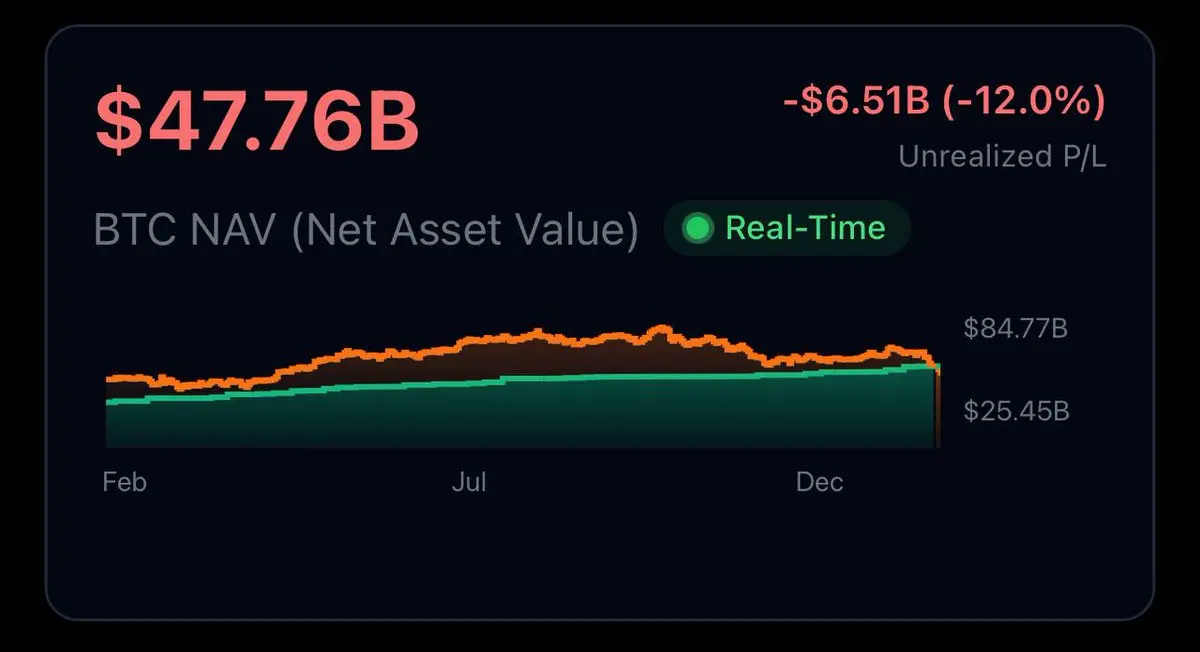
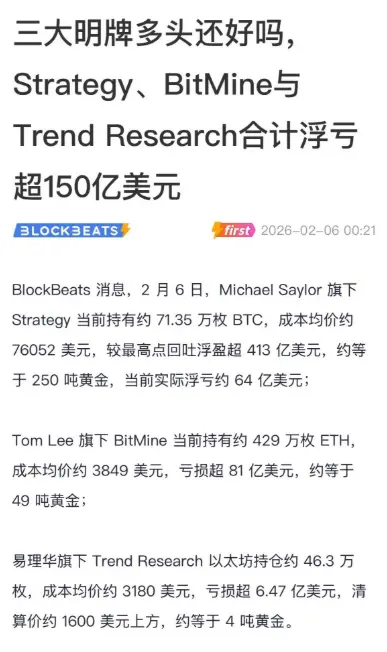
Lost $15 billion, oh my God, isn't their money money? MicroStrategy is pretty stupid; they could have become the biggest Bitcoin whale. They can basically draw the Bitcoin candlestick charts however they want, buying low and selling high. But they just hold onto it. If they bought low and sold high, they would have already made a fortune.
BTC-9.41%
- Reward
- like
- 1
- Repost
- Share
欣欣向荣2688:
Hold on tight, we're about to take off 🛫#BuyTheDipOrWaitNow? #BitcoinHitsBearMarketLow
#WhenWillBTCRebound?
BTC Digital Gold Monetary currency
Buying Digital Gold Monetary
Base Support $BTC 65000~$BTC $ETH dollars
#WhenWillBTCRebound?
BTC Digital Gold Monetary currency
Buying Digital Gold Monetary
Base Support $BTC 65000~$BTC $ETH dollars


- Reward
- like
- Comment
- Repost
- Share
BREAKING: Donald J. Trump just sold 73 Bitcoin. And people thought he would save us or even understand what Bitcoin is.
BTC-9.41%

- Reward
- like
- Comment
- Repost
- Share
Will it go to the moon 🌙 🌙 🌙 🌙 🌙 🌙 🌙 🌙 🌙 🌙 🌙 🌙 🌙 🌙 🌙 🌙 🌙 🌙 🌙 🌙 🌙 🌙 🌙 🌙 🌙 🌙 🌙 🌙 🌙 🌙 🌙 🌙 🌙 🌙 🌙 🌙 🌙 🌙 🌙 🌙 🌙 🌙 🌙 🌙 🌙 🌙 🌙 🌙
View Original

[The user has shared his/her trading data. Go to the App to view more.]
- Reward
- like
- Comment
- Repost
- Share
When you were buying Bitcoin 4 years ago at $67,000 and now you’re still buying Bitcoin at $67,000.
BTC-9.41%
- Reward
- like
- Comment
- Repost
- Share
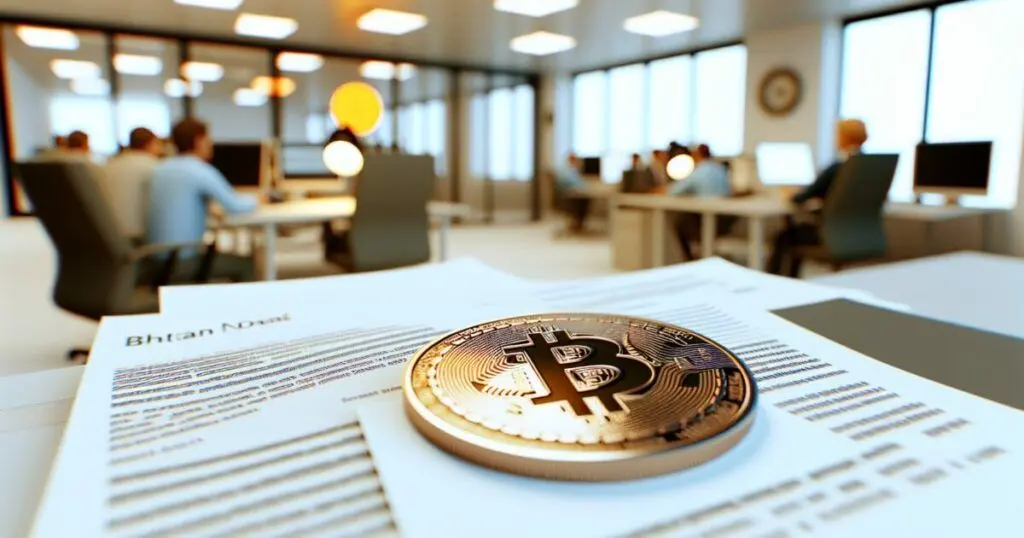
Bhutan Transfers $22 Million Bitcoin Holdings Despite Market Crash - - #bhutan #bhutantransfers #transfers
BTC-9.41%
- Reward
- like
- Comment
- Repost
- Share
mmar
新年快乐
Created By@GateUser-9c264066
Listing Progress
0.00%
MC:
$2.33K
Create My Token
This smooth decline is really rare. Currently, I've bought back about 30% of my position at an average price of around 71,000. Stay steady, we can win.
View Original- Reward
- like
- Comment
- Repost
- Share
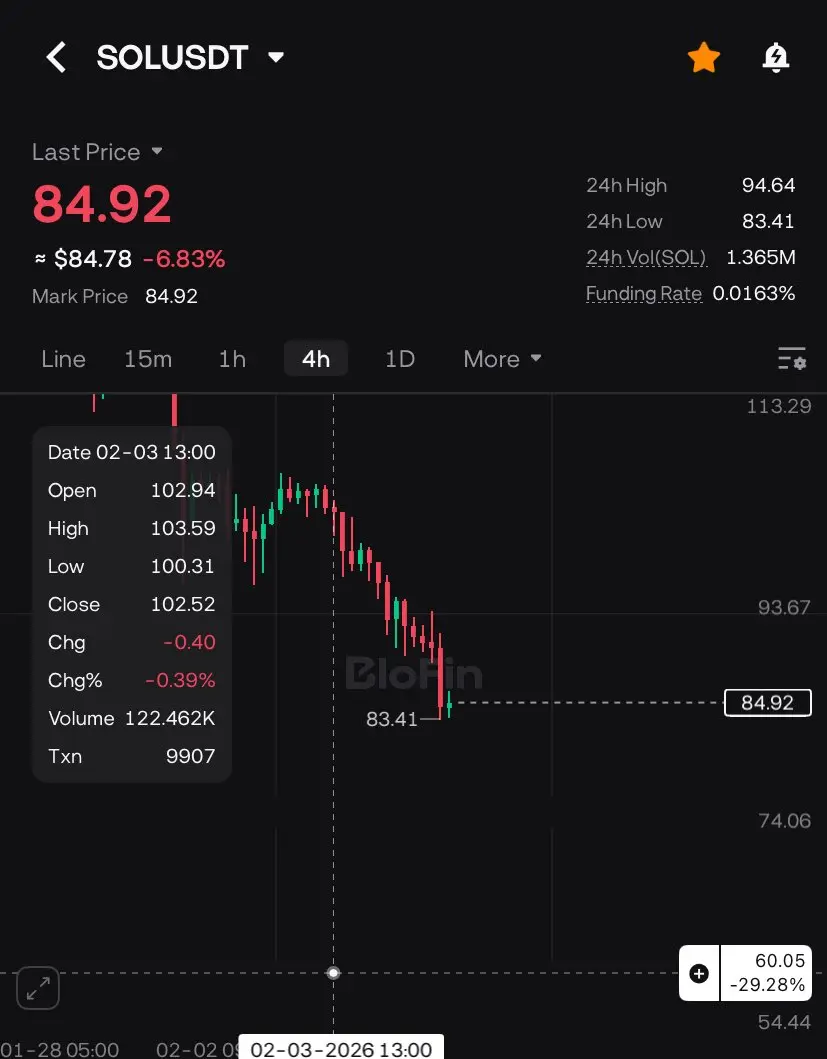
Viewing the Top Market Coins Spot Chart and comparing them
149
- Reward
- like
- Comment
- Repost
- Share
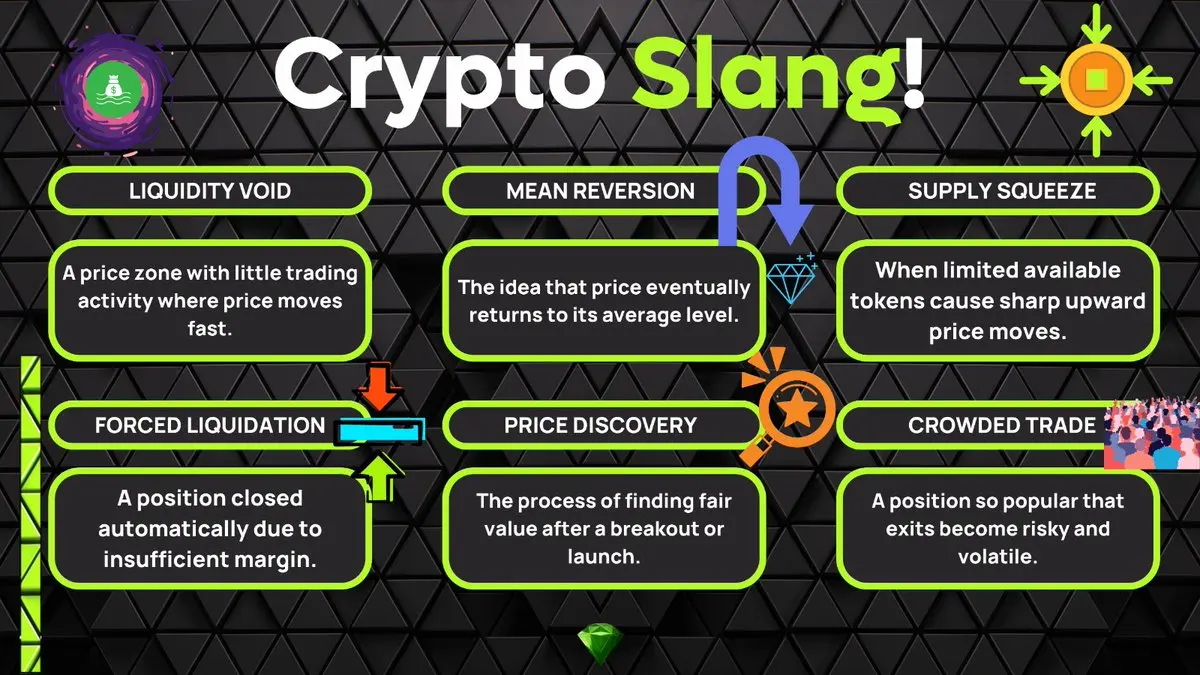
Here are 6 more Crypto Slang words for you to learn and stay ahead of every trading conversation!Share this with a friend who’s new to the Crypto World!
- Reward
- like
- Comment
- Repost
- Share
"Sellers are losing strength"The sellers:
- Reward
- like
- Comment
- Repost
- Share
Today\'s best daily mission @isekaiblade is complete! ✅Conquer your challenges and strengthen your ninja path today🔥Points in every mission: ✨ Easy: 10 points⚔️ Intermediate: 20 points🔥 Hard: 30 points🌪️ Ultra: 40 points🏆 Best: 200 points!#IsekaiBlade #SeiNetwork
- Reward
- like
- Comment
- Repost
- Share
$GT #BuyTheDipOrWaitNow?
GT/USDT, here is a technical analysis focusing on buy-side and sell-side liquidity:
1. Current Trend & Structure
· Trend: Strongly bearish in the short term. Price is trading below the Bollinger Band midline (6.94) and below the Parabolic SAR dots (6.93), confirming downward momentum.
· Price Action: The chart shows a clear breakdown from the 7.17–7.44 resistance zone, now testing near 6.82.
2. Sell-Side Liquidity (SSL)
· Above Price: Liquidity rests above recent swing highs, likely around:
· 7.17 (recent resistance)
· 7.44 (previous high)
· 7.70 (24h high)
· Wh
GT-9.85%
- Reward
- 1
- Comment
- Repost
- Share
Load More
Join 40M users in our growing community
⚡️ Join 40M users in the crypto craze discussion
💬 Engage with your favorite top creators
👍 See what interests you
Trending Topics
View More83.21K Popularity
8.22K Popularity
2.3K Popularity
3.83K Popularity
8.32K Popularity
Hot Gate Fun
View More- MC:$2.34KHolders:10.00%
- MC:$2.33KHolders:10.00%
- MC:$2.35KHolders:10.00%
- MC:$2.47KHolders:20.77%
- MC:$0.1Holders:10.00%
News
View MoreIn the past 4 hours, the entire network has been liquidated by $759 million, with nearly $400 million in BTC liquidations.
3 m
Data: Bitcoin price drops below $66,000, indicating a significant market movement. Investors are advised to monitor the situation closely and consider risk management strategies amid the recent volatility.
10 m
BTC drops below 66,000 USDT
11 m
Data: 11,124,200 wM has been transferred out from GSR Markets, with a total value of approximately 11.12 million USD.
56 m
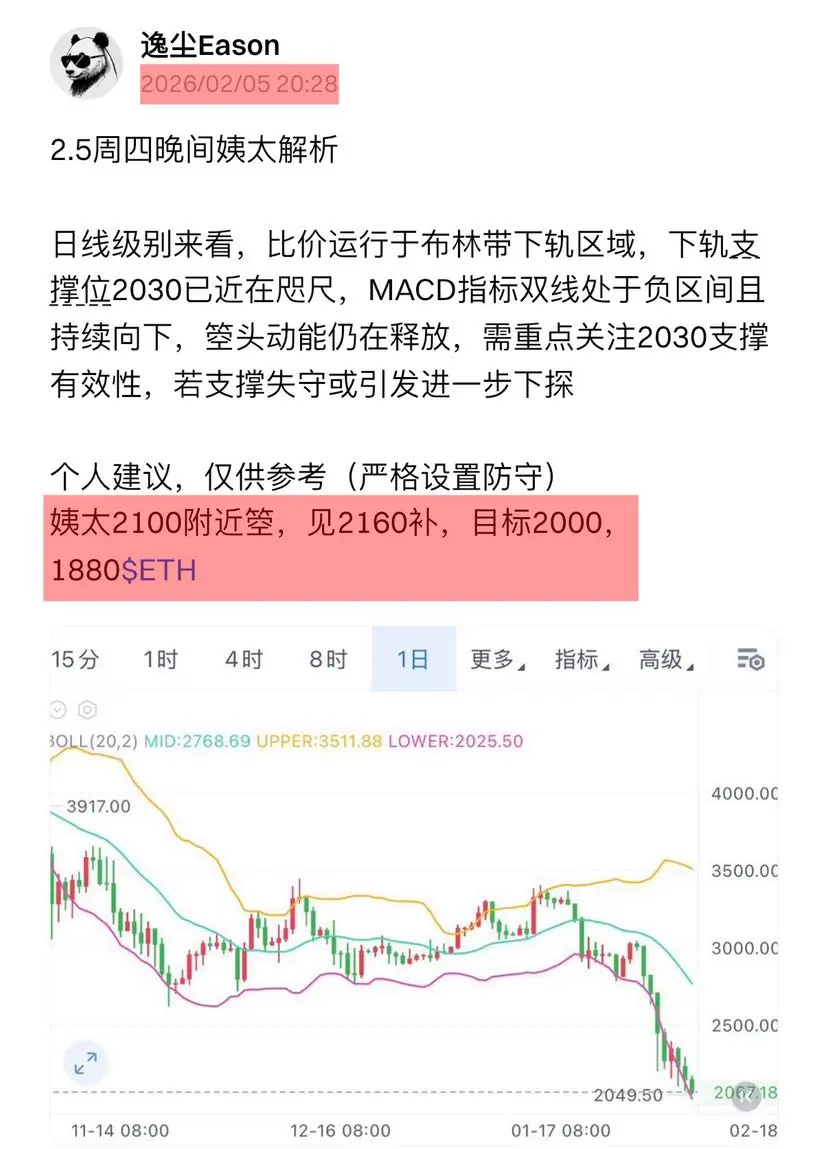
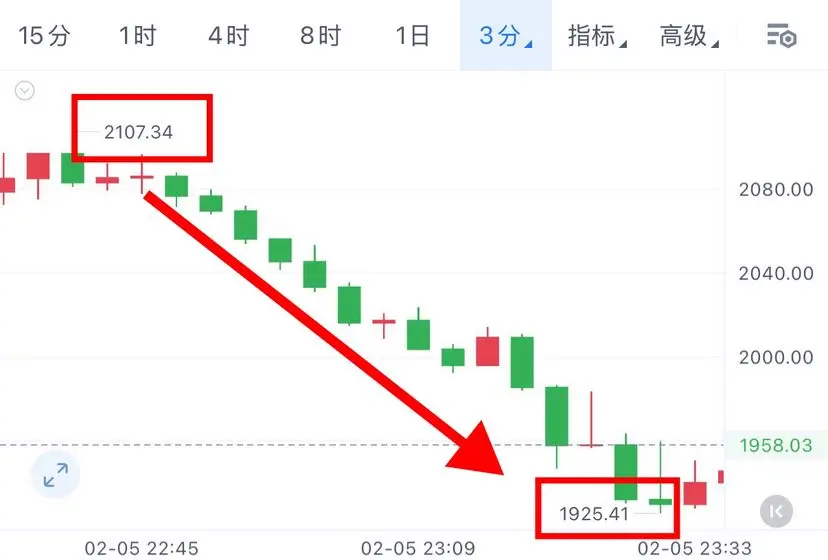
ETH drops below 1950 USDT
1 h
Pin
Gate Square | 2/5 Today's Hot Topic: #BuyTheDipOrWaitNow?
🎁 [Community Perk] Post with the topic or #BTC, 10 lucky users * $100 position Voucher.
Market volatility continues as BTC breaks below the $74,000 key support level, with altcoins pulling back in sync. Are you buying the dip in batches or waiting for a better entry point?
💬 Today’s Discussion:
1️⃣ Bottom Signals: Where do you see BTC’s bottom — $70,000 or lower?
2️⃣ Market Drivers: Which recent macroeconomic news or rumors are influencing the market?
3️⃣ Dark Horses: Are there any resilient or outperforming tokens worth watching?
ShTap to Trade in Gate Square, Win up to 50 GT & Merch!
Click the trading widget in Gate Square content, complete a transaction, and take home 50 GT, Position Experience Vouchers, or exclusive Spring Festival merchandise.
Click the registration link to join
https://www.gate.com/questionnaire/7401
Enter Gate Square daily and click any trading pair or trading card within the content to complete a transaction. The top 10 users by trading volume will win GT, Gate merchandise boxes, position experience vouchers, and more.
The top prize: 50 GT.
![Spring Festival merchandise](https://exampl