Trade
Basic
Futures
Futures
Hundreds of contracts settled in USDT or BTC
TradFi
Gold
Trade global traditional assets with USDT in one place
Options
Hot
Trade European-style vanilla options
Unified Account
Maximize your capital efficiency
Demo Trading
Futures Kickoff
Get prepared for your futures trading
Futures Events
Participate in events to win generous rewards
Demo Trading
Use virtual funds to experience risk-free trading
Earn
Launch
CandyDrop
Collect candies to earn airdrops
Launchpool
Quick staking, earn potential new tokens
HODLer Airdrop
Hold GT and get massive airdrops for free
Launchpad
Be early to the next big token project
Alpha Points
Trade on-chain assets and enjoy airdrop rewards!
Futures Points
Earn futures points and claim airdrop rewards
Investment
Simple Earn
Earn interests with idle tokens
Auto-Invest
Auto-invest on a regular basis
Dual Investment
Buy low and sell high to take profits from price fluctuations
Soft Staking
Earn rewards with flexible staking
Crypto Loan
0 Fees
Pledge one crypto to borrow another
Lending Center
One-stop lending hub
VIP Wealth Hub
Customized wealth management empowers your assets growth
Private Wealth Management
Customized asset management to grow your digital assets
Quant Fund
Top asset management team helps you profit without hassle
Staking
Stake cryptos to earn in PoS products
Smart Leverage
New
No forced liquidation before maturity, worry-free leveraged gains
GUSD Minting
Use USDT/USDC to mint GUSD for treasury-level yields
More
Don't guess randomly when bottoming out Bitcoin! "This indicator" has accurately identified the bottom of previous bear markets.
2h ago
JPMorgan: Bitcoin futures are oversold, and gold is expected to reach $8,500.
7h ago
Trending Topics
View More151.45K Popularity
11.86K Popularity
393.84K Popularity
2.39K Popularity
15.08K Popularity
Hot Gate Fun
View More- MC:$0.1Holders:10.00%
- MC:$2.4KHolders:10.00%
- MC:$0.1Holders:00.00%
- MC:$2.42KHolders:10.00%
- MC:$2.42KHolders:00.00%
Pin
Don't guess randomly when bottoming out Bitcoin! "This indicator" has accurately identified the bottom of previous bear markets.
In the cryptocurrency market, “bottom fishing” is an extremely tempting yet highly risky game. If you are also passionate about finding market turning points, this on-chain indicator that has been tested through multiple bull and bear cycles might become your “North Star” for accurately identifying bottoms in a bear market. This indicator is called “Bitcoin Profit and Loss Supply,” mainly used to measure the overall profit and loss status of coin holders in the market — how many Bitcoins are still showing profits on paper, and how many are trapped in unrealized losses. Historical data repeatedly proves that when the “Profit Bitcoin Supply” and the “Loss Bitcoin Supply” trend toward balance, or even intersect on the chart, it often signals that the bear market bottom has formed, indicating that the market has entered the final stage of “capitulation selling,” and the long-term strategic window of opportunity is opening. For bullish investors hoping for a return to a bull market, good news may be just around the corner. Data shows that the number of profit chips and loss chips is showing a trend of about to “intersect.” According to Glassnode statistics, approximately 11 million Bitcoins are currently in profit, meaning these holdings are acquired at a lower cost than the current market price; at the same time, about 8.9 million Bitcoins are in loss. The gap between the two is narrowing, and if this convergence trend continues, it could reenact the bottoming scripts of 2022 and 2018-19.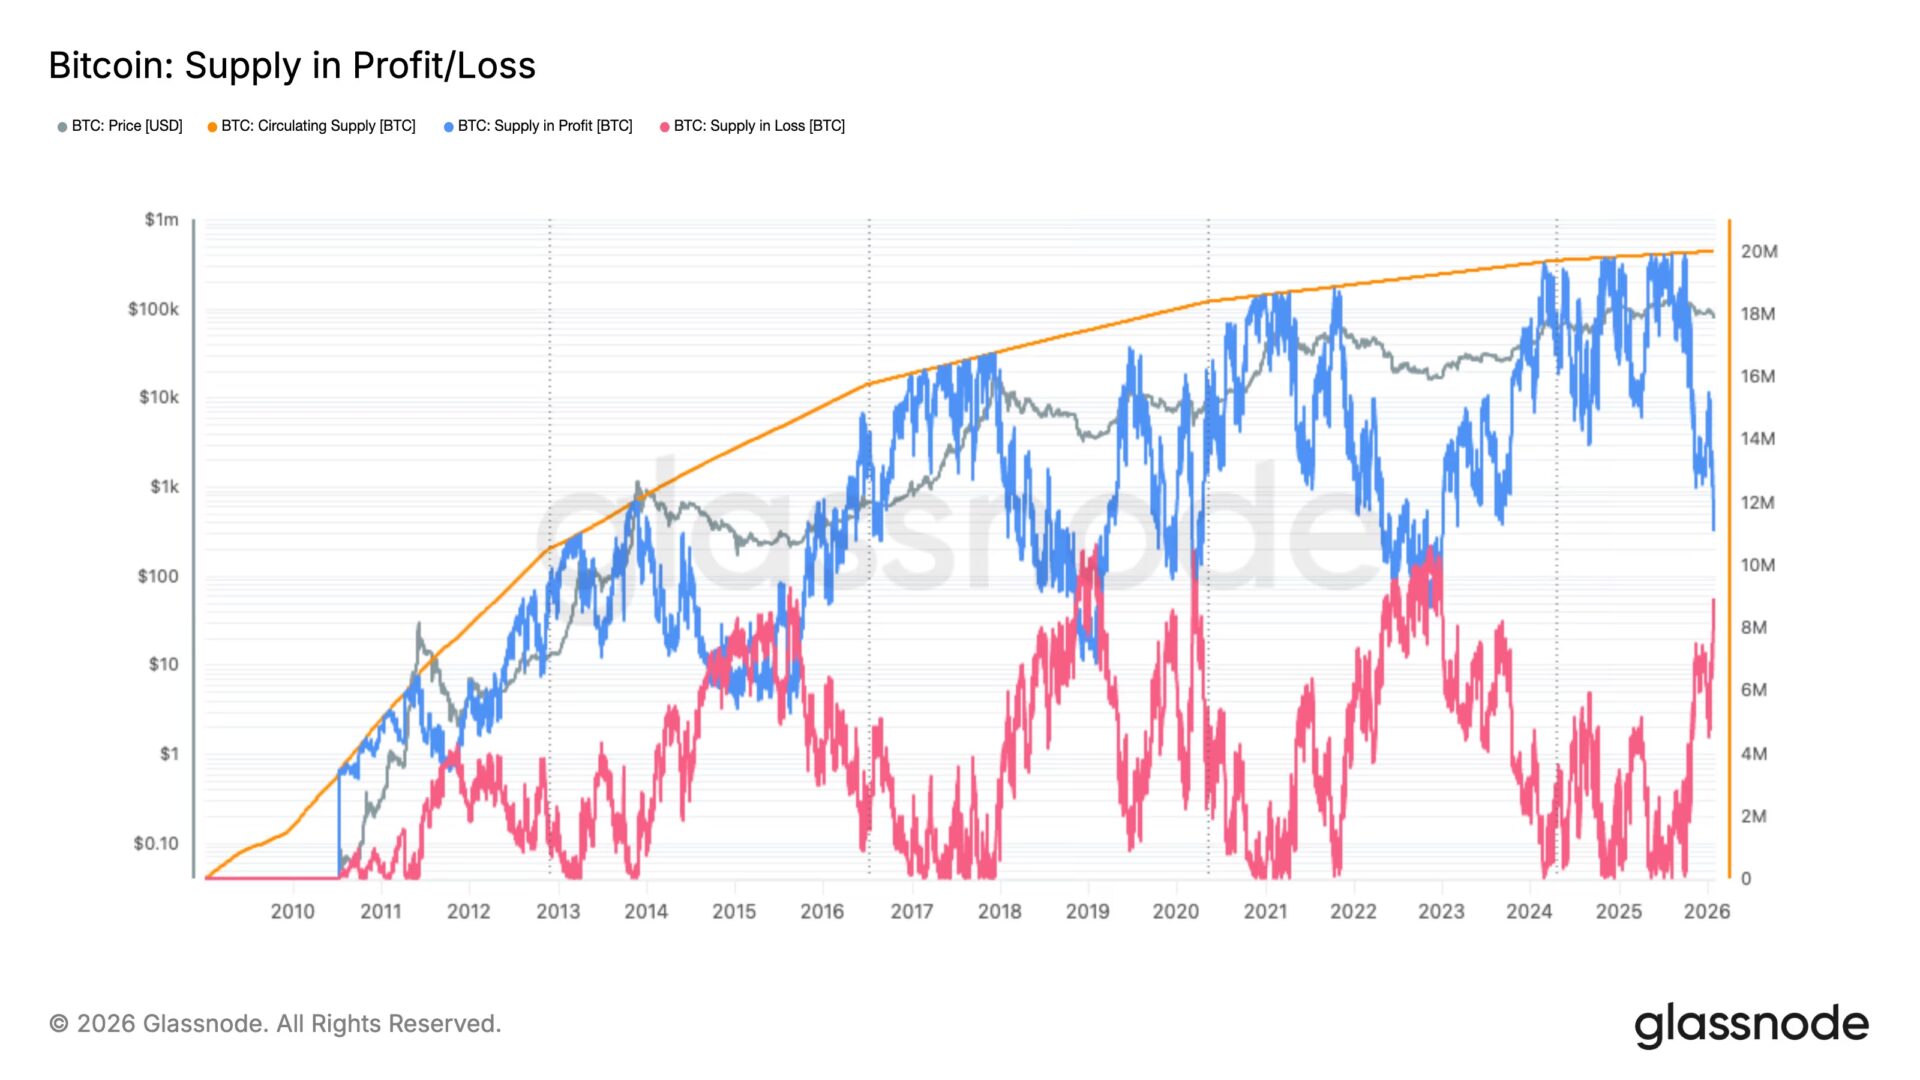 In Glassnode’s analysis chart, the blue line represents the “Profit Supply,” while the red line represents the “Loss Supply.”
When Bitcoin’s spot price fluctuates, moving around the overall cost basis of investors’ holdings, the chips will flow between these two camps. By observing the rise and fall of these two lines, we can gain deep insights into the market’s holding structure and the stress test faced by investors.
Looking back at past cycles, the “intersecting points” of these two lines have accurately marked the bear market bottoms multiple times:
In Glassnode’s analysis chart, the blue line represents the “Profit Supply,” while the red line represents the “Loss Supply.”
When Bitcoin’s spot price fluctuates, moving around the overall cost basis of investors’ holdings, the chips will flow between these two camps. By observing the rise and fall of these two lines, we can gain deep insights into the market’s holding structure and the stress test faced by investors.
Looking back at past cycles, the “intersecting points” of these two lines have accurately marked the bear market bottoms multiple times: