Trade
Basic
Futures
Futures
Hundreds of contracts settled in USDT or BTC
TradFi
Gold
Trade global traditional assets with USDT in one place
Options
Hot
Trade European-style vanilla options
Unified Account
Maximize your capital efficiency
Demo Trading
Futures Kickoff
Get prepared for your futures trading
Futures Events
Participate in events to win generous rewards
Demo Trading
Use virtual funds to experience risk-free trading
Earn
Launch
CandyDrop
Collect candies to earn airdrops
Launchpool
Quick staking, earn potential new tokens
HODLer Airdrop
Hold GT and get massive airdrops for free
Launchpad
Be early to the next big token project
Alpha Points
Trade on-chain assets and enjoy airdrop rewards!
Futures Points
Earn futures points and claim airdrop rewards
Investment
Simple Earn
Earn interests with idle tokens
Auto-Invest
Auto-invest on a regular basis
Dual Investment
Buy low and sell high to take profits from price fluctuations
Soft Staking
Earn rewards with flexible staking
Crypto Loan
0 Fees
Pledge one crypto to borrow another
Lending Center
One-stop lending hub
VIP Wealth Hub
Customized wealth management empowers your assets growth
Private Wealth Management
Customized asset management to grow your digital assets
Quant Fund
Top asset management team helps you profit without hassle
Staking
Stake cryptos to earn in PoS products
Smart Leverage
New
No forced liquidation before maturity, worry-free leveraged gains
GUSD Minting
Use USDT/USDC to mint GUSD for treasury-level yields
More
AShengWang
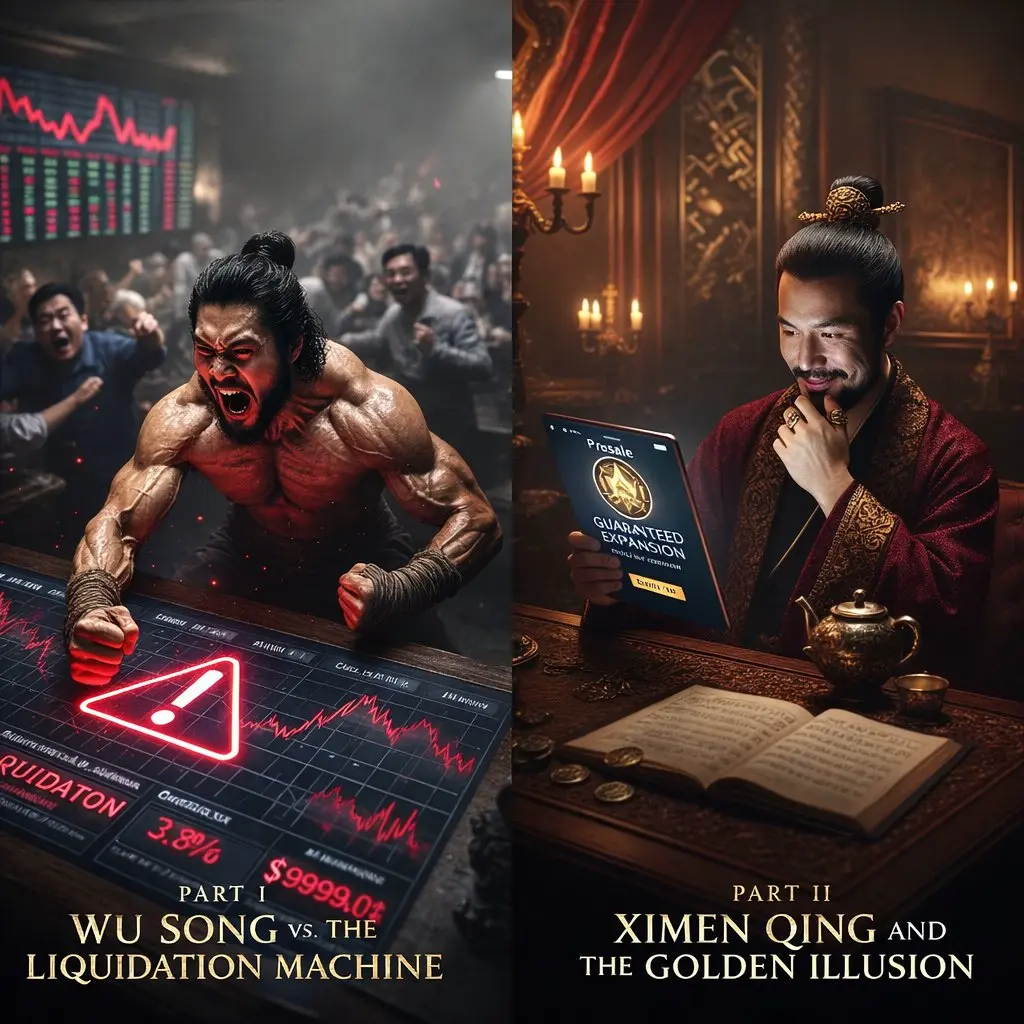
🎬 What If Wu Song Faced a 2026 Liquidation Bot — and X Wallet Was the Only Way Out?
Short Synopsis:
Wu Song, famous for killing a tiger with bare hands, now faces a different beast — a 100x leverage liquidation algorithm.
At the same time, in a quiet chamber, Ximen Qing believes he has found the perfect investment in a shiny new token presale.
Both think they are in control.
Both are about to discover that modern monsters don’t bleed.
⚔ Part I — Wu Song vs. The Liquidation Machine
Wu Song once crushed a tiger’s skull with his fists.
In 2026, the tiger has changed form.
It lives inside a tradi
- Reward
- 2
- Comment
- Repost
- Share


- Reward
- 2
- Comment
- Repost
- Share
Participate in horse racing betting, complete tasks to earn horse racing tickets, and enjoy a million red envelope rain daily, sharing a prize pool of 100,000 USDT at the Gate 2026 Spring Festival Celebration. https://www.gate.com/competition/year-of-horse-2026?ref_type=165&utm_cmp=7EQB9Jba&ref=VLVDUQXCUW
View Original
- Reward
- 1
- Comment
- Repost
- Share
p小将
p小将
Created By@DreamJourney
Listing Progress
100.00%
MC:
$1.76K
More Tokens
BTC ETH Market Prediction
0
- Reward
- like
- Comment
- Repost
- Share

- Reward
- 2
- Comment
- Repost
- Share
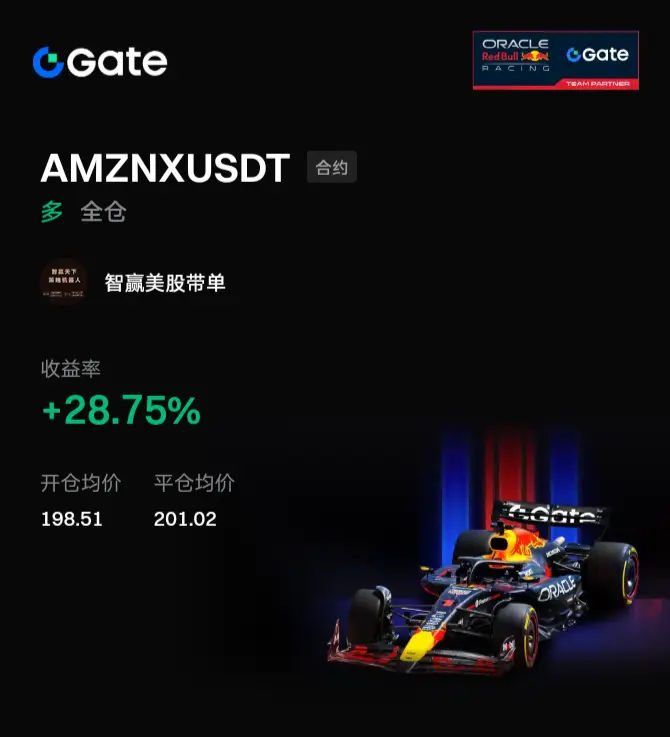
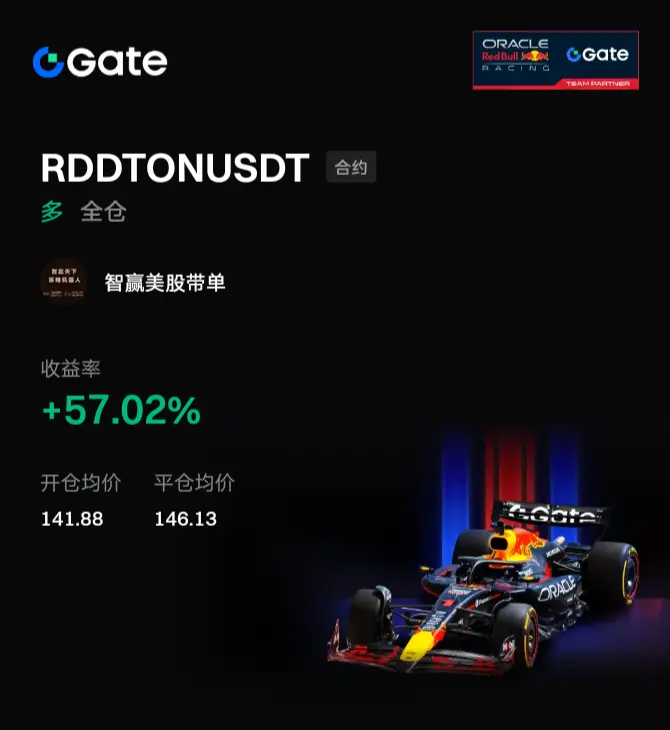
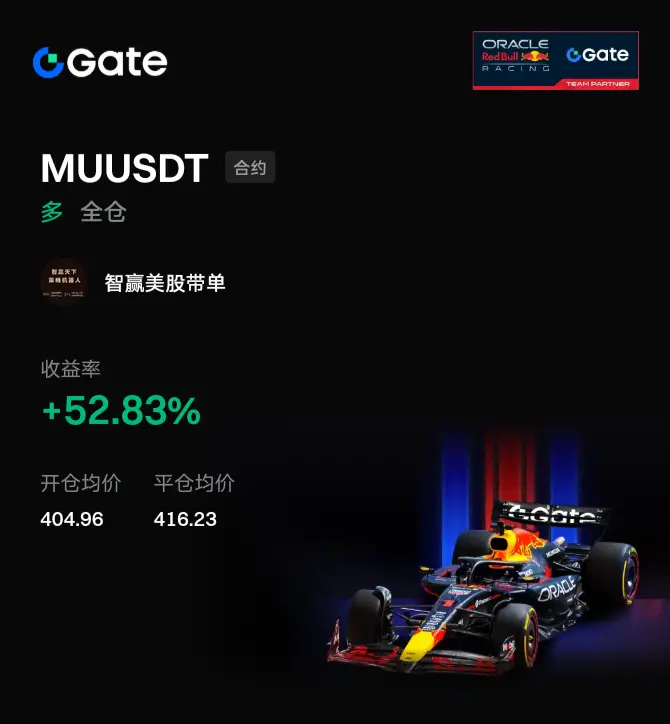
US stock profit-taking series, students copy homework and achieve a passive income life!
Strategy: Smart Win World Strategy Robot "ZYTX GKDD V9"
Use Trading View Smart Win World indicator strategy to create "Signal Robot" and "Composite Indicator" robots, quickly become a quantitative expert in one day, and achieve a free life in one month.
#带着Gate去旅行
#GateTravel旅行分享官
#智赢天下TradingView指标
#智赢天下TradingView策略机器人
View OriginalStrategy: Smart Win World Strategy Robot "ZYTX GKDD V9"
Use Trading View Smart Win World indicator strategy to create "Signal Robot" and "Composite Indicator" robots, quickly become a quantitative expert in one day, and achieve a free life in one month.
#带着Gate去旅行
#GateTravel旅行分享官
#智赢天下TradingView指标
#智赢天下TradingView策略机器人
- Reward
- 3
- 1
- Repost
- Share
WinTheWorldWithWisdo :
:
U.S. stock profit-taking series, students copy homework and achieve a passive income life! Strategy: Smart Win the World Strategy Robot 《ZYTX GKDD V9》
Using Trading View Smart Win the World indicator strategy, creating 《Signal Robot》 and 《Composite Indicator》 robots, quickly becoming a quantitative expert in one day, achieving a free life in one month.
#Travel with Gate
#GateTravel Travel Sharing Officer
#Smart Win the World TradingView Indicator
#Smart Win the World TradingView Strategy Robot
Participate in horse racing betting, complete tasks to earn horse racing tickets, and enjoy a million red envelope rain daily, sharing a prize pool of 100,000 USDT at Gate 2026 Spring Festival Celebration. https://www.gate.com/competition/year-of-horse-2026?ref_type=165&utm_cmp=7EQB9Jba&ref=BQAXAVFW
View Original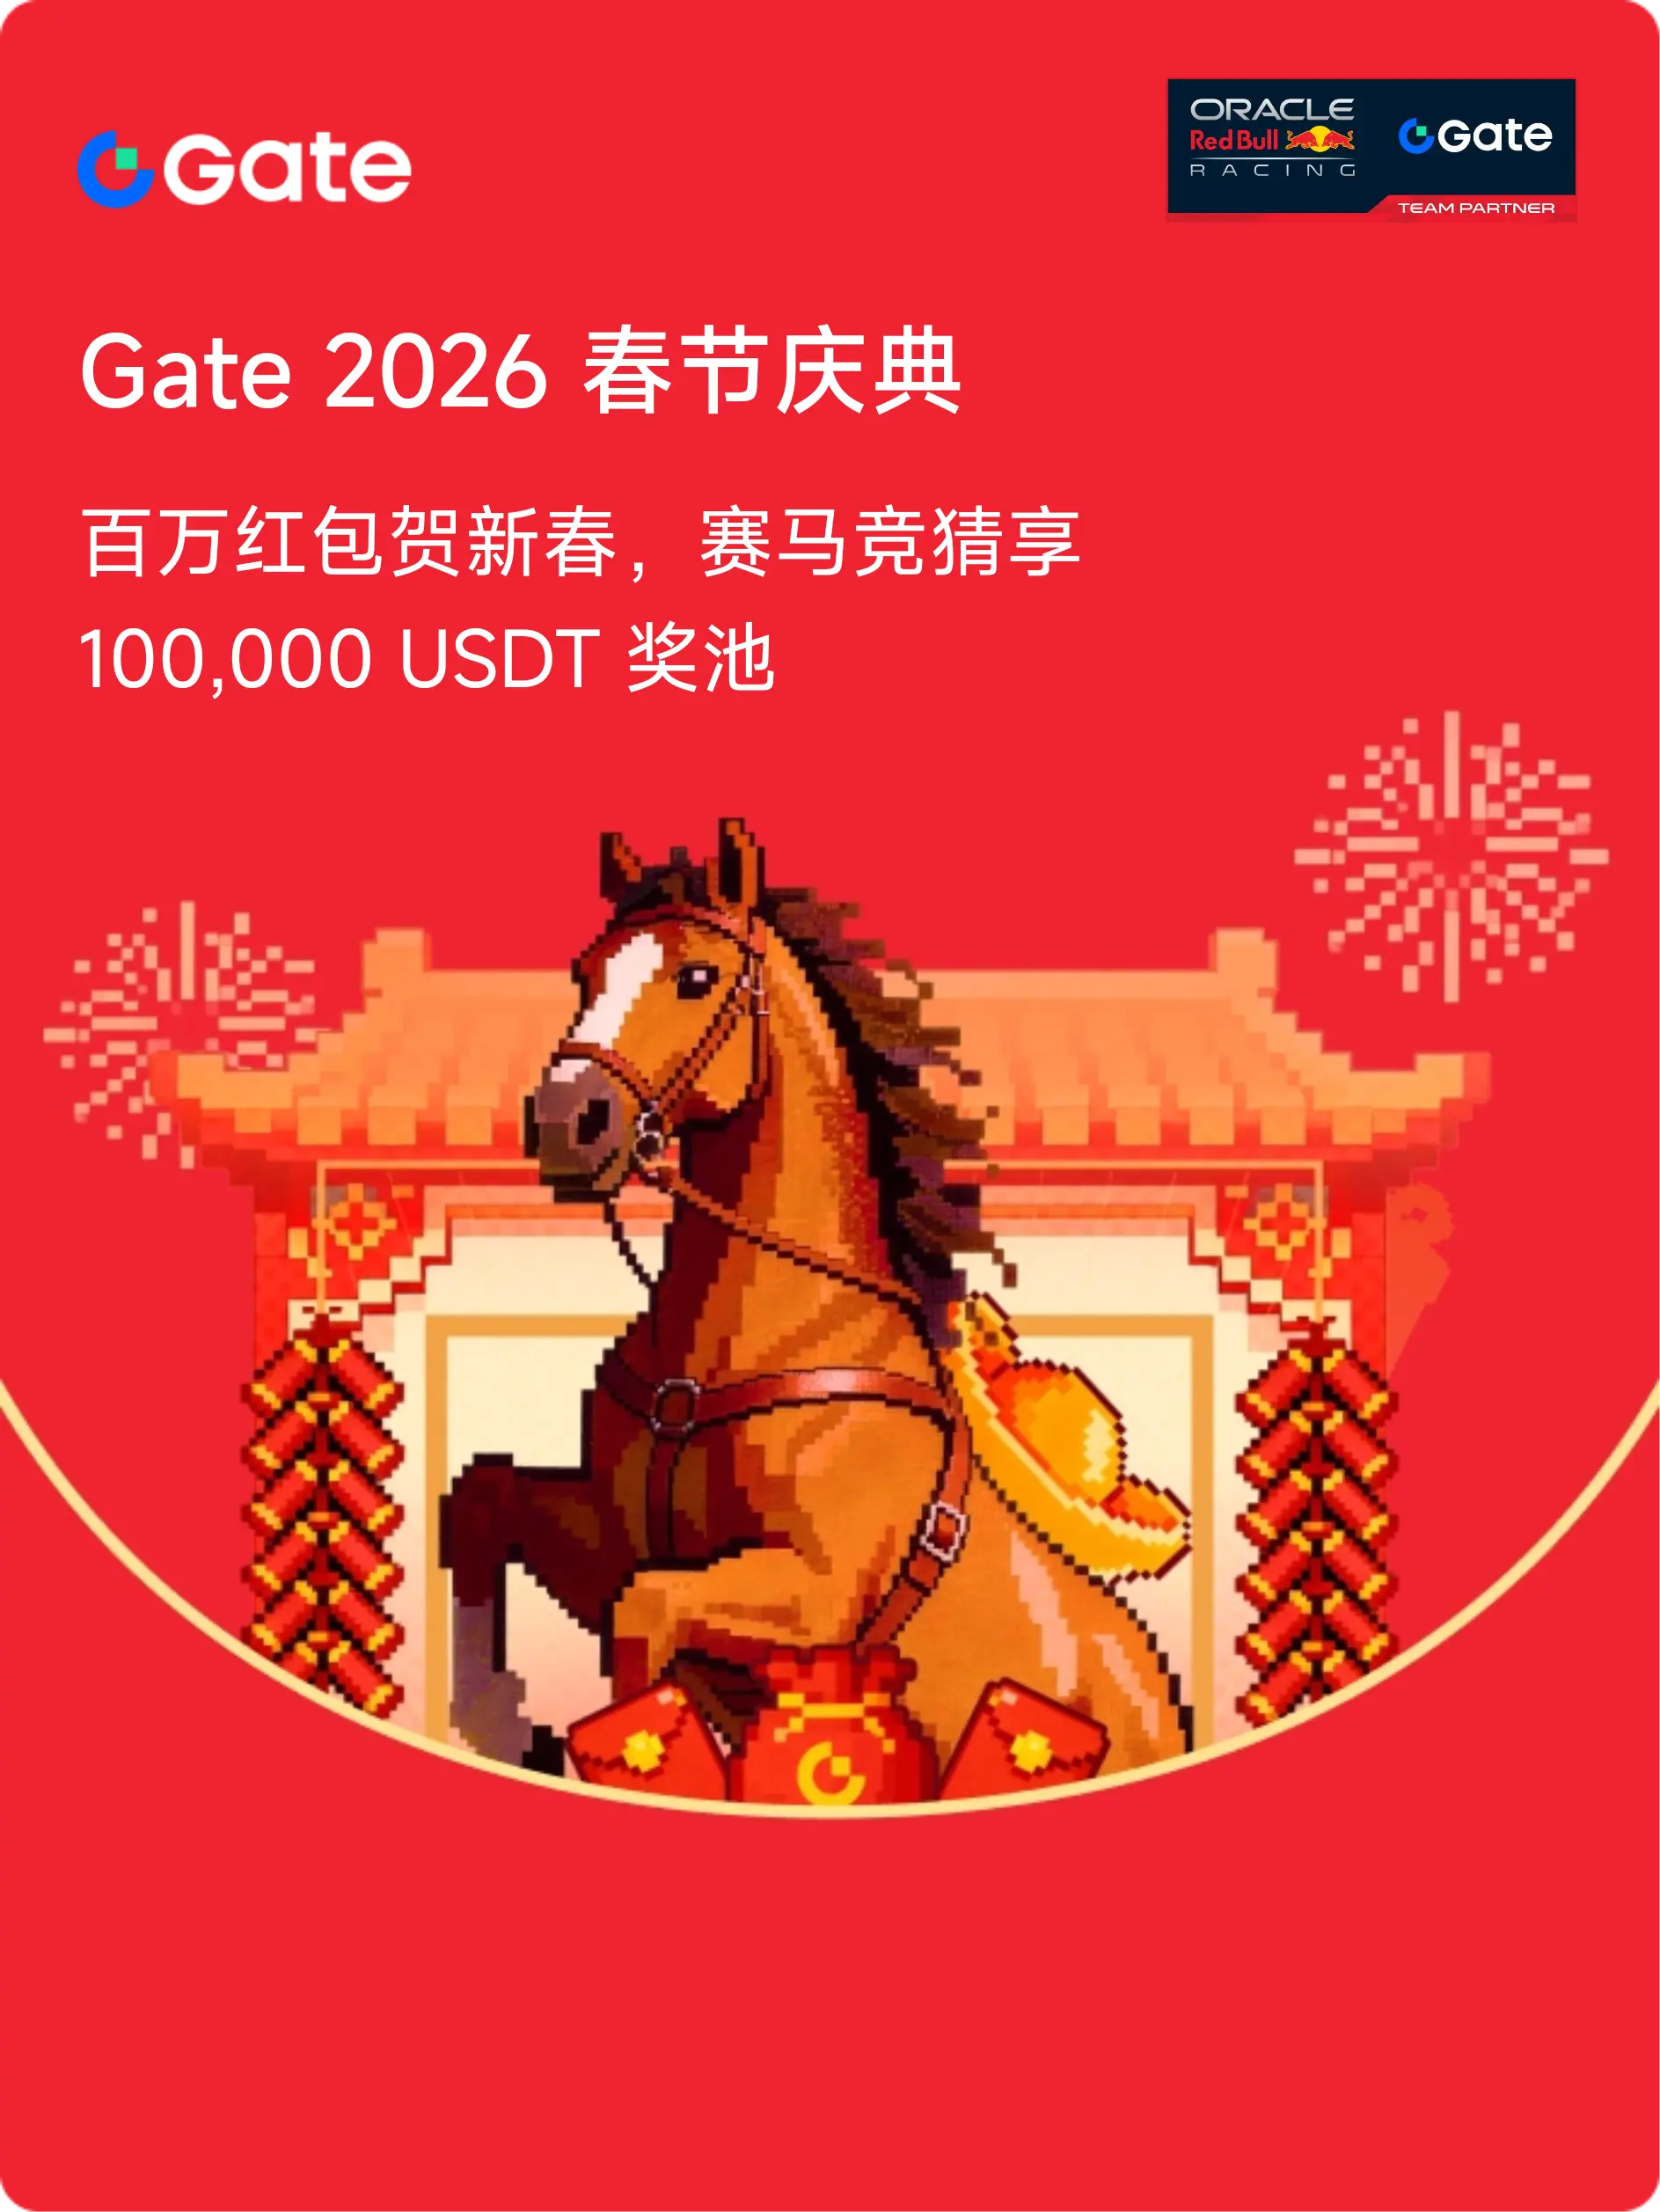
- Reward
- 1
- Comment
- Repost
- Share
Gate Live 2026 Lunar New Year On-Chain Gala · Non-Stop Market Insights https://www.gate.com/campaigns/3937?ref=VQIRVFPZBA&ref_type=132
- Reward
- 1
- Comment
- Repost
- Share
#BiggestCryptoOutflowsSince2022 $BTC recovery momentum from support, btc aiming for 70k target.
Plan trade: Long
Entry zone: 66.3k - 67.6k
Take profit:
🎯TP1: 67.7k
🎯TP2: 68.8k
🎯TP3: 70k
Stop loss: 65.2k
$BTC bottomed at 65.5k. On H1, price crossed above EMA50 with rising RSI. A short-term recovery trend is forming as selling pressure weakens at a key support level.
Plan trade: Long
Entry zone: 66.3k - 67.6k
Take profit:
🎯TP1: 67.7k
🎯TP2: 68.8k
🎯TP3: 70k
Stop loss: 65.2k
$BTC bottomed at 65.5k. On H1, price crossed above EMA50 with rising RSI. A short-term recovery trend is forming as selling pressure weakens at a key support level.
BTC1,24%


- Reward
- 2
- Comment
- Repost
- Share
Whale Alert founder BTC unrealized profit levels have fallen back to late 2023 levels is the three year profit cycle approaching a key inflection point?
381
- Reward
- 1
- 1
- Repost
- Share
ybaser:
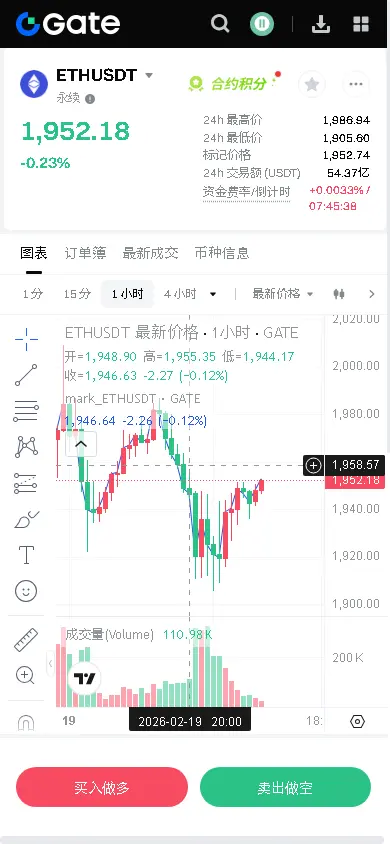
2026 GOGOGO 👊【$ETH Signal】1H timeframe stabilizing rebound, watch for key resistance breakout
$ETH The 1H timeframe is oscillating within the 1940-1950 range, with prices closely testing the 1H EMA20 (1946.87) repeatedly. The 4H timeframe remains in a downtrend, but the latest 4H candlestick shows a lower shadow, indicating buying support in the 1900-1910 area. Currently, prices are declining but open interest remains stable, suggesting not a main force distribution but rather a liquidation after a bullish blow-up. The 1H RSI (48.08) is in a neutral to slightly weak zone, leaving room for a rebound correct
View Original$ETH The 1H timeframe is oscillating within the 1940-1950 range, with prices closely testing the 1H EMA20 (1946.87) repeatedly. The 4H timeframe remains in a downtrend, but the latest 4H candlestick shows a lower shadow, indicating buying support in the 1900-1910 area. Currently, prices are declining but open interest remains stable, suggesting not a main force distribution but rather a liquidation after a bullish blow-up. The 1H RSI (48.08) is in a neutral to slightly weak zone, leaving room for a rebound correct
- Reward
- 2
- Comment
- Repost
- Share
特斯马
TSM
Created By@NorthWarm
Listing Progress
100.00%
MC:
$11.31K
More Tokens
We better thank this lil guy with at least $500m market cap
- Reward
- like
- Comment
- Repost
- Share
Participate in horse racing betting, complete tasks to earn horse racing tickets, and enjoy a million red envelope rain daily, sharing a prize pool of 100,000 USDT at the Gate 2026 Spring Festival Celebration. https://www.gate.com/competition/year-of-horse-2026?ref_type=165&utm_cmp=7EQB9Jba&ref=VLREVFSJVQ
View Original
- Reward
- 2
- Comment
- Repost
- Share
#CelebratingNewYearOnGateSquare ✨ #CelebratingNewYearOnGateSquare ✨
As the new year begins, I pause for a moment of reflection — not just on charts, trades, or market cycles, but on growth, resilience, and the journey itself. This year feels different. It feels intentional. It feels powerful. And celebrating it on Gate Square makes it even more meaningful.
The past year taught me that success in crypto is not built overnight. It is built in silence, in discipline, in patience, and in the courage to hold when others panic. Every dip carried a lesson. Every breakout carried a reminder. And every
- Reward
- 2
- Comment
- Repost
- Share
Participate in horse racing betting, complete tasks to earn horse racing tickets, and enjoy a million red envelope rain daily, sharing a prize pool of 100,000 USDT at the Gate 2026 Spring Festival Celebration. https://www.gate.com/competition/year-of-horse-2026?ref_type=165&utm_cmp=7EQB9Jba&ref=VQVBVF0MBG
View Original
- Reward
- like
- Comment
- Repost
- Share
I think that i got rugged in some coins....but i'm not sure
- Reward
- 2
- Comment
- Repost
- Share
Join the horse racing predictions, complete tasks to earn horse racing tickets, enjoy daily million Gift Coins giveaways, and share a 100,000 USDT prize pool—all at the Gate 2026 Spring Festival Celebration. https://www.gate.com/competition/year-of-horse-2026?ref_type=165&utm_cmp=7EQB9Jba&ref=VQVGVATEVA

- Reward
- 4
- Comment
- Repost
- Share
Participate in horse racing betting, complete tasks to earn horse racing tickets, and enjoy a million red envelope rain daily, sharing a prize pool of 100,000 USDT at the Gate 2026 Spring Festival Celebration. https://www.gate.com/competition/year-of-horse-2026?ref_type=165&utm_cmp=7EQB9Jba&ref=VGBNXFFEUG
View Original
- Reward
- 2
- Comment
- Repost
- Share
Participate in horse racing betting, complete tasks to earn horse racing tickets, and enjoy a million red envelope rain daily, sharing a prize pool of 100,000 USDT at the Gate 2026 Spring Festival Celebration. https://www.gate.com/competition/year-of-horse-2026?ref_type=165&utm_cmp=7EQB9Jba&ref=VQVNUFPYVG
View Original
- Reward
- 2
- Comment
- Repost
- Share
Load More
Join 40M users in our growing community
⚡️ Join 40M users in the crypto craze discussion
💬 Engage with your favorite top creators
👍 See what interests you
Trending Topics
View More239.72K Popularity
867.3K Popularity
58.94K Popularity
96.35K Popularity
506.8K Popularity
Hot Gate Fun
View More- MC:$2.44KHolders:10.00%
- MC:$2.44KHolders:10.00%
- MC:$2.43KHolders:00.00%
- MC:$0.1Holders:10.00%
- MC:$2.43KHolders:10.00%
News
View MoreNVIDIA is about to complete its $30 billion investment in OpenAI
6 m
Data: If BTC drops below $63,957, the total long liquidation strength on mainstream CEXs will reach $1.094 billion.
7 m
Data: If ETH drops below $1,865, the total long liquidation strength on major CEXs will reach $867 million.
8 m
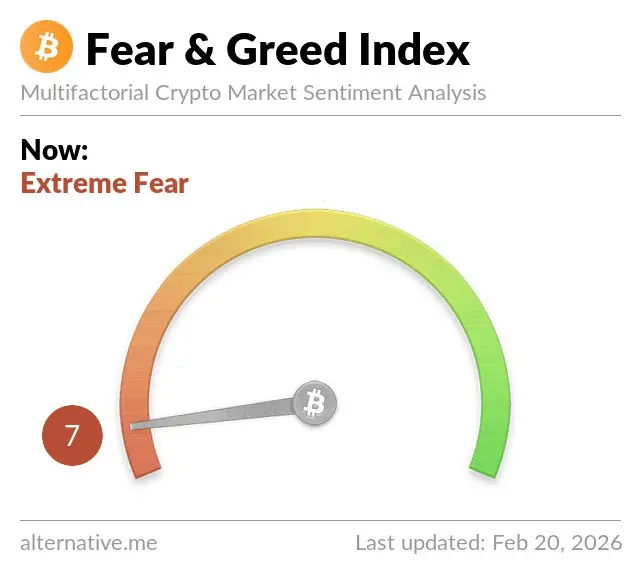
Today, the Fear and Greed Index dropped to 7, and the market is in an "extreme fear" state.
8 m
Vitalik: Ethereum's goal is to enable human freedom; extending the feedback loop between humans and AI "is not a good thing."
18 m
Pin