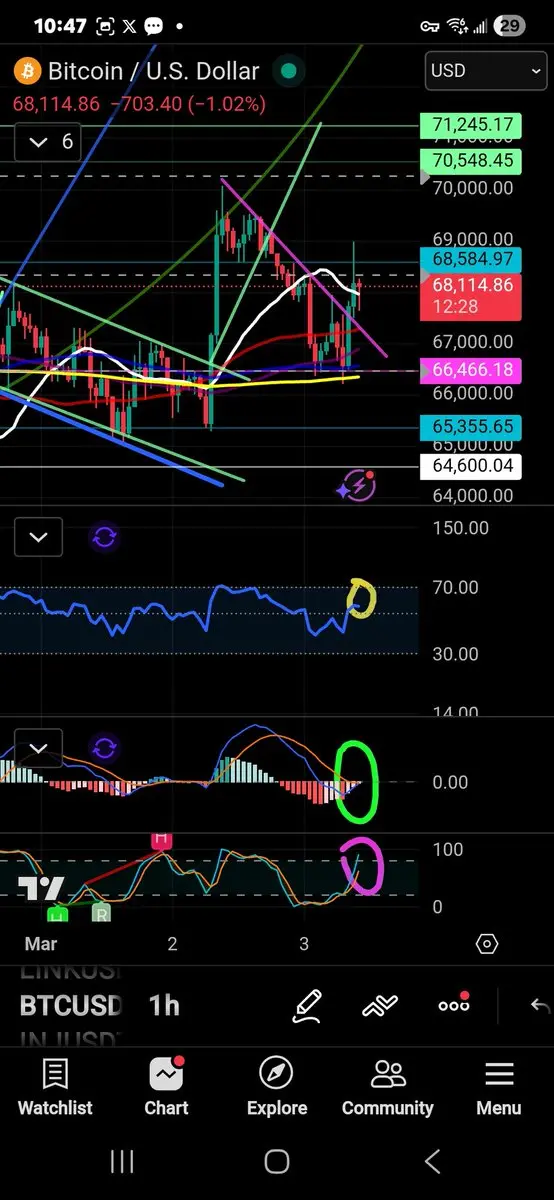
$BTC 1Hr Chart + Indicators Say Bullish Momentum Is Near
In the top of the picture we can see that the pink downtrend has been broken to the upside.
Price action has also bullishly retested the 1hr 200MA.
Below in the yellow circle we can see the RSI in the bullish zone above 50 at 57. 👍
The green circle is the MACD it is looking ready to make a bullish move to the upside.
The MACD is right at 0 showing fading selling pressure ready to breakout into the bullish territory above 0.
The pink circle is on the stochastic RSI showing increasing momentum into the overbought range.
Yes the overbou