Trade
Trading Type
Spot
Trade crypto freely
Alpha
Points
Get promising tokens in streamlined on-chain trading
Pre-Market
Trade new tokens before they are officially listed
Margin
Magnify your profit with leverage
Convert & Block Trading
0 Fees
Trade any size with no fees and no slippage
Leveraged Tokens
Get exposure to leveraged positions simply
Futures
Futures
Points
Hundreds of contracts settled in USDT or BTC
Options
HOT
Trade European-style vanilla options
Unified Account
Maximize your capital efficiency
Demo Trading
Futures Kickoff
Get prepared for your futures trading
Futures Events
Participate in events to win generous rewards
Demo Trading
Use virtual funds to experience risk-free trading
Earn
Launch
CandyDrop
Collect candies to earn airdrops
Launchpool
Quick staking, earn potential new tokens
HODLer Airdrop
Hold GT and get massive airdrops for free
Launchpad
Be early to the next big token project
Alpha Points
New
Trade on-chain assets and enjoy airdrop rewards!
Futures Points
New
Earn futures points and claim airdrop rewards
Investment
Simple Earn
Earn interests with idle tokens
Auto-Invest
Auto-invest on a regular basis
Dual Investment
Buy low and sell high to take profits from price fluctuations
Soft Staking
Earn rewards with flexible staking
Crypto Loan
0 Fees
Pledge one crypto to borrow another
Lending Center
One-Stop Lending Hub
VIP Wealth Hub
New
Customized wealth management empowers your assets growth
Private Wealth Management
Customized asset management to grow your digital assets
Quant Fund
Top asset management team helps you profit without hassle
Staking
Stake cryptos to earn in PoS products
BTC Staking
HOT
Stake BTC and earn 10% APR
GUSD Minting
New
Use USDT/USDC to mint GUSD for treasury-level yields
More


MiaoLaobiao
No content yet
MiaoLaobiao
BTC Trend
Currently still in a daily chart downtrend structure since the 126,000 high point.
Recently, a quick rebound from 101,500 to 114,000 was followed by another weak pullback.
The price was blocked near the EMA30, repeatedly testing and failing, indicating strong selling pressure above.
Signs of a continuation of the downtrend after failed rebounds are now appearing.
MACD
BTC & ETH daily MACD remains below the zero line, with the red histogram weakening → signal of rebound failure
DIF/DEA are opening downward again, indicating an ongoing bearish trend
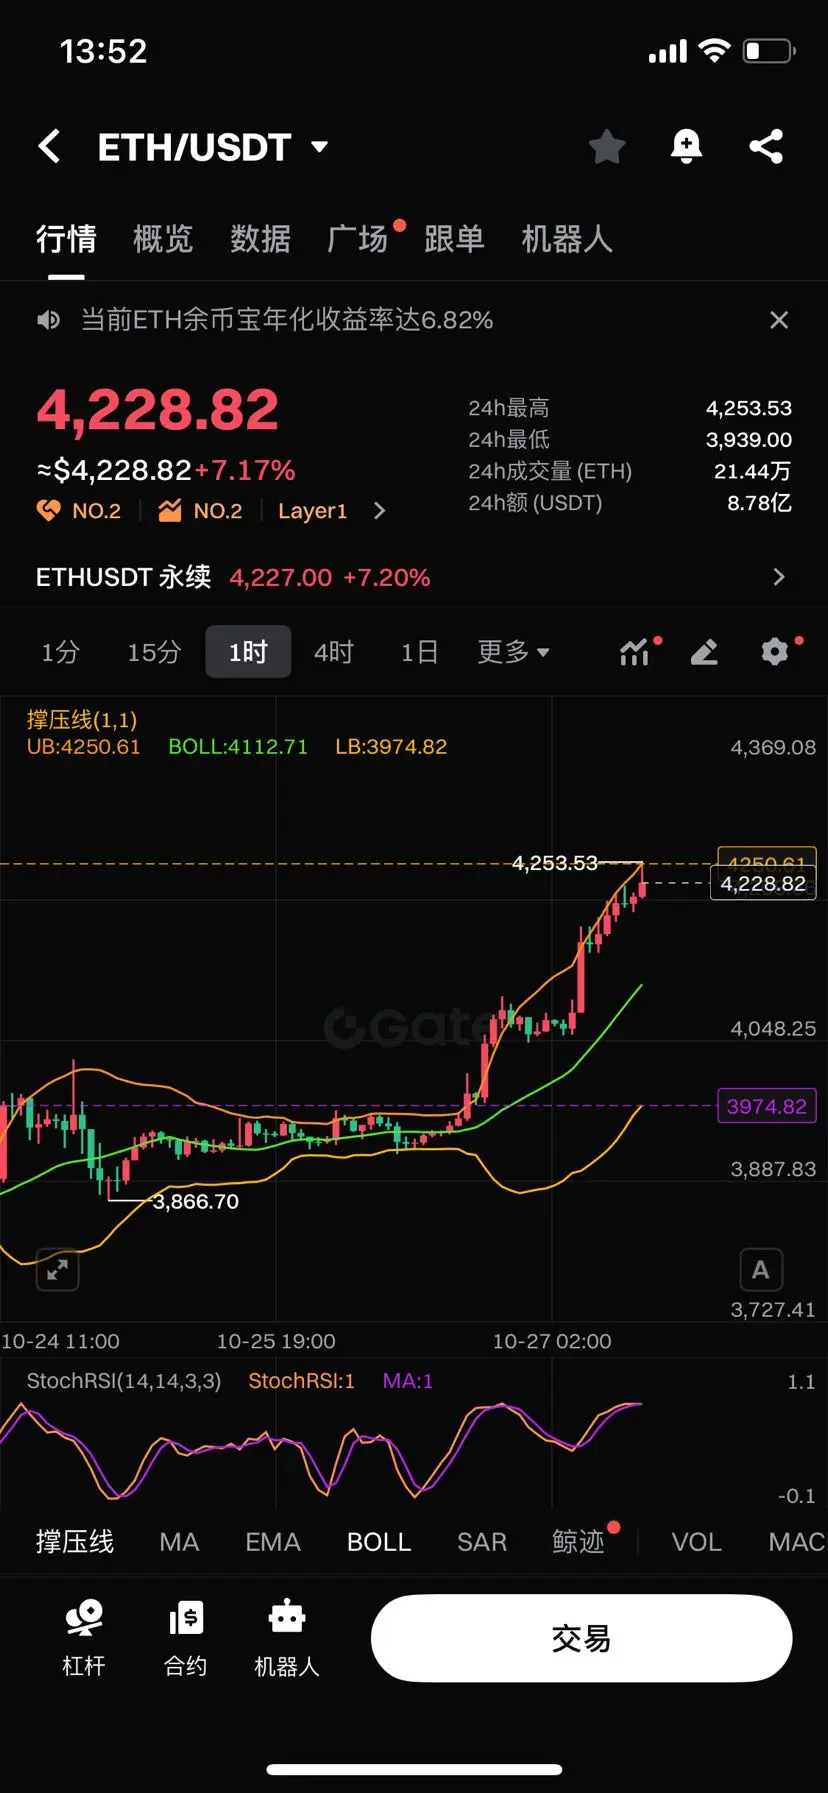
RSI
BTC RSI ≈36, ETH RSI ≈33
In the
View OriginalCurrently still in a daily chart downtrend structure since the 126,000 high point.
Recently, a quick rebound from 101,500 to 114,000 was followed by another weak pullback.
The price was blocked near the EMA30, repeatedly testing and failing, indicating strong selling pressure above.
Signs of a continuation of the downtrend after failed rebounds are now appearing.
MACD
BTC & ETH daily MACD remains below the zero line, with the red histogram weakening → signal of rebound failure
DIF/DEA are opening downward again, indicating an ongoing bearish trend
RSI
BTC RSI ≈36, ETH RSI ≈33
In the

- Reward
- 2
- Comment
- 1
- Share
Portfolio live broadcast, real-time order placement…
View Original

- Reward
- 1
- 2
- Repost
- Share
GateUser-6e013c16 :
:
Just go for it 💪View More
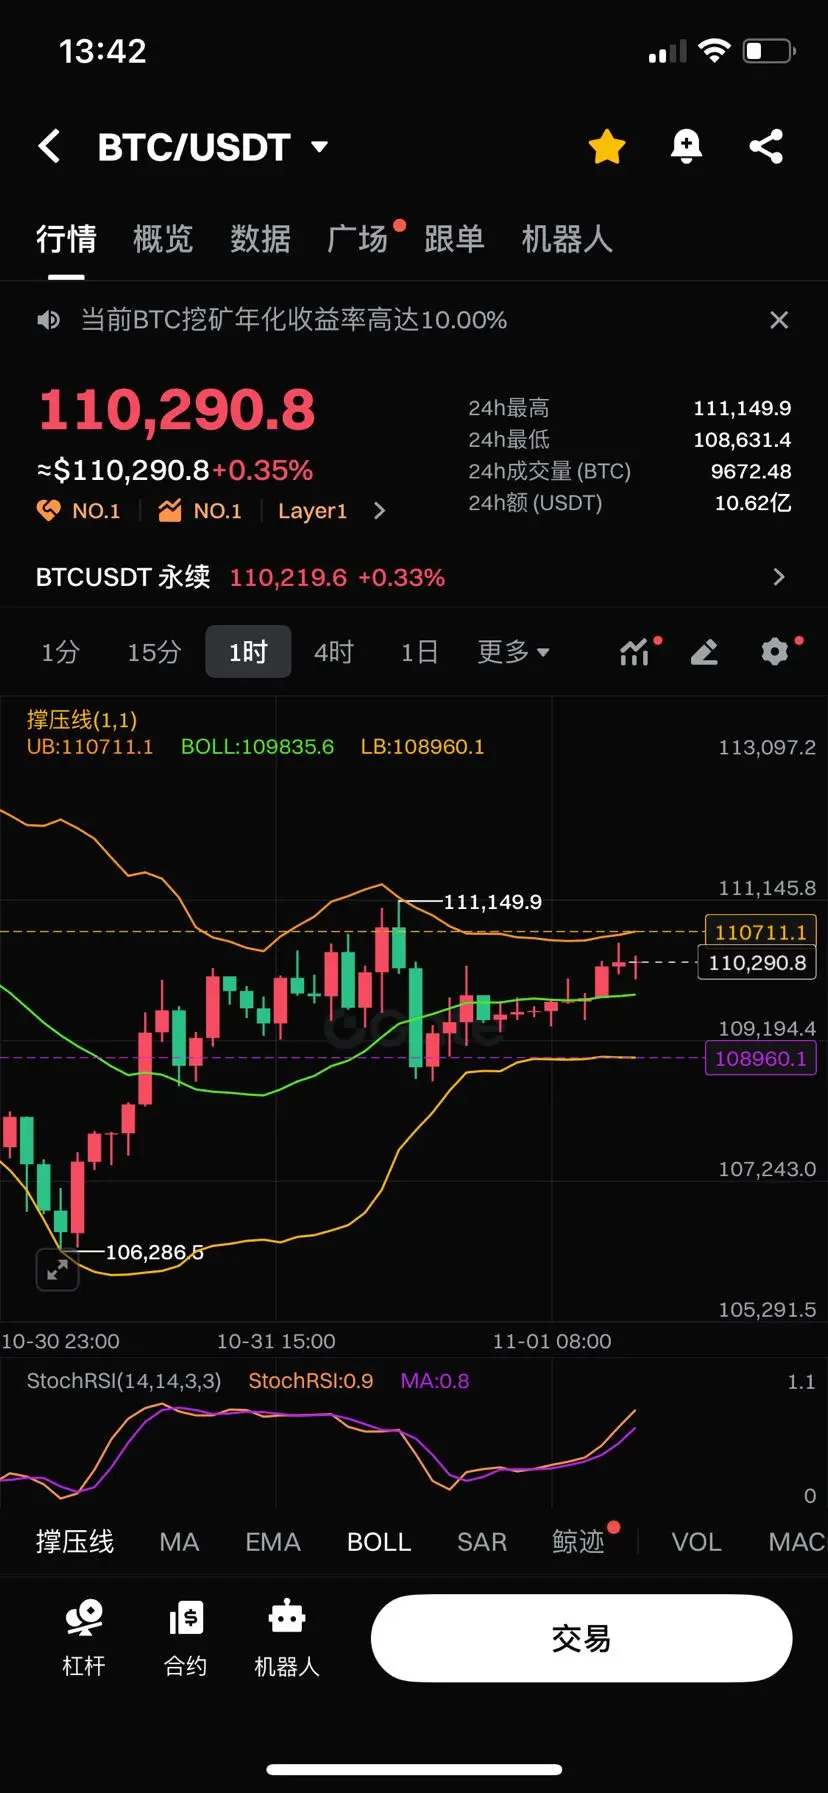
BTC Trend
8H timeframe remains in a weak rebound structure after a downtrend
Price is still below EMA30, the bearish structure has not been broken
The current rebound is a technical correction after a decline, not a trend reversal
There are consecutive small-bodied K-lines above, with weak momentum and funds observing
MACD, the green bars are shortening but have not yet formed a golden cross → rebound slowing, confirmation pending
RSI, rebounding from oversold area to 35–40 range → weak rebound
Resistance 111,000 — 112,500 EMA30 upper band suppression, previous high resistance zone
Strong Re
View Original8H timeframe remains in a weak rebound structure after a downtrend
Price is still below EMA30, the bearish structure has not been broken
The current rebound is a technical correction after a decline, not a trend reversal
There are consecutive small-bodied K-lines above, with weak momentum and funds observing
MACD, the green bars are shortening but have not yet formed a golden cross → rebound slowing, confirmation pending
RSI, rebounding from oversold area to 35–40 range → weak rebound
Resistance 111,000 — 112,500 EMA30 upper band suppression, previous high resistance zone
Strong Re
- Reward
- 1
- 1
- Repost
- Share
GateUser-6e013c16:
Take me along, experienced driver 📈Live Channel to Place Orders
View Original

- Reward
- like
- Comment
- Repost
- Share
Mid- to long-term strategy is profitable
View Original
- Reward
- like
- 1
- Repost
- Share
GateUser-6e013c16:
Just go for it 💪Broadcast has started
View Original
- Reward
- like
- 2
- Repost
- Share
GateUser-6e013c16:
Just go for it 💪View More
The news is about to land, follow the live market to stay on track
View Original
- Reward
- like
- 4
- Repost
- Share
GateUser-6e013c16:
Just go for it 💪View More
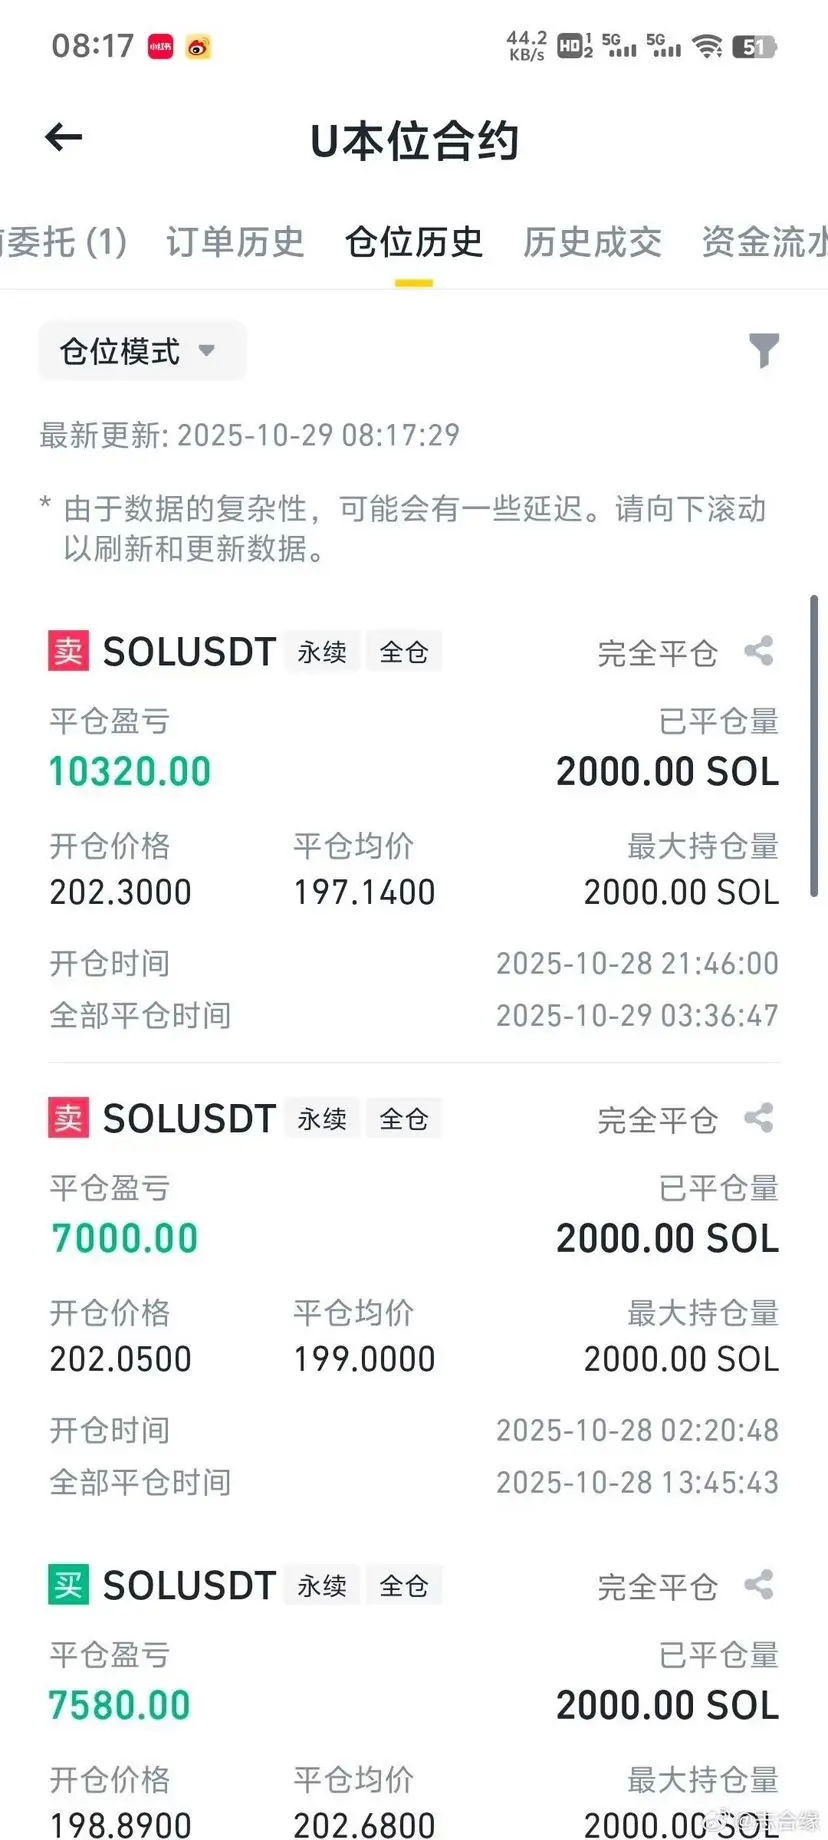
This order, I bet all my cognition and resolve on it. 🌙
Building a position late at night, I endured the market's doubts and fluctuations alone.
More than five hours of perseverance is a final battle with my inner fears.
When the close signal lights up, I know I have won against myself again.
This is not only the market's reward but also a coronation of faith and decisiveness.
Pushing limits, never stopping. The next battle is already on the way. 🚀
View OriginalBuilding a position late at night, I endured the market's doubts and fluctuations alone.
More than five hours of perseverance is a final battle with my inner fears.
When the close signal lights up, I know I have won against myself again.
This is not only the market's reward but also a coronation of faith and decisiveness.
Pushing limits, never stopping. The next battle is already on the way. 🚀
- Reward
- like
- Comment
- Repost
- Share
There is news-based data; no need to look at the candlestick charts…
View Original
- Reward
- 1
- Comment
- Repost
- Share
Today's Market Outlook
Bitcoin Trend
BTC is currently trading around 115,200, remaining in a high-level consolidation after a sustained rebound. The price has firmly broken above the EMA 30 at 111,000, indicating a generally bullish trend.
However, short-term candlestick charts show the upward momentum beginning to slow, with signs of deceleration in the rally.
The candlestick pattern shows consecutive bullish lines followed by small-bodied candles, suggesting short-term profit-taking and position reduction.
The EMA trend shows EMA 30 turning upward, signaling the establishment of a medi
View OriginalBitcoin Trend
BTC is currently trading around 115,200, remaining in a high-level consolidation after a sustained rebound. The price has firmly broken above the EMA 30 at 111,000, indicating a generally bullish trend.
However, short-term candlestick charts show the upward momentum beginning to slow, with signs of deceleration in the rally.
The candlestick pattern shows consecutive bullish lines followed by small-bodied candles, suggesting short-term profit-taking and position reduction.
The EMA trend shows EMA 30 turning upward, signaling the establishment of a medi
- Reward
- 1
- Comment
- Repost
- Share