There are a variety of trading techniques behind different portfolios for many users who have been in the crypto market for a long time. High-frequency trading (HFT) is one of the few techniques that allow users to maintain a competitive advantage in the market.
The application of HFT in the crypto market is multifaceted. We must learn more about it because it may work for some people, but not for others.
2026-04-09 06:55:00
Simple Earn is a financial product that allows investors to make better use of their idle assets. It is especially suitable for holders who are optimistic about the market and want to make crypto-denominated investments. They are more concerned with the asset's future value rather than the short-term book value.
Although it is easy to use, subscribing to Simple Earn means taking a long position. It is prudent to know the risk of price fluctuations and to establish a stop-loss price because the market is ever-changing.
2026-04-09 06:53:49
Highlights
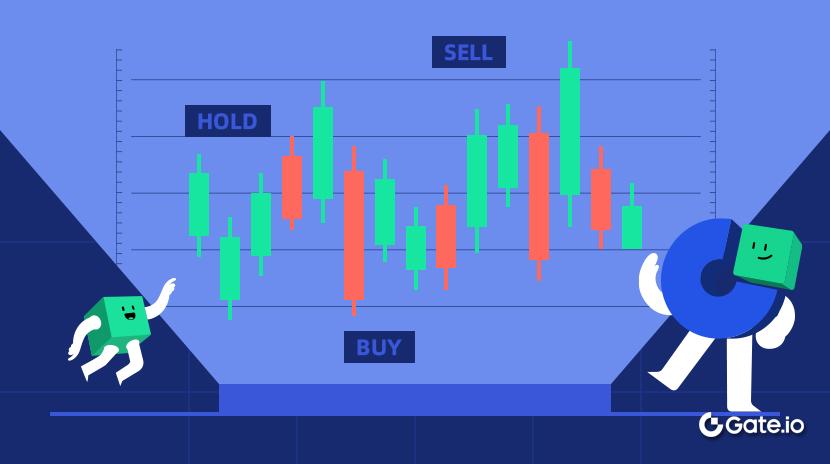
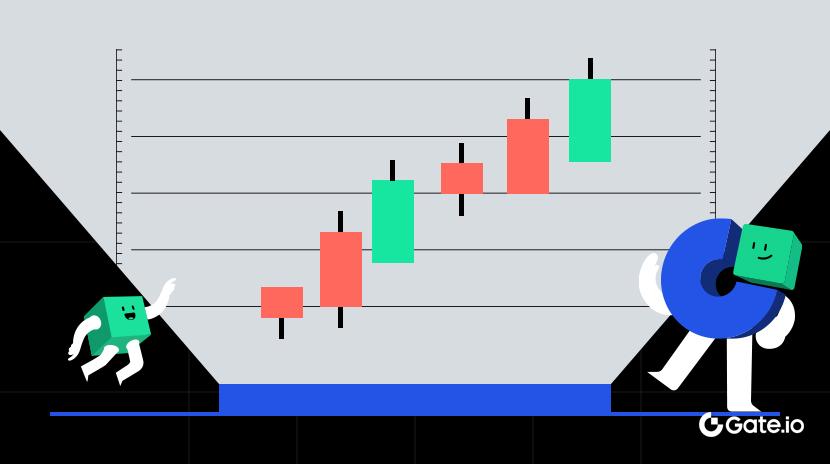
1. The advanced subject of Futures Trading, Gate learn, aims to help users build a framework for technical analysis, including candlestick chart fundamentals, technical patterns, averages, trendlines, and the application of technical indicators.
2. This issue introduces common rising candlestick chart combinations to facilitate the identification of rising signals in real-world trading and better grasp trading opportunities.
2026-04-09 06:48:19
Highlights
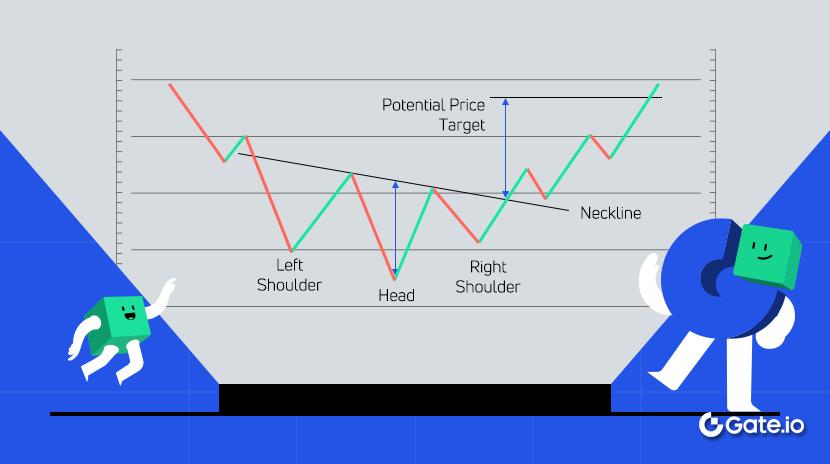
1. The advanced subject of Futures Trading, Gate learn, aims to help users build a framework system of technical analysis, including candlesticks pattern fundamentals, technical patterns, averages, trendlines, and the application of technical indicators.
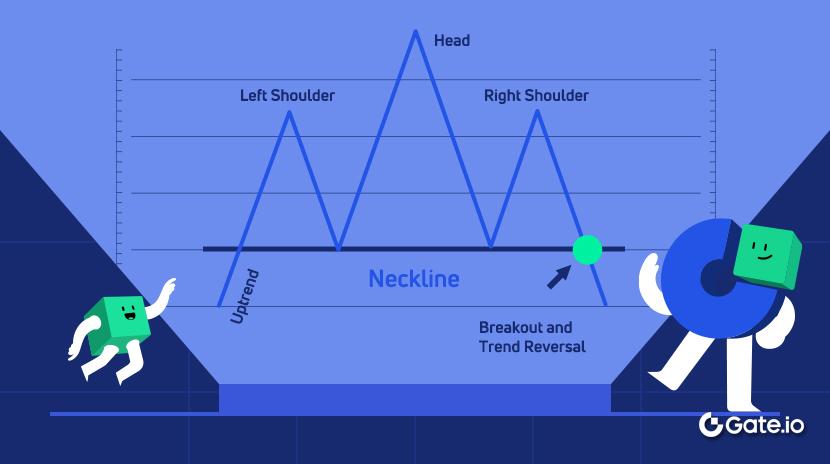
2. In this issue, we will explain the application of the Head and Shoulders pattern regarding its concept, characteristics, BTC application, and relevant precautions.
2026-04-09 06:46:59
How much trading rewards can you earn from wash trading on marketplaces such as X2Y2? Top wash traders have paid millions in platform fees in order to earn trading volume based token rewards. Is wash trading really that profitable?
Wash trading is one of the biggest hurdles in accurately assessing NFT projects, exchanges and the industry as a whole.
This article analyzes one exchange in particular, X2Y2, and explains how wash traders position themselves to earn token rewards from wash trading and staking. It also analyzes the profit and loss of the top 10 X2Y2 wash traders.
2026-04-09 06:43:28
Hashflow is a multi-chain decentralized trading protocol that uses the RFQ model to price cryptocurrency assets, solving the capital efficiency problems of traditional automated market maker protocols through novel thinking and enabling zero price slippage trading.
2026-04-09 06:40:14
TradingView is one of the best analysis tools for traders of the financial, stock, and crypto markets.
2026-04-09 06:36:19
The head and shoulders pattern is a technical structure that signals a change in market direction from an uptrend to a downtrend.
2026-04-09 06:31:30
Just like traditional loans, the world of DeFi makes crypto lending possible. Crypto loans can be collateralized, uncollateralized, or have interest fees.
2026-04-09 06:22:28
In 2022, NFT remains one of the most popular assets in the crypto market. NFT trading attracts the attention of users from a broad range of industries, even in a bear market.
Although NFTs were often traded at a high price when the market was upward, this industry is thriving at present. In this article, we will review the ten most expensive NFT transactions since their genesis, and understand the crypto projects behind these transactions.
In this article, we tracked NFT sales ranking and auction ranking, and made a list based on the final transaction price of each NFT. The transaction price is based on statistics on various websites over the years, and is given in USD converted from the cryptocurrency used in the transaction. As the price of the cryptocurrency will fluctuate, we use the USD price of the transaction or auction as a reference.
2026-04-09 06:18:22
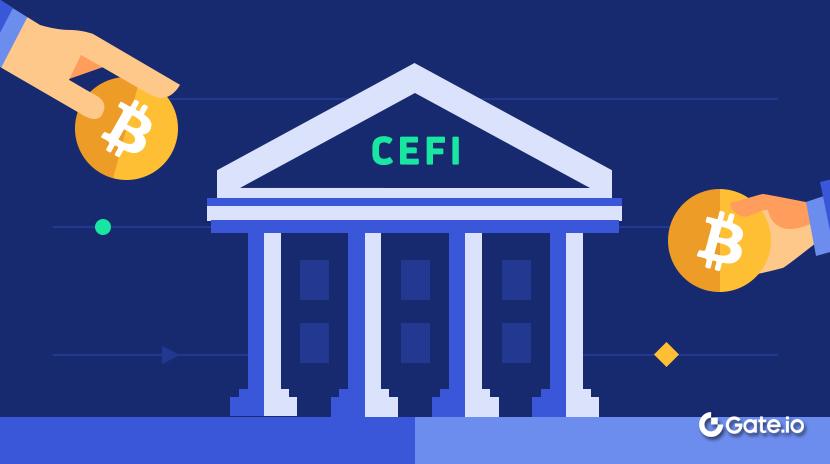
CeFi, short for Centralized Finance, is the opposite of DeFi, Decentralized Finance. Actually, the concept of CeFi has been used in the traditional financial system for a long time, but it is only in recent days that it is created as CeFi to define all existing mainstream financial systems, such as banks, stock exchanges, and various financial institutions. Specifically, the concept can even be traced back thousands of years ago when the bankers in Florence, Italy in the 15th century began to use this concept. So, it has been applied for hundreds of years.
The concept of CeFi, representing the existing centralized financial systems, is created to distinguish itself from the term of DeFi.
2026-04-09 06:15:19
This article introduces four tools that can be used to analyze GameFi projects: DeGame focuses on P2E, Footprint Analytics provides more comprehensive and multi-dimensional data, DappRadar supports the most links but is more of a basic ranking, and GameFi.org is a platform for compiling user experience reviews.
2026-04-09 06:11:56
Unlimited Grid Trading is an upgraded version of the original grid trading but with no price cap. It allows users to keep fixed-value assets and make more profit in an upward market.
2026-04-09 06:06:36
An NFT aggregator is an application that integrates order information from multiple NFT distribution platforms. It was created to solve the problem that order information from multiple marketplaces could not be shared with each other.
With the arrival of Web3, aggregator applications have emerged in different fields like mining, DeFi, and NFT. Aggregators not only help users to explore more in the market and gain more value, but they are also becoming an integral part of the crypto ecosystem.
2026-04-09 06:05:28
Copy Trading, as the most profitable trading model, not only saves time but also effectively reduces losses and avoids man-made oversights.
2026-04-09 06:04:24