Application of Oscillating Indicator-KDJ
This "Gate Learn Futures" intermediate course introduces concepts and the use of various technical indicators, including candlestick charts, technical patterns, moving averages, and trend lines. This article mainly introduces the application of the KDJ, the oscillation indicator, interpreting the indicator's composition, technical meaning, and application.
What is the KDJ indicator?
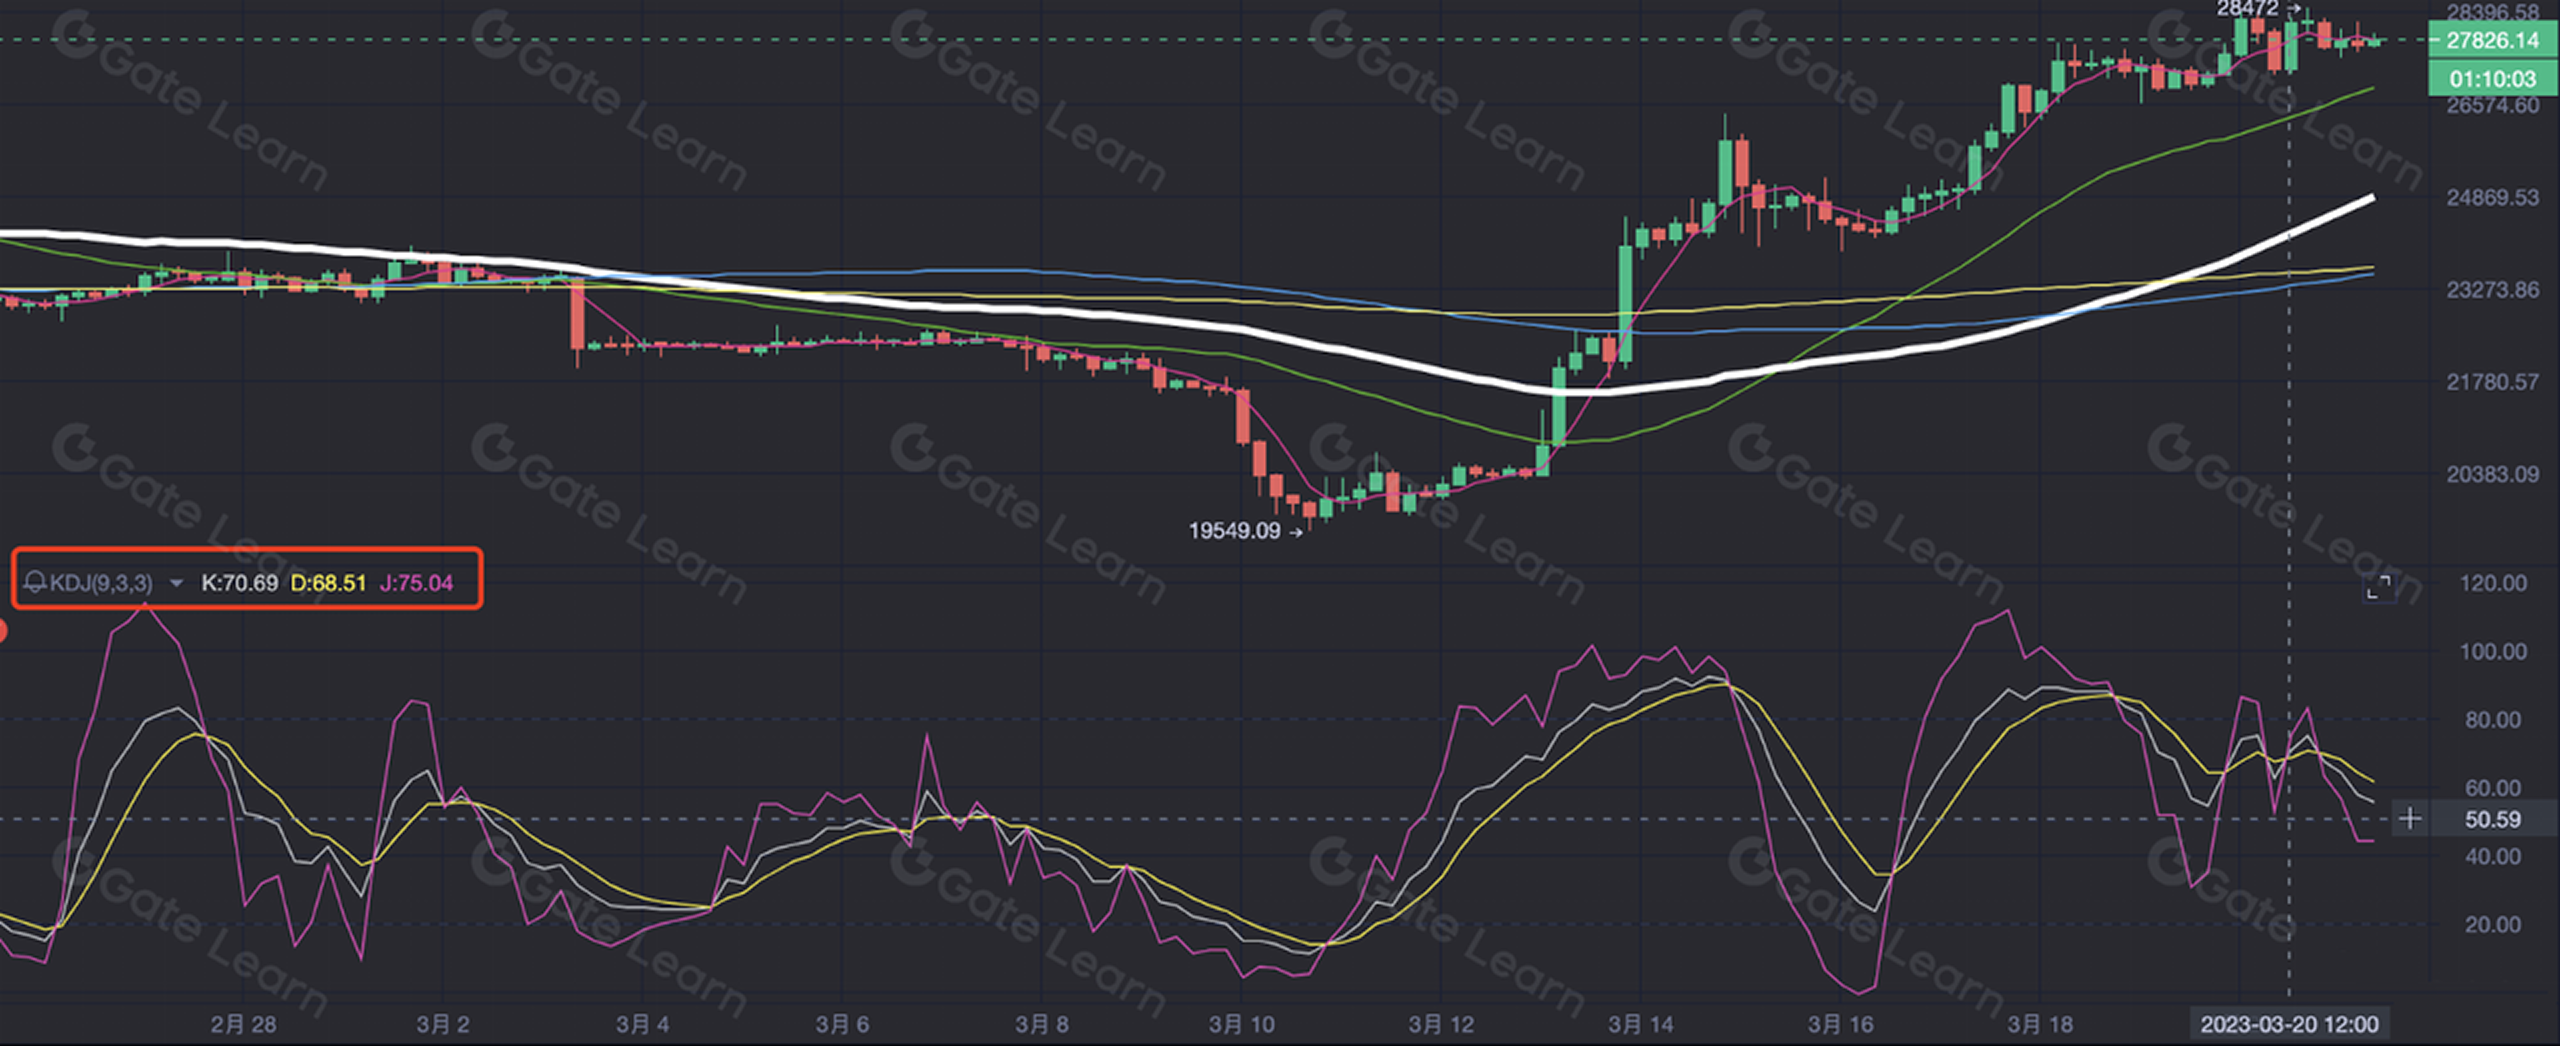
Stochastic Oscillator (KDJ) is a typical interval oscillation indicator. The figure below shows that the KDJ indicator value fluctuates between 0-100 and will not exceed this range. Most of the time it fluctuates between 20-80.
The application of KDJ
The KDJ oscillation index is effective in predicting when the price will hit the top or bottom. The oscillation indicator, in conjunction with price and trading volume, constitutes the three main elements for traders to consider when judging market status. The indicator operates in the following manner:
- High or low hanging of the indicator - Signals that the indicator enters the overbought or oversold range.
- The indicator shows a regular cycle of change - As the indicator is calculated from the price, it moves in a regular cycle as the price fluctuates according to a certain pattern. For example, the indicator will move in waves that reach higher peaks and troughs than the previous wave in a bullish trend. Conversely, a bearish market will see each wave reaching lower peaks and troughs.
- Crossing of lines - The most common use case of the indicator involves observing the intersection of two indicator lines. If the fast line and the slow line cross in an upward-moving direction, a “golden cross” is formed. Conversely, a “death cross” is generated when the two lines intersect on a downward course. These two crosses are also respectively known as the “golden fork” and the “death fork”.
- Long-short dividing line - Serving as one of the basis for oscillatory indicators-based band operation, the long-short dividing line usually refers to the horizontal line passing through the index value of 0 or 50. For the KDJ indicator, the long-short dividing line is the horizontal line aligned with a 50 value (the horizontal line passing through value of 50), and MACD indicator’s long-short dividing line is the 0 horizontal axis (the horizontal line aligned with value 0).
Application of K line and D line
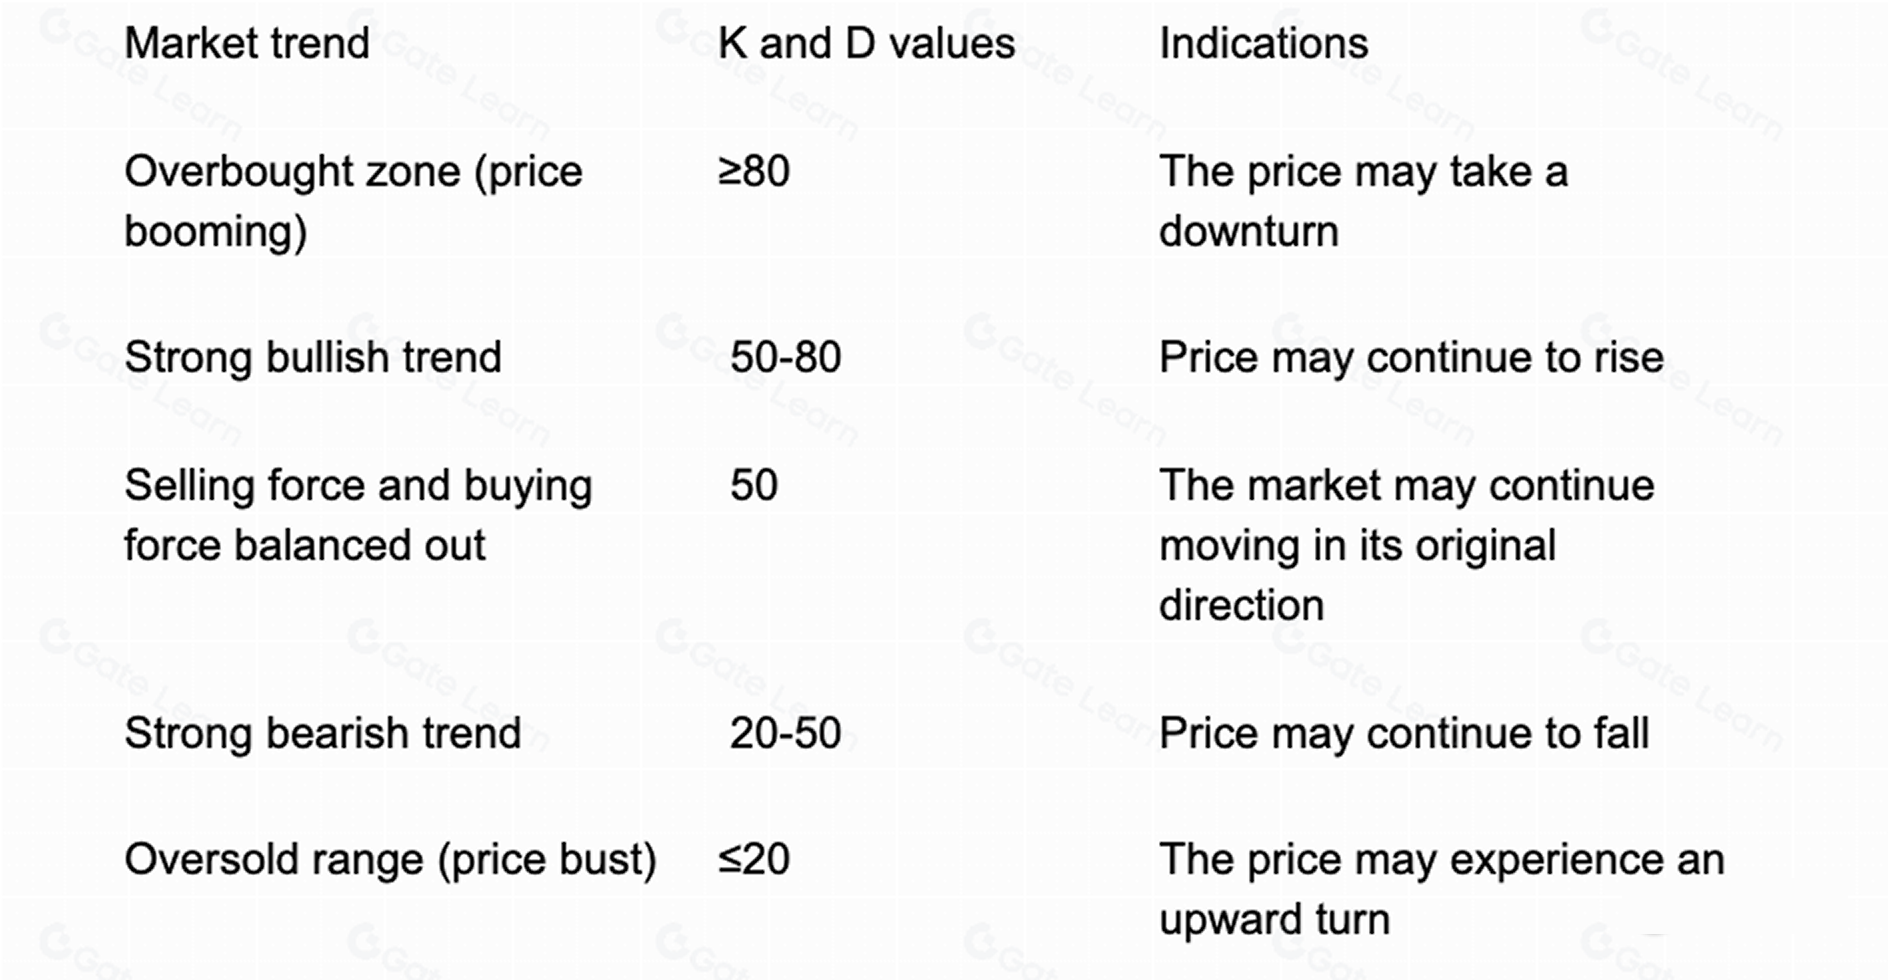
The K and D values are between 0-100. When the K and D values are above 50, it indicates the market goes in a bullish trend and it is time to open long positions. If the K and D values fall below 50, it means the bearish trend is dominant, and traders are suggested to short. The following table summarises the possible market movements corresponding to different K and D values :
Crossing of K and D lines
1.When the K line and the D line are both below 50, and the K line goes upward to break through the D line, it indicates that the market is experiencing a round of strong rise, and it is time to buy more assets or hold the current positions. This cross formed by the two lines is a form of the golden cross of the KDJ indicator. As shown below…
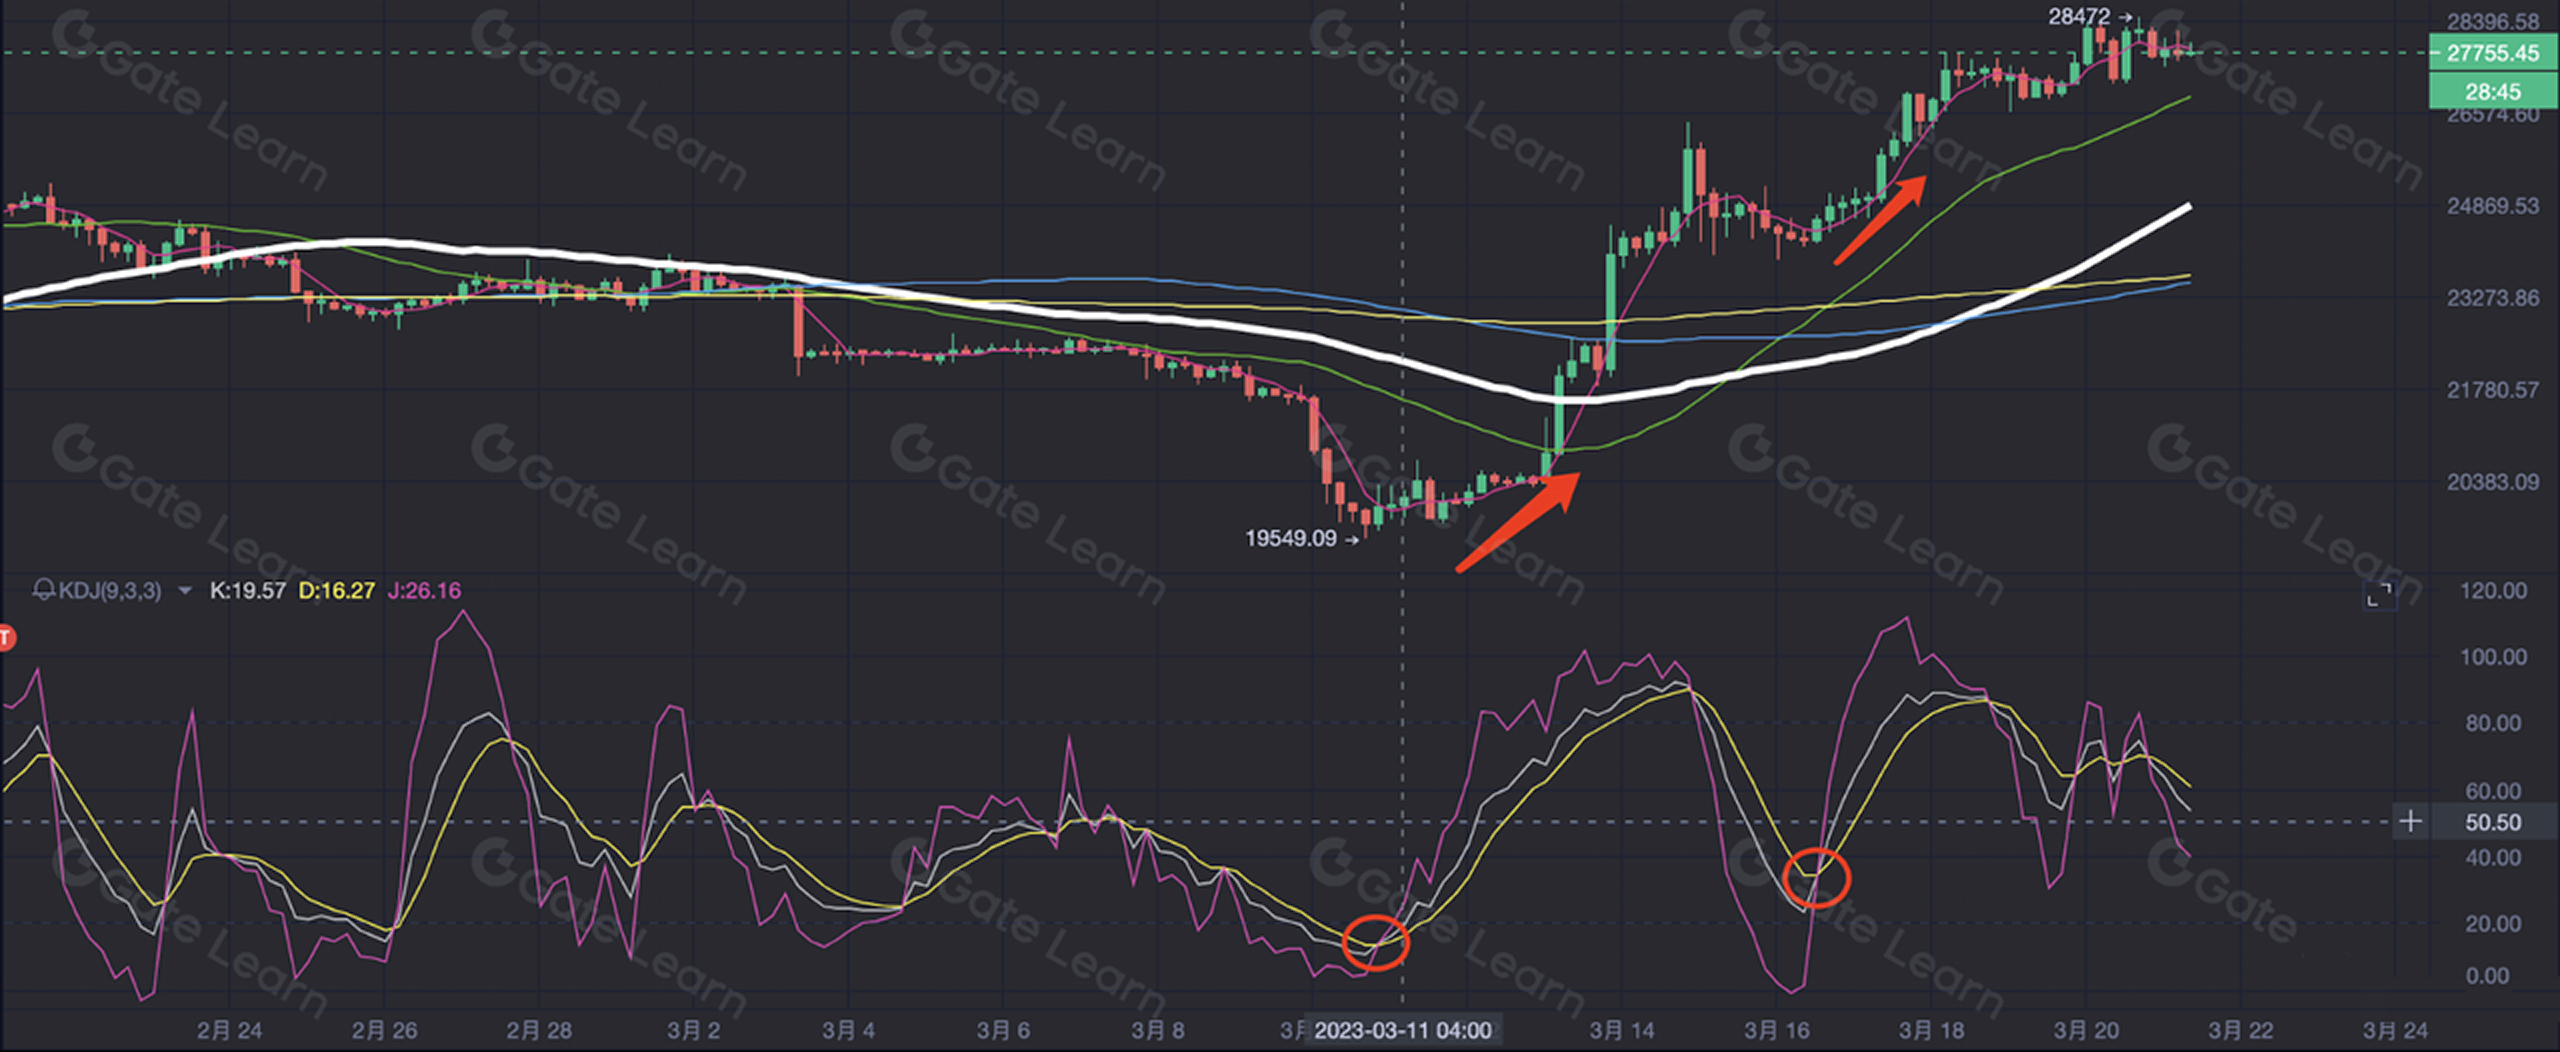
2.When the K line and the D line are both below 20, and the K line moves up to break through the D line, it indicates that the sluggish trend is about to end and bullish market will ensue. The price will stop falling and rebound. The two lines meet to form another form of golden cross of the KDJ indicator. As shown below:
3.When the K line and D line are both greater than 80, and the K line falls to cross the D line, it indicates that the market is about to turn from a bullish trend to a bearish trend, and the currency price will fall. Once the cross is formed, also known as a KDJ death cross, it is time to get rid of your assets.
4.When the K line and the D line are both greater than 50, and the K line falls to break through the D line, it indicates that the market will experience another round of decline, and the currency price will fall. In such case, traders are suggested to sell assets or just wait and see. This fork is another form of KDJ death cross.
Points to note
- Indicator passivation Indicator passivation occurs when the indicator line oscillates around the boundary value while the price continues to move in the same direction, consistently making new highs or new lows. In such situations, the indicator offers little guidance, meaning it becomes ineffective in reflecting market sentiment under extreme market conditions. Oscillator indicators are more prone to passivation because they cover a relatively shorter period than the duration of extreme market conditions. Indicator passivation can be divided into high-level passivation and low-level passivation.
Summary
The KDJ oscillator is a commonly used trading indicator but one should avoid mindless use of the indicator without figuring out the trading scenario. There is no universal method that will work for all trading cases. Traders should combine the use of a KDJ oscillator and other technical analysis, verifying the results from multiple perspectives.
Register on Gate Futures platform to start trading!
Disclaimer
Please note that this article is for informational purposes only and does not offer investment advice. Gate cannot be held responsible for any investment decisions made. The information related to technical analysis, market judgment, trading skills, and traders’ sharing should not be relied upon for investment purposes. Investing carries potential risks and uncertainties, and this article does not guarantee returns on any investment.
Lesson 1:Understanding The Moving Average
Lesson 2:Detailed Explanation of Granville 8 Rules
Lesson 3:Application of single moving average
Lesson 4:Application of Double Moving Average
Lesson 5:Application of Moving Average Array - Long Pattern
Lesson 6:Application of Moving Average Array - Short Pattern
Lesson 7:How to use Moving Average Patterns - Moving Average Cross
Lesson 8:How to Use Moving Average Patterns - Moving Average Bonding, Convergence and Divergence
Lesson 9:What is trend trading?
Lesson 10:What is the left-side and right-side trading
Lesson 11:What is the trend line
Lesson 12:How to Use Trend Line
Lesson 13:Support line and resistance line
Lesson 14:Application of MACD - the King of Indicators
Lesson 15:Application of Oscillating Indicator-KDJ
Lesson 16:Application of Relative Strength Indicator - RSI
Related Courses

Technical analysis: A useful tool to understand trends in Futures trading

Gate Simple Earn Investment Guide

Gate Futures Trading Guide - A must-read for newbies

Crypto Infolw : Coin , Data and News

Futures Grid Trading User Guide