


$BTC $ETH Weekly Analysis Update:
This week's theme: Market Reversal
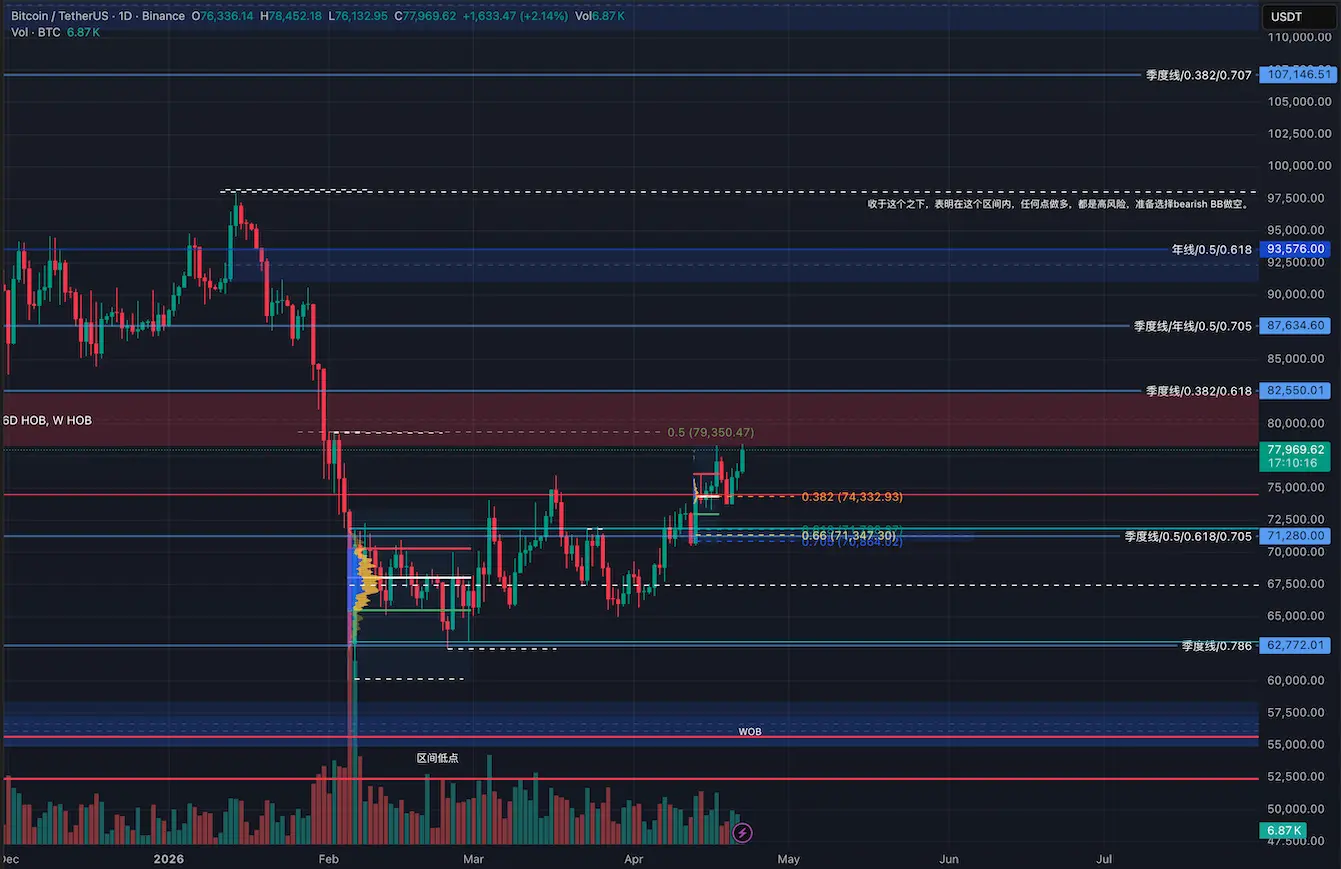
BTC Weekly Chart Analysis:
Last week broke through the Range High (71,200), successfully closing above it.
69K - 71K shifted from the Supply ( supply zone ) to the Demand ( demand zone ).
Scenario 1: If BTC closes above 79.5K, which is above the 0.5 level of the 60K - 98K Fibonacci retracement, then BTC will experience rapid expansion.
Scenario 2: If BTC closes back below the Range High (71,200), then at minimum, BTC will retest important liquidity levels below that have not been tested yet (62K, 60K).
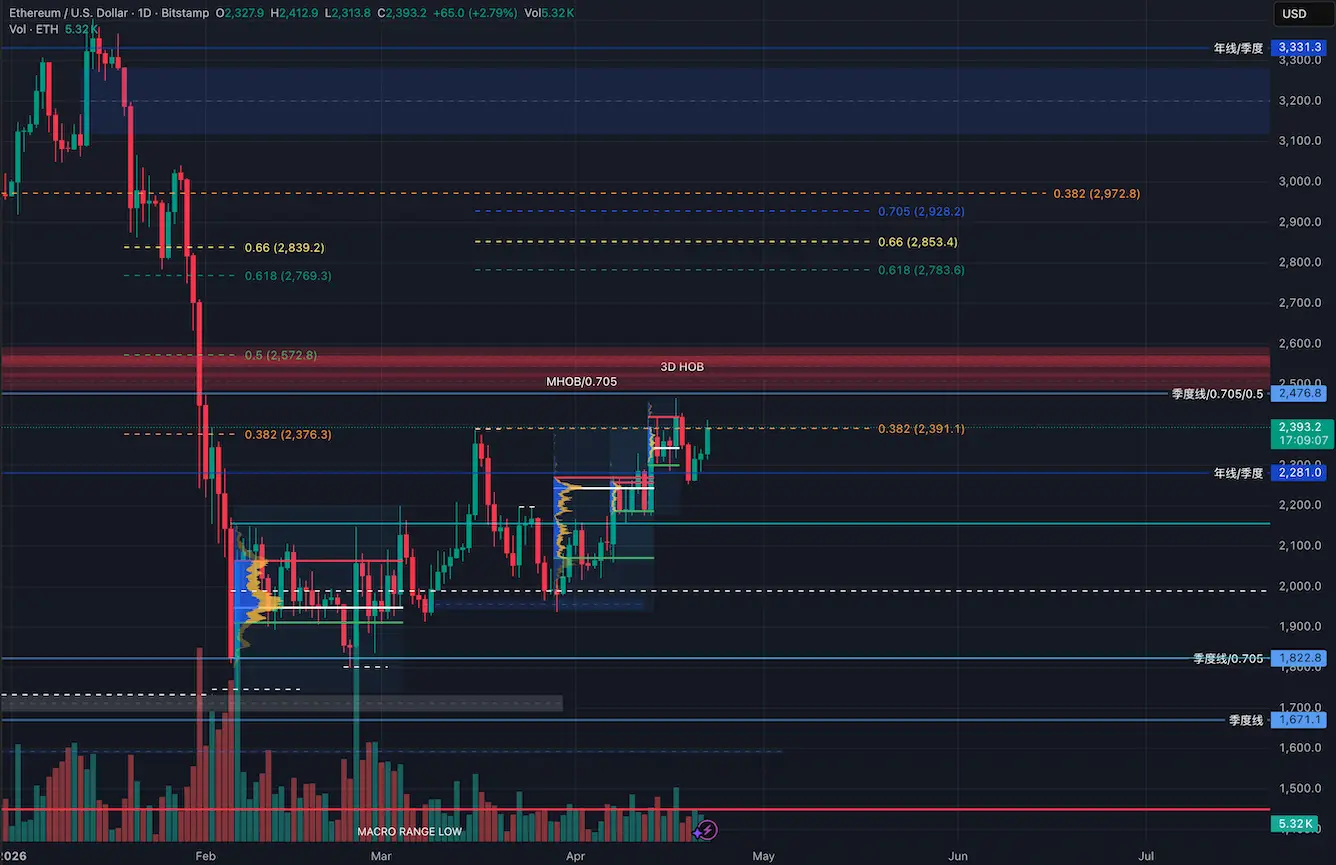
ETH Weekly Chart Analysis:
ETH remains relatively strong compared to BTC, as seen from the ETH/BTC trading pair.
2.1K - 2.2K shifted from the Supply ( supply zone ) to the Demand ( demand zone ).
Scenario 1: If ETH closes above 2.57K, ETH will undergo rapid expansion.
Scenario 2: If ETH closes back below the Range High (2.1K), then at minimum, BTC will retest important liquidity levels below that have not been tested yet (1.79K, 1.74K).
ETH/BTC Weekly Chart Analysis:
The ETH/BTC pair has two significant implications:
1. The relative strength or weakness of ETH compared to BTC.
2. If ETH is strong relative to BTC, then altcoins other than ETH are very likely to experience a wave of expansion. Conversely, if ETH is weak, the same applies in reverse.
Last week, the weekly close was above the ETH/BTC consolidation zone Range High, indicating ETH remains strong against BTC. We need to continuously monitor this momentum.
This week's theme: Market Reversal
BTC Weekly Chart Analysis:
Last week broke through the Range High (71,200), successfully closing above it.
69K - 71K shifted from the Supply ( supply zone ) to the Demand ( demand zone ).
Scenario 1: If BTC closes above 79.5K, which is above the 0.5 level of the 60K - 98K Fibonacci retracement, then BTC will experience rapid expansion.
Scenario 2: If BTC closes back below the Range High (71,200), then at minimum, BTC will retest important liquidity levels below that have not been tested yet (62K, 60K).
ETH Weekly Chart Analysis:
ETH remains relatively strong compared to BTC, as seen from the ETH/BTC trading pair.
2.1K - 2.2K shifted from the Supply ( supply zone ) to the Demand ( demand zone ).
Scenario 1: If ETH closes above 2.57K, ETH will undergo rapid expansion.
Scenario 2: If ETH closes back below the Range High (2.1K), then at minimum, BTC will retest important liquidity levels below that have not been tested yet (1.79K, 1.74K).
ETH/BTC Weekly Chart Analysis:
The ETH/BTC pair has two significant implications:
1. The relative strength or weakness of ETH compared to BTC.
2. If ETH is strong relative to BTC, then altcoins other than ETH are very likely to experience a wave of expansion. Conversely, if ETH is weak, the same applies in reverse.
Last week, the weekly close was above the ETH/BTC consolidation zone Range High, indicating ETH remains strong against BTC. We need to continuously monitor this momentum.