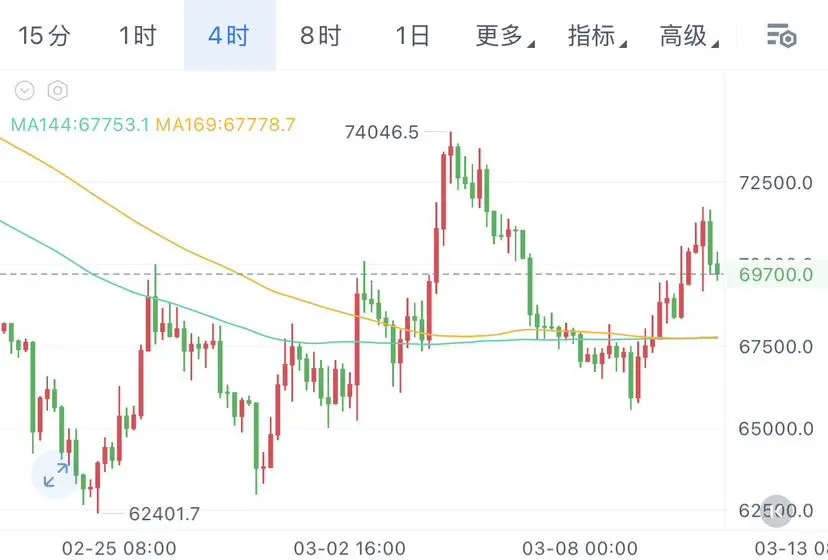
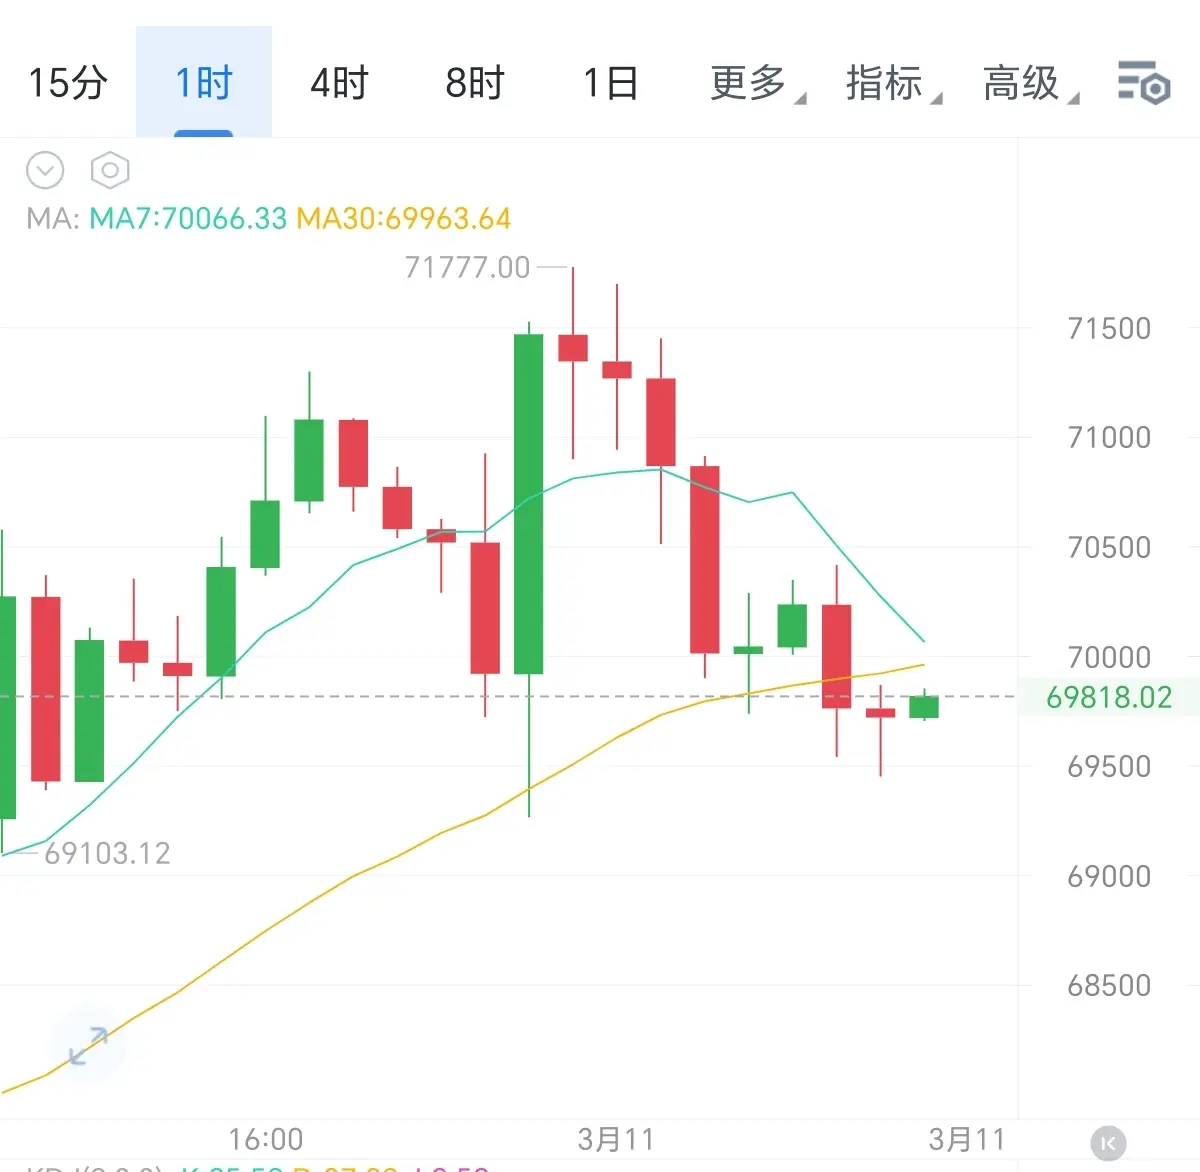
3.11 Wednesday Intraday Analysis
From a technical perspective, the four-hour chart shows that the price is approaching the 70,000 round number resistance. The KDJ indicator has entered the overbought zone and may turn downward at any time. The rebound momentum is gradually weakening. Although the MACD shows a golden cross, the red histogram bars are short, indicating insufficient strength to break through the key resistance. It appears more like a correction of the previous decline.
Personal advice, for reference only (strictly set stop-loss)
Bitcoin around 70,500, buy on dip at 71,500, target
View Original