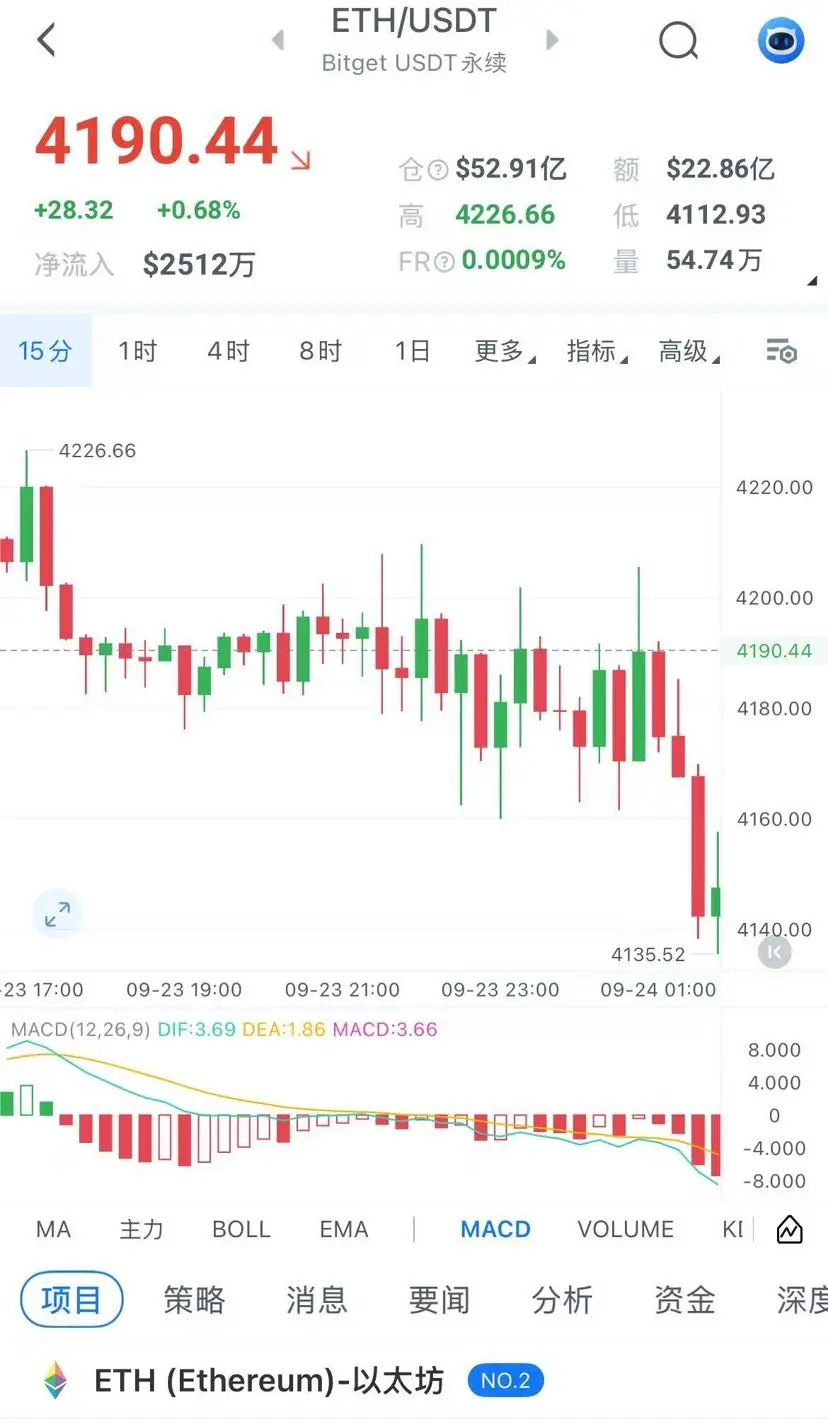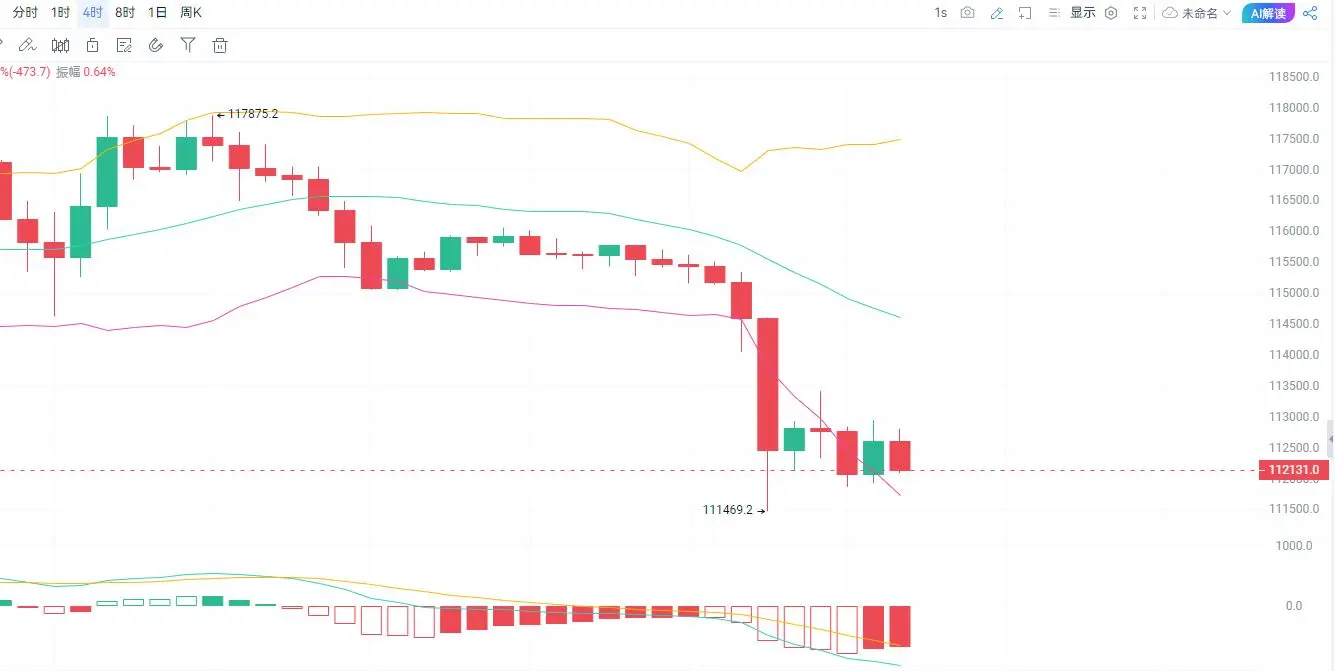
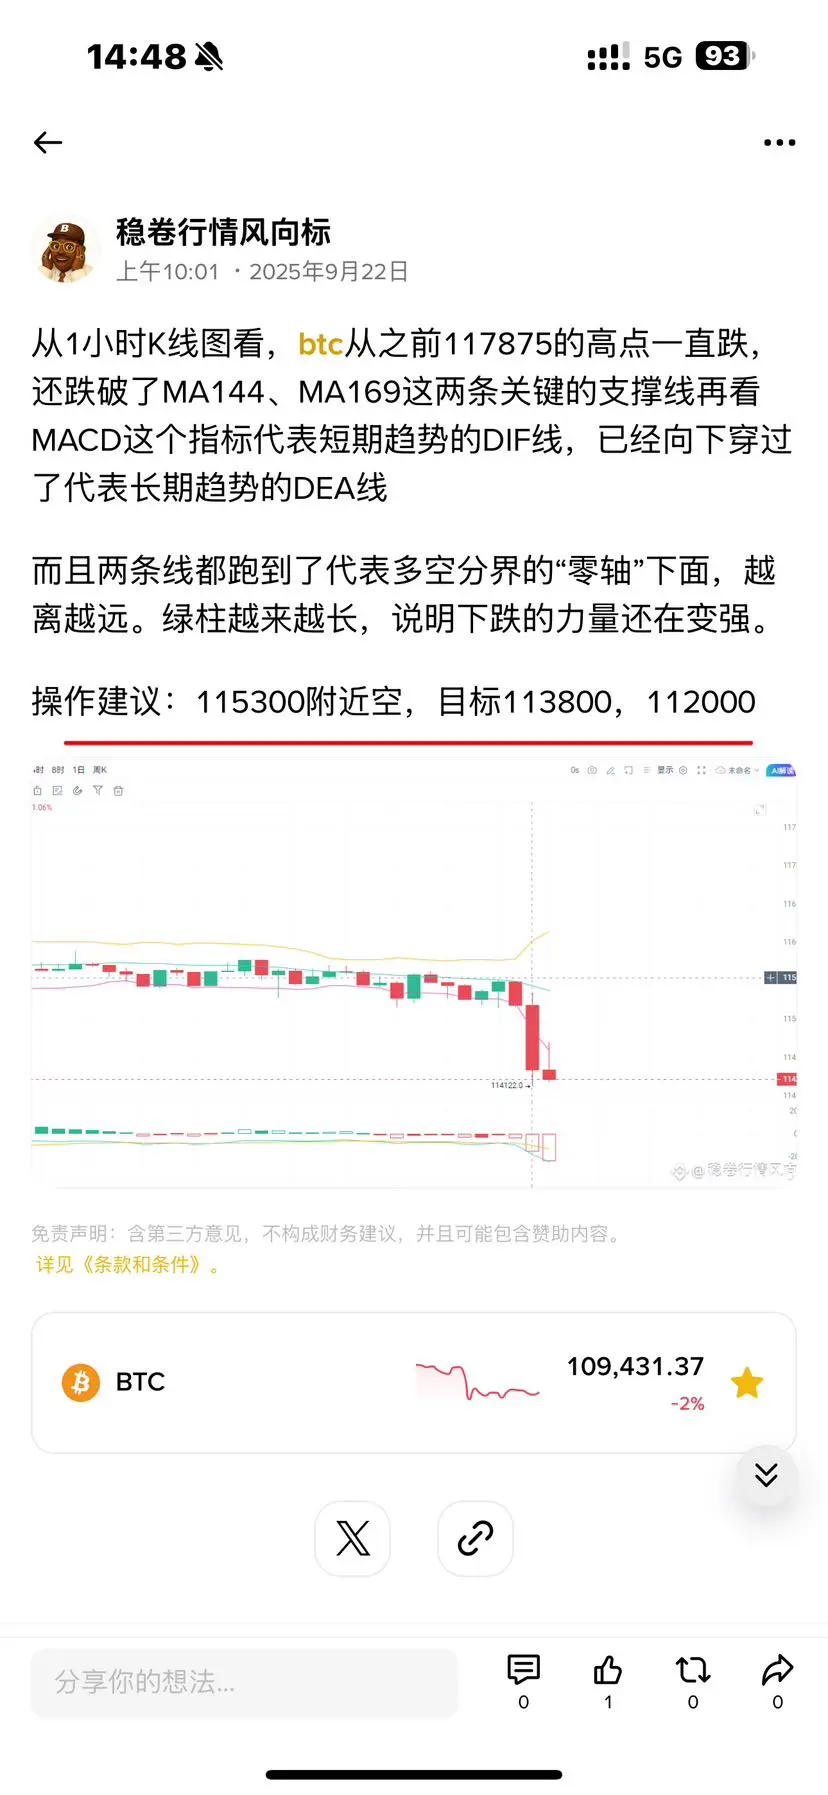
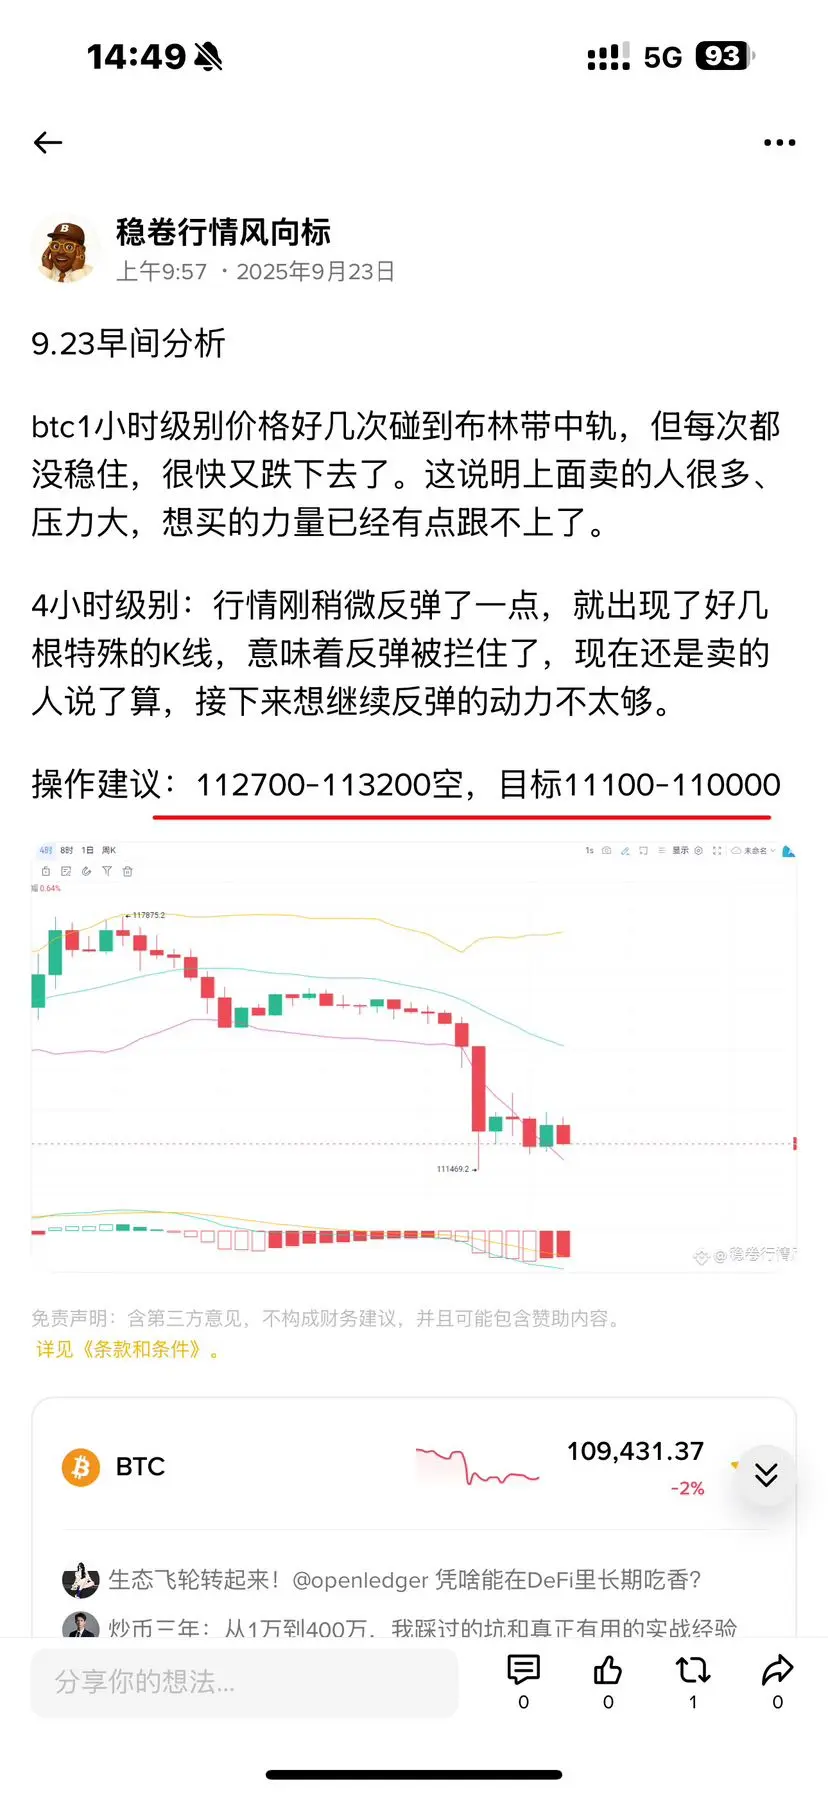


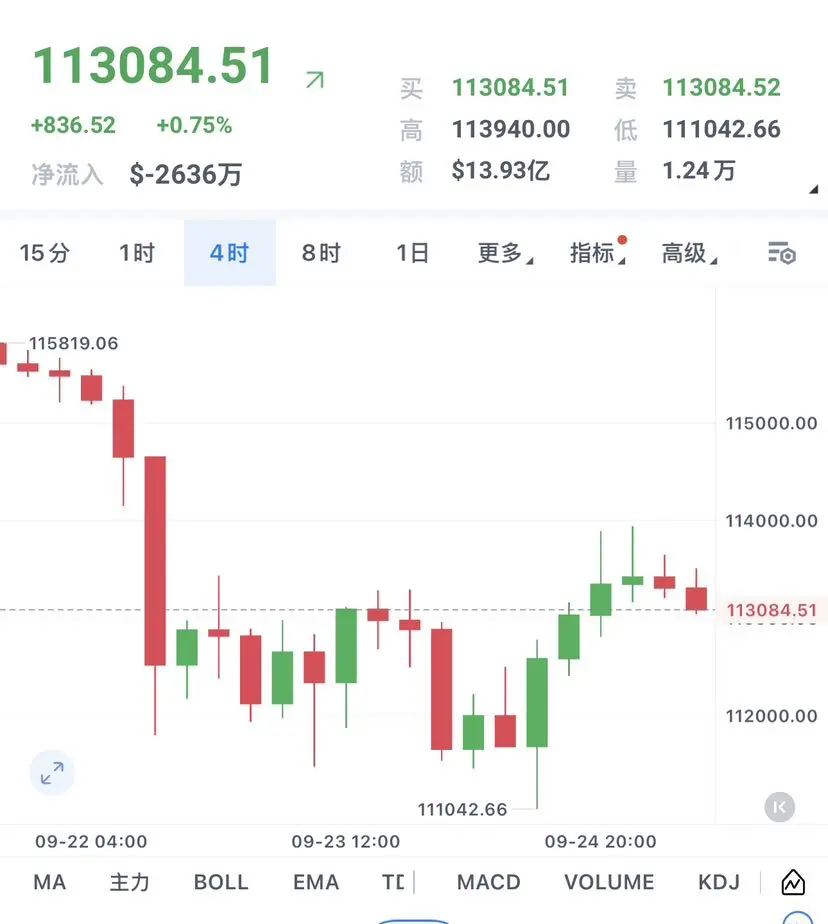
Morning Analysis on 9.23
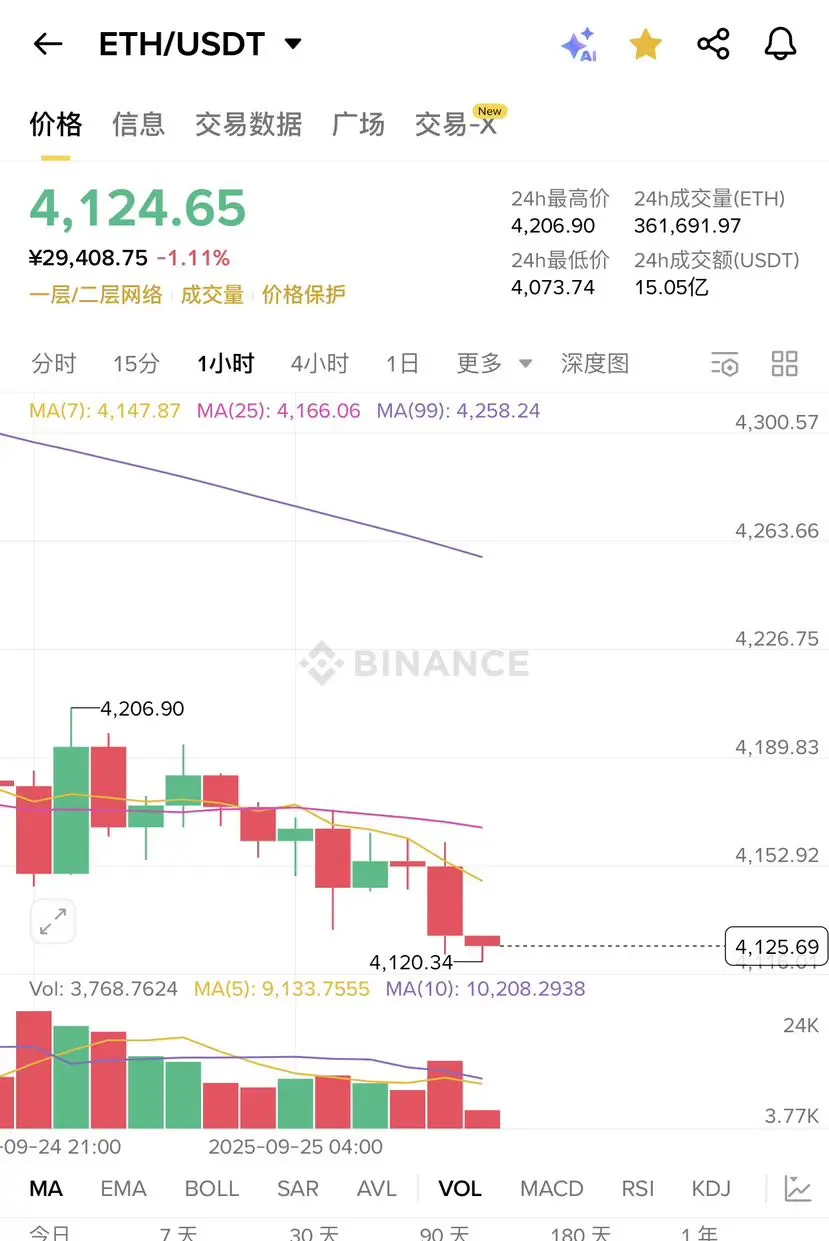
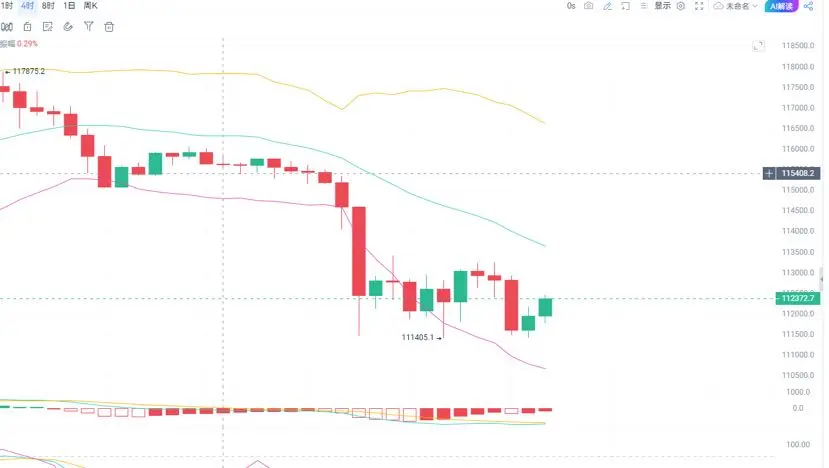
The price of BTC at the 1-hour level has touched the middle line of the Bollinger Bands several times, but each time it couldn't hold steady and quickly fell again. This indicates that there are many sellers above, creating significant pressure, and the buying strength is starting to lag behind.
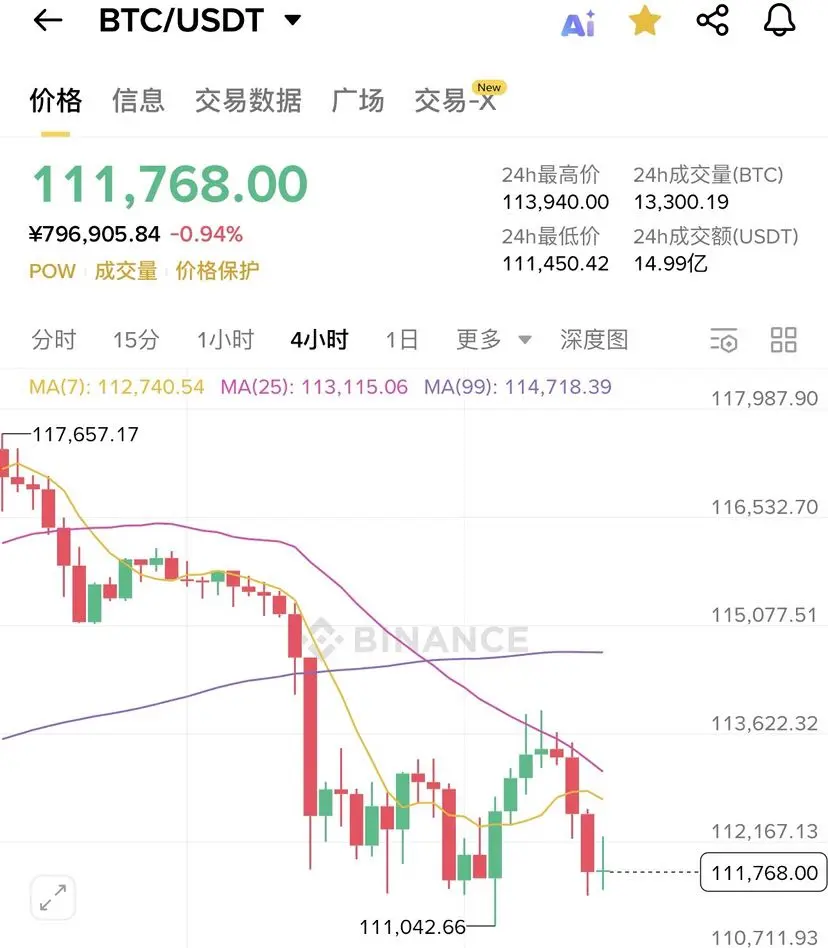
4-hour level: The market has just rebounded slightly, and several special candlesticks have appeared, indicating that the rebound has been halted. Right now, it is still the sellers who have the say, and there isn't enough momentum to continue the rebound.
Operation suggestion: Short 112700-113200, target 11100-110000
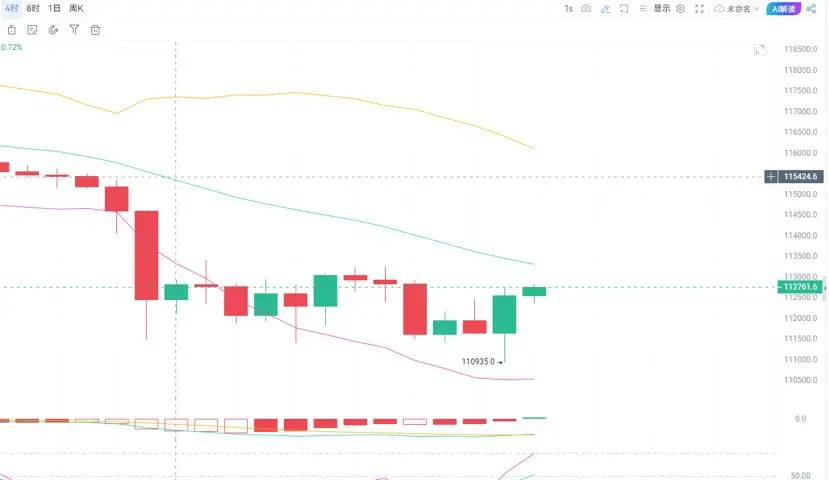
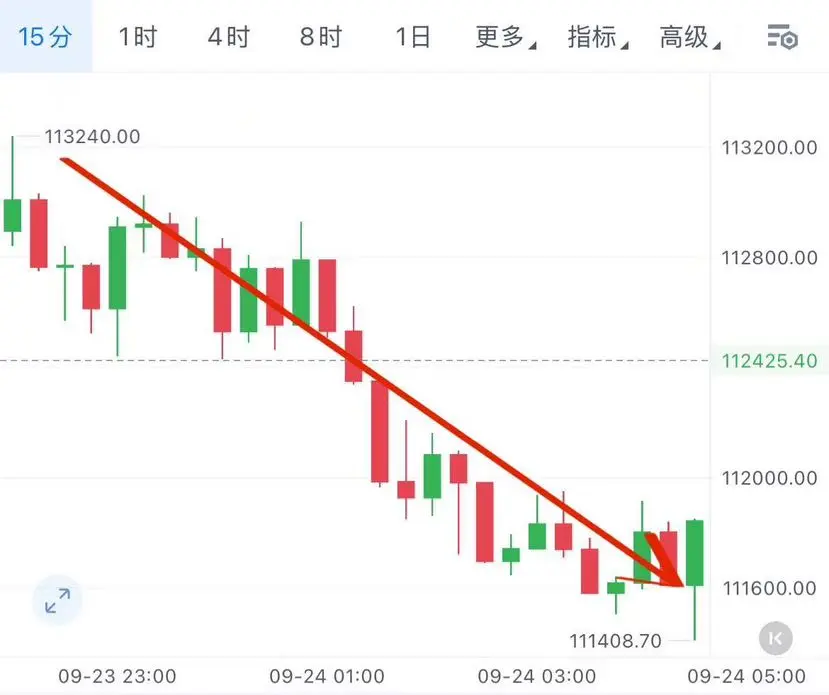
The price of BTC at the 1-hour level has touched the middle line of the Bollinger Bands several times, but each time it couldn't hold steady and quickly fell again. This indicates that there are many sellers above, creating significant pressure, and the buying strength is starting to lag behind.
4-hour level: The market has just rebounded slightly, and several special candlesticks have appeared, indicating that the rebound has been halted. Right now, it is still the sellers who have the say, and there isn't enough momentum to continue the rebound.
Operation suggestion: Short 112700-113200, target 11100-110000