Post content & earn content mining yield
placeholder
gatefun
gatefun
Technical View on Bitcoin: Bitcoin consolidates after sharp decline near key support
Bitcoin remains in a broader correction phase after failing to regain the resistance zone between $93,000 and $100,900, which corresponds to a Fibonacci correction cluster between 0.5 and 0.618. The repeated rejection from this supply area confirmed a structural breakdown, leading to a sharp decline toward lower demand levels.
The price recently dropped near the overall support at $60,000, which aligns with the Fibonacci level 0 at around $59,980. Currently, Bitcoin is consolidating around $69,000–$70,000, ind
BTC1,32%
View Original
post-image
asiftahsinvip
BTC Technical Outlook: Bitcoin Consolidates After Sharp Decline Near Key Support
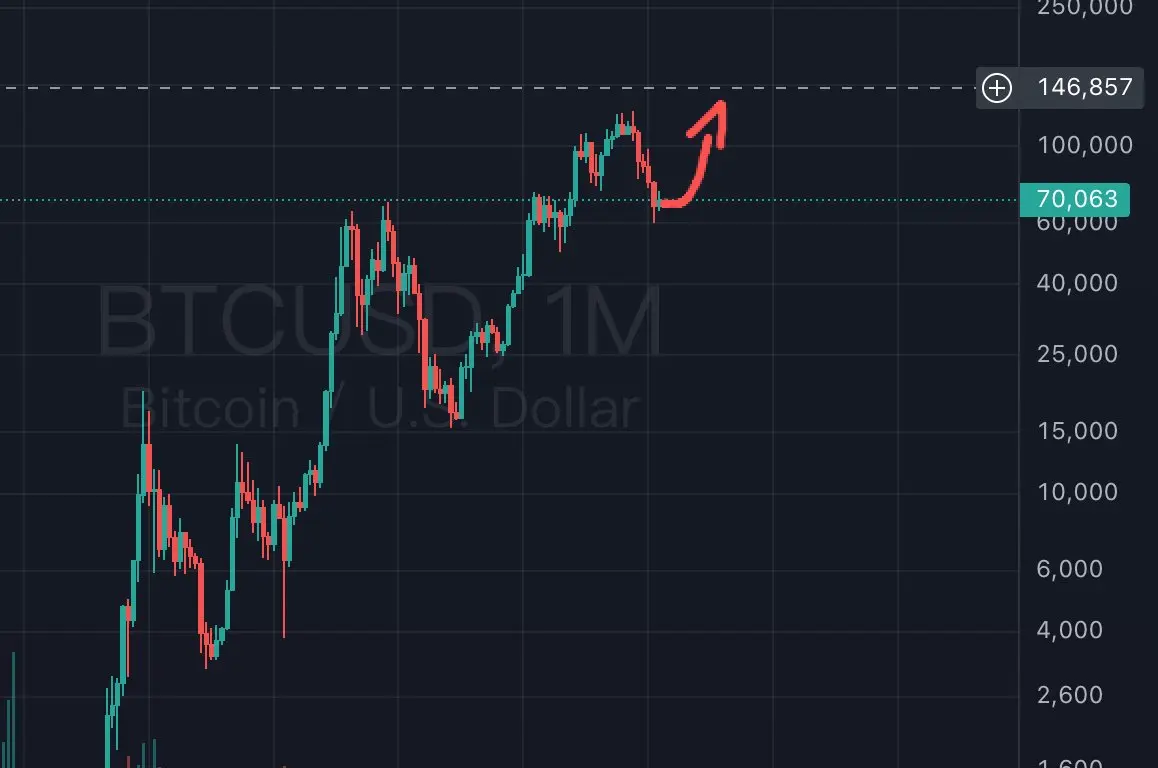
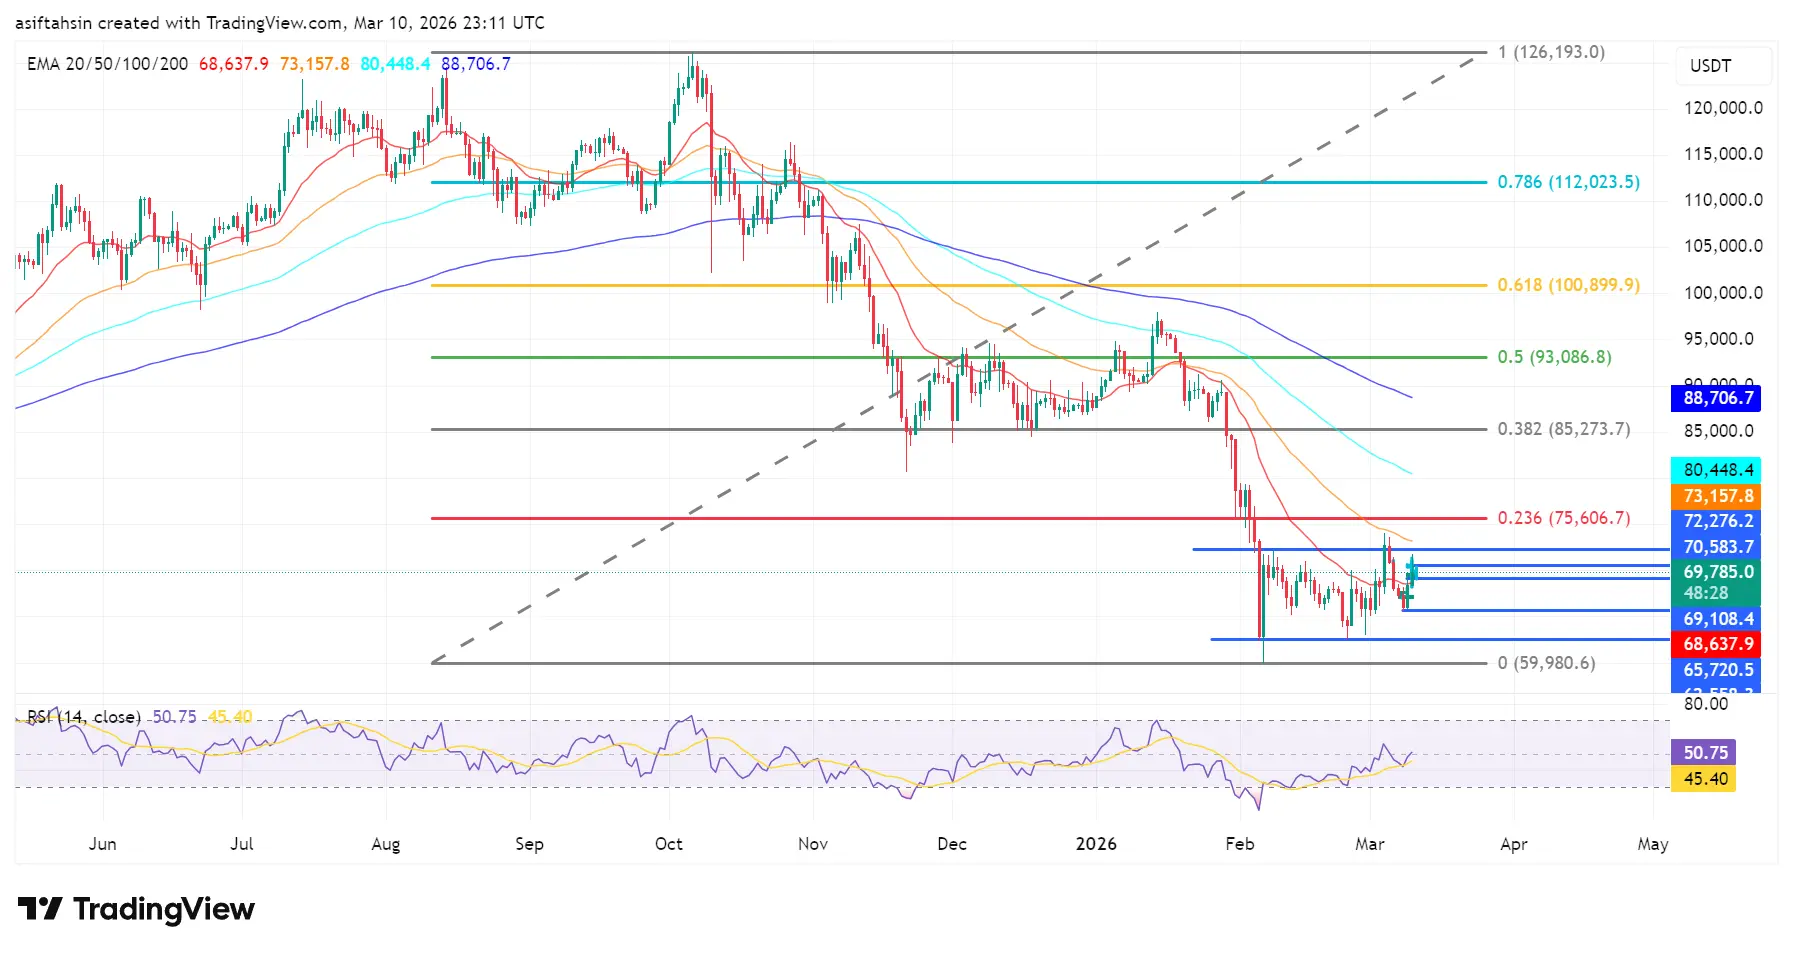
Bitcoin remains in a broader corrective phase after failing to reclaim the $93,000–$100,900 resistance region, which aligns with the 0.5–0.618 Fibonacci retracement cluster. The repeated rejection from this supply zone confirmed a structural breakdown, leading to an aggressive decline toward lower demand levels.
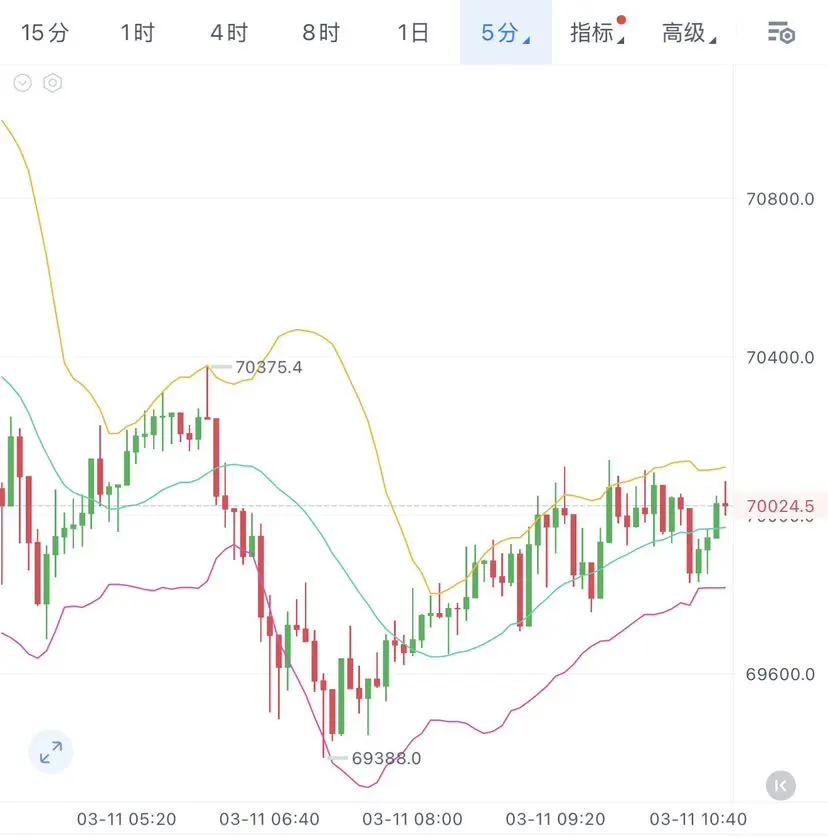
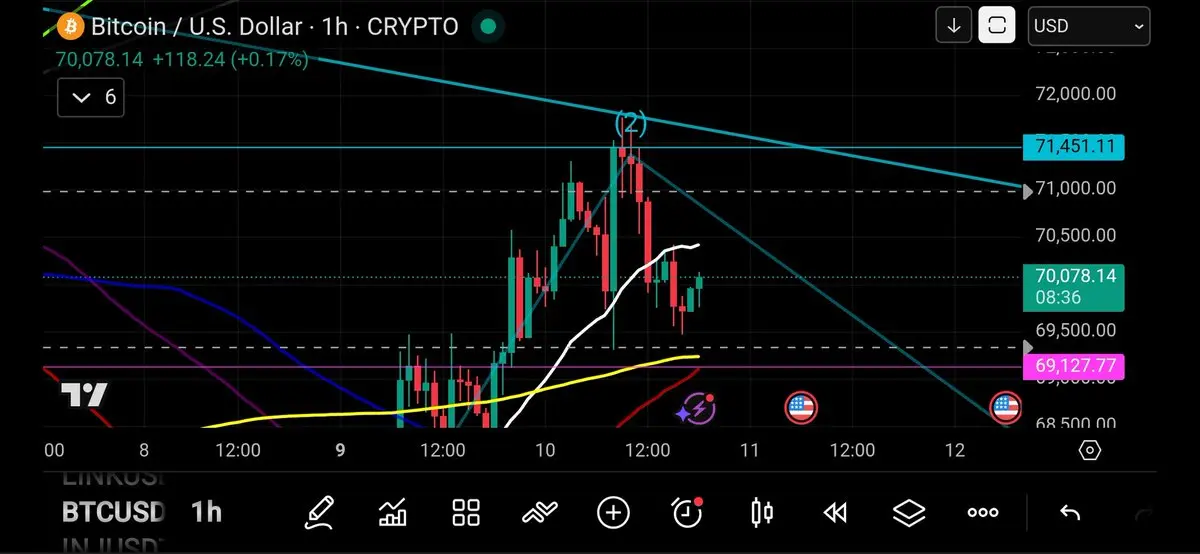
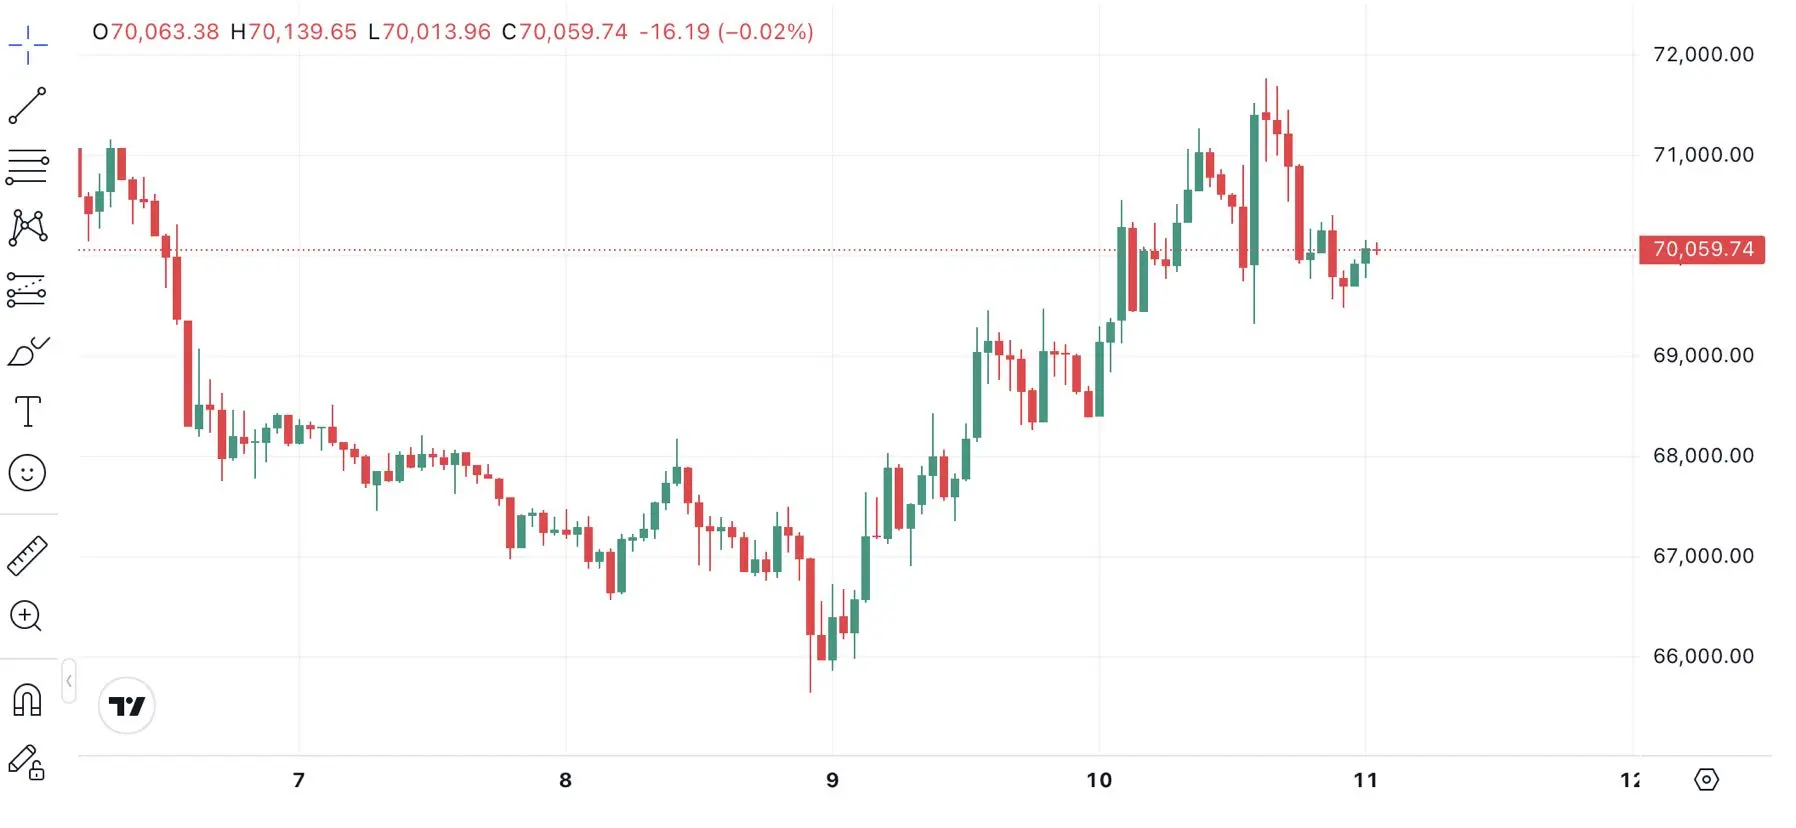
Price recently dropped close to the $60,000 macro support, corresponding with the Fib 0 level near $59,980. BTC is currently consolidating around $69,000–$70,000, suggesting early stabilization after the sharp correction while the market attempts to establish a short-term base.
EMA Structure (Bearish to Neutral Bias)
20 EMA: $68,637
50 EMA: $73,157
100 EMA: $80,448
200 EMA: $88,706
Bitcoin continues to trade below the 50, 100, and 200 EMAs, while the 20 EMA around $68K is acting as immediate dynamic resistance.
The downward alignment of EMAs still reflects bearish pressure, though the compression between price and the short-term EMAs suggests the market may be entering a consolidation phase before the next directional move.
Fibonacci & Price Structure
0.786 Fib: $112,023
0.618 Fib: $100,899
0.5 Fib: $93,086
0.382 Fib: $85,273
0.236 Fib: $75,606
Fib 0: $59,980
BTC continues to trade below the 0.236 Fibonacci level at $75,606, confirming the broader corrective structure.
The recent bounce from the $60K demand zone indicates strong macro support. Current price action between $68K–$71K suggests accumulation or consolidation after the sharp selloff.
A sustained recovery above $73K–$75K would begin shifting momentum toward a broader corrective rebound, while a breakdown below $65K–$60K could trigger another downside expansion.
RSI Momentum
RSI is currently trading around 49–50, indicating neutral momentum.
The indicator has recovered significantly from oversold levels and is approaching the 50 equilibrium level, suggesting improving market balance but not yet confirming a bullish trend reversal.
📊 Key Levels
Resistance
$70,500–$73,000 (20/50 EMA zone)
$75,600 (0.236 Fib)
$85,200 (0.382 Fib)
Support
$69,000–$67,000 (short-term support)
$65,000–$60,000 (macro demand zone / cycle base)
RSI: 49–50 — neutral momentum
📌 Summary
Bitcoin is stabilizing after a sharp decline and currently consolidating near the $69K–$70K region above major cycle support. While downside momentum has slowed, the broader structure remains cautious below $75K.
A sustained recovery above $75K–$85K would signal the early stages of a broader corrective rebound. Until then, BTC is likely to remain in a consolidation phase between $65K and $73K as the market searches for direction after the recent selloff.
$BTC #CryptoMarketBouncesBack
repost-content-media
  • Reward
  • 3
  • Repost
  • Share
Moathalmahdivip:
Hold tight to 💪
View More
A major step in the world of tokenization:
The technical arm of Nasdaq Exchange partners with Seturion Stuttgart, Germany, to develop the tokenized settlement system in Europe
$BTC
#GateFebruaryTransparencyReport #InstitutionalCapitalImpactsMarketStructure
BTC1,32%
View Original
post-image
  • Reward
  • Comment
  • Repost
  • Share
#CryptoMarketBouncesBack
Etherum also surprisingly couldn’t pass $2100 dollar and I think it is road to pass easy if world is normal and Trump no say anything bad .. Because these all affects whole crypto market ..
post-image
  • Reward
  • Comment
  • Repost
  • Share
EGY
EGY
Egypt
gatefun
Created By@gatefunuser_b098
Listing Progress
100.00%
MC:
$32.25K
More Tokens
Today's outlook:
Daily MACD shows a bullish crossover upward, EMA7/EMA30/EMA120 are in a bullish alignment, indicating a bullish trend; 4-hour MACD histogram is shrinking, bullish momentum weakening, caution is needed for consolidation or pullback; RSI is neutral to slightly strong, with overbought correction potential.
Bitcoin:
Enter around 69000-69500, stop loss below 68500,
Target 70500-71000$BTC
BTC1,35%
View Original
post-image
  • Reward
  • Comment
  • Repost
  • Share
Thoughts on #GLM:
$GLM is trading inside a clear falling wedge structure after an extended downtrend, with price compressing between the converging trendlines. The structure shows consistent lower highs and lower lows while volatility gradually contracts, which is typical behavior before a potential breakout.
If $GLM manages to break and hold above the upper wedge resistance, the pattern would signal a bullish reversal and open the door for a momentum move toward higher resistance levels. Until the breakout confirms, $GLM remains in consolidation within the wedge.
#GLM #NasdaqLiftsRestriction
GLM0,8%
post-image
  • Reward
  • Comment
  • Repost
  • Share
Day 31⏰
Posting the $SUI logo till it hits $10💧
Current price: $0.95
SUI1,94%
post-image
  • Reward
  • Comment
  • Repost
  • Share
Crude oil’s epic roller coaster! Intraday swings exceed 40, while Trump claims the war is basically over
gate liveLIVE
322
live-coin
  • Reward
  • Comment
  • Repost
  • Share
The trend is clear, and the direction is certain,
Follow the overall momentum throughout, with the rhythm fully in control.
The process may be calm and unhurried, but the ending will ultimately justify the wait.
In the market's bulls and bears battle, choosing the right trend and maintaining good rhythm will naturally lead to a full harvest.
#GateAI蓝龙虾重磅上线 #加密市场上涨 #特朗普称伊朗战事接近尾声
BTC1,32%
ETH0,96%
SOL0,65%
GT0,57%
View Original
post-image
post-image
post-image
  • Reward
  • Comment
  • Repost
  • Share
BTC is looking very strong. Is it possible that, like in 2019, it will first have a half-year bull run? Starting to get my hopes up—sure enough, when it started to rise, I saw $100,000. Hahaha
BTC1,32%
View Original
post-image
post-image
  • Reward
  • Comment
  • Repost
  • Share
#Bitcoin #BTC
🌙Collect Ramadan Puzzle to share 100,000 USDT Prize Pool!
Details:
BTC1,32%
post-image
  • Reward
  • Comment
  • Repost
  • Share
BTC reverses again, where is it heading?
As the Middle East situation suddenly cools down and oil prices plummet by 27%, market risk sentiment is reversing.
Holding above 70,000 opens up room for bulls; if it cannot hold, this may just be a rebound trap.
BTC1,32%
post-image
post-image
  • Reward
  • Comment
  • Repost
  • Share
🚀 $TNSR / USDT — LONG SETUP
📥 Buy Zone:
🔹 0.0430 – 0.0470
🛑 Stop Loss:
🔻 0.0390
🎯 Targets:
🥇 TP1: 0.0530
🥈 TP2: 0.0600
🥉 TP3: 0.0670
🏆 TP4: 0.0750
⚡ Plan: Scale out profits at targets and move SL to breakeven after TP1.0.039
#TNSR #CaliforniaOpensDigitalAssetLicensesApplications
TNSR4,14%
post-image
  • Reward
  • 1
  • Repost
  • Share
LiderVitriavip:
Let's make history this year
DIjia
DIjia
迪迦奥特曼
gatefun
Created By@GateUser-b22a9d29
Listing Progress
0.00%
MC:
$2.43K
More Tokens
That call on resistance was picture perfect! 📸
Imagine learning how to call an assets target thats worth $70,000 to within a $4.00 accuracy.
Who wants to change their life?
Hard work with the utmost dedication to the craft.
I've started out by learning the large time frames.
All time highs to all time lows.
Then, I branched out to figure out everything in between.
The real magic happened when I learned how to use all the timeframes together.
I want to teach you the different timeframes of technical analysis.
How to navigate the charts.
Give me a follow knowledge is power!
Nothing is EVER fina
post-image
  • Reward
  • Comment
  • Repost
  • Share
Market Update - Wednesday, March 11
Oil prices remain at $80, gold returns to $5,200, and Bitcoin surged to $71,000 before correcting to $70,000.
Hormuz Strait Update & Oil Price Movements:
- The U.S. has reportedly eliminated 16 Iranian minesweepers near the Hormuz Strait. Iran asserts it will not allow any oil tankers to pass.
- The U.S. Energy Secretary announced the successful escort of an oil tanker through Hormuz but later deleted the post, causing a ~17% fluctuation in U.S. oil prices.
- The International Energy Agency (IEA) has proposed releasing over 182 million barrels of oil from re
BTC1,32%
post-image
  • Reward
  • Comment
  • Repost
  • Share
People who farm followers from your page but never support you
post-image
  • Reward
  • Comment
  • Repost
  • Share
#Gate2月透明度报告 Signal】Buy on Pullback! 1H Oversold + Order Book Support, Prepare for Rebound
The 1H timeframe has entered the oversold zone, with the price testing key order book support around 0.238. Although the 4H trend is downward, trading volume remains stable, and there is no sign of panic selling. The RSI on the 1-hour chart has dropped to 35.56, indicating a technical rebound is needed. Currently, the price is far from the 1-hour moving average, so chasing short positions directly is highly risky. Wait for a rebound or a sign of stabilization at a key support level. The buy orders belo
CRV-3,16%
BTC1,32%
ETH0,96%
SOL0,65%
View Original
post-image
  • Reward
  • Comment
  • Repost
  • Share
#Gate2月透明度报告 Signal】Lurking rebound, sniper at 4H level for a rebound!
The 1H level is oscillating narrowly between 0.0626-0.0633, building a short-term bottom. The 4H cycle shows that after a wave of decline, the open interest remains stable and there is no sign of panic selling, indicating that the main force may be supporting the market. The 1-hour RSI is in a neutral to slightly low position, with potential for a rebound. The current price is close to the optimized entry zone, making it an excellent opportunity to position for a rebound.
🎯 Direction: Long
⚡ Entry/Order: 0.0626 - 0.0628
IOTA0,18%
BTC1,32%
ETH0,96%
SOL0,65%
View Original
post-image
  • Reward
  • Comment
  • Repost
  • Share
High Volatility in BTC/ETH/SOL —washout or trend reversal
gate liveLIVE
261
live-coin
  • Reward
  • Comment
  • Repost
  • Share
#pi Congratulations to more and more friends who understand what pi is about! Just like holding onto Apple, Oracle, Tesla, and Nvidia stocks, hold onto your tokens. Seize the opportunity during pi's rapid growth phase, and you'll have a wonderful life! Recent fluctuations won't pose too much pressure or risk; long-term investment is trustworthy. Trust your own choices.
PI9,23%
View Original
post-image
post-image
  • Reward
  • Comment
  • Repost
  • Share
The market is currently showing a steady upward trend with a "step-by-step" approach. This pattern has already clearly revealed the intentions of the main players—bottoms are gradually being solidified, the focus is continuously shifting upward, and challenging new highs is only a matter of time.
Of course, everyone should also be mentally prepared: during the push to new highs, there will inevitably be repeated pullbacks for confirmation. After all, the market currently lacks substantial news catalysts, and reaching this stage solely through technical pattern repairs means the rally won't be
BTC1,32%
ETH0,96%
View Original
post-image
  • Reward
  • Comment
  • Repost
  • Share
Load More