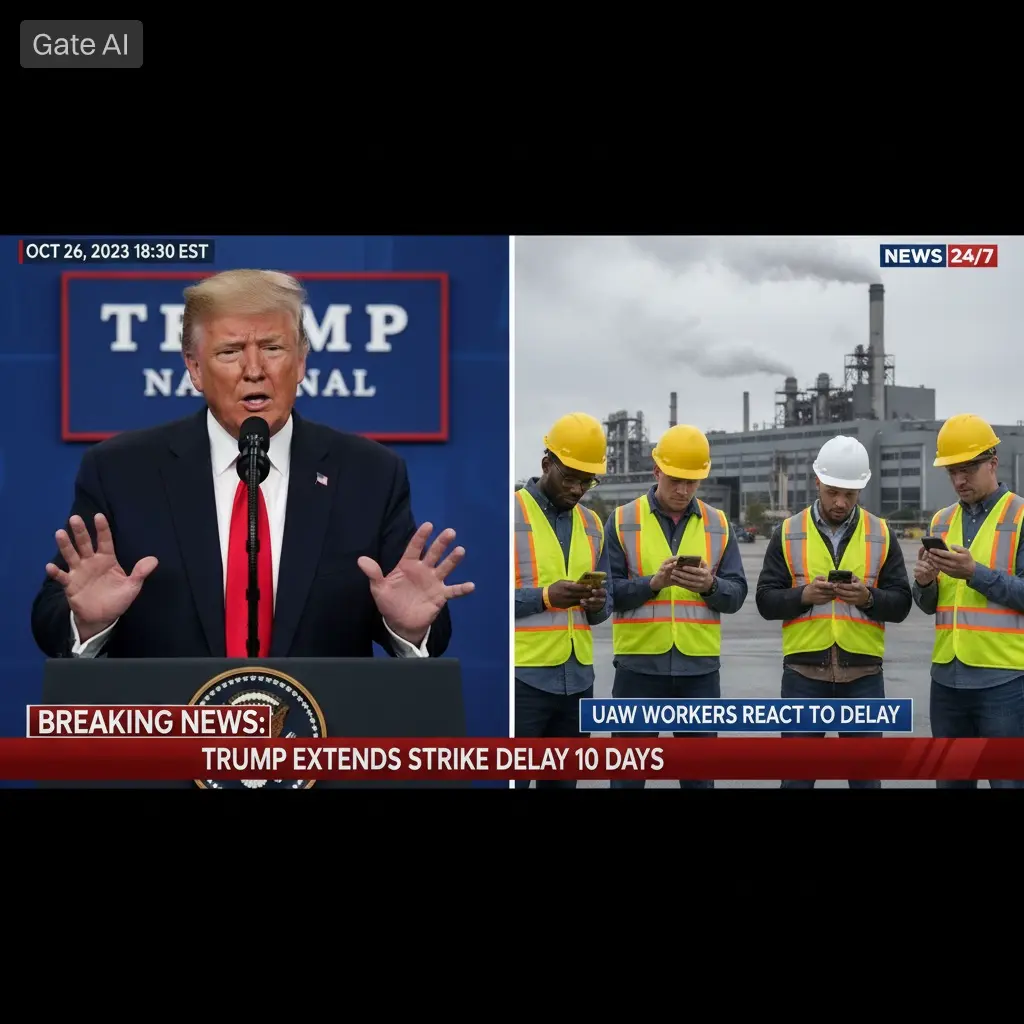
#TrumpExtendsStrikeDelay10Days What Actually Happened? (The Background)
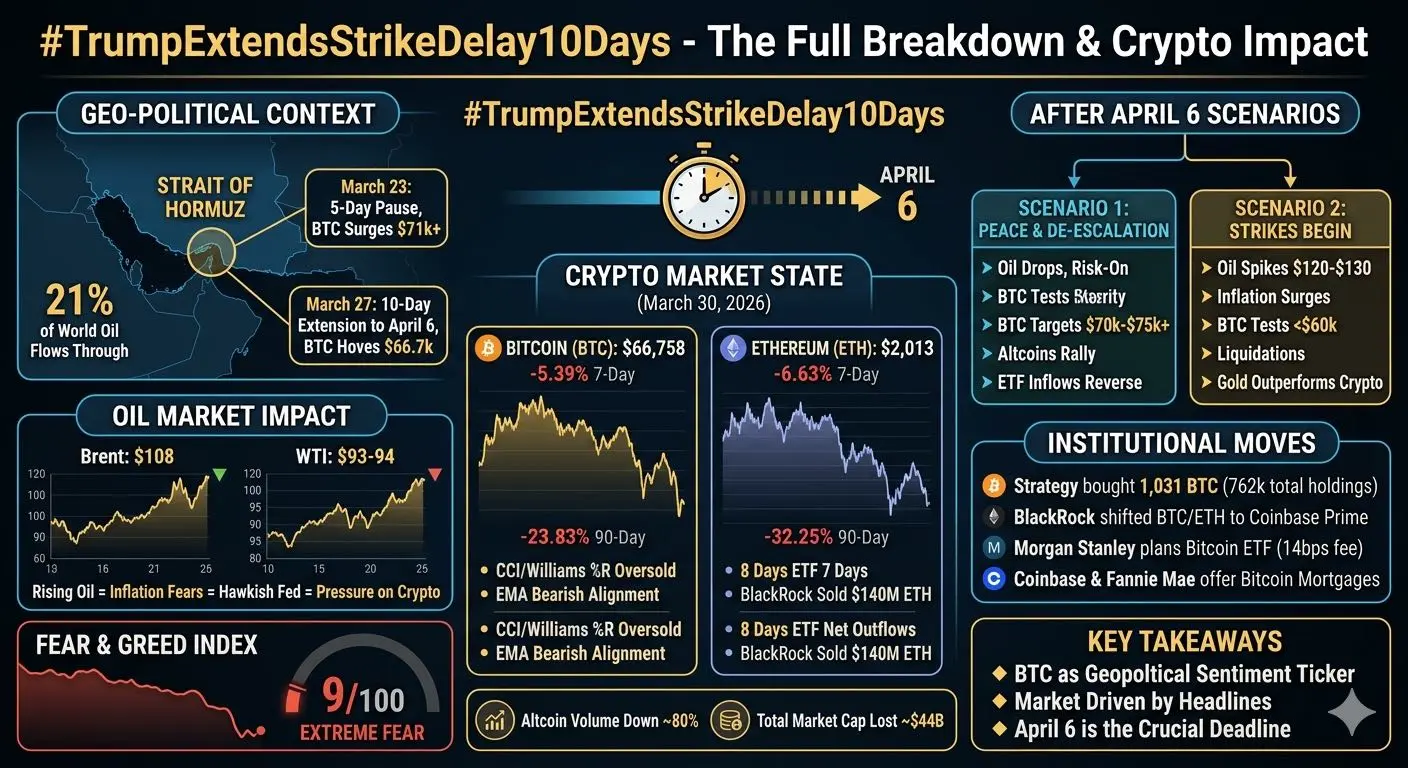
On March 23, 2026, U.S. President Donald Trump sent shockwaves through global markets by announcing via Truth Social a temporary pause on planned military strikes against Iran’s energy infrastructure. The targets were specifically Iran’s power plants and oil-related facilities — the lifeblood of its economy and a critical node in global energy supply. Trump gave Tehran a window of five days to negotiate and ensure the safe passage of ships through the Strait of Hormuz, a move that was initially interpreted as a cautious de-escalation. Markets responded with optimism, as even a brief pause in the threat of conflict tends to ease geopolitical risk premiums.
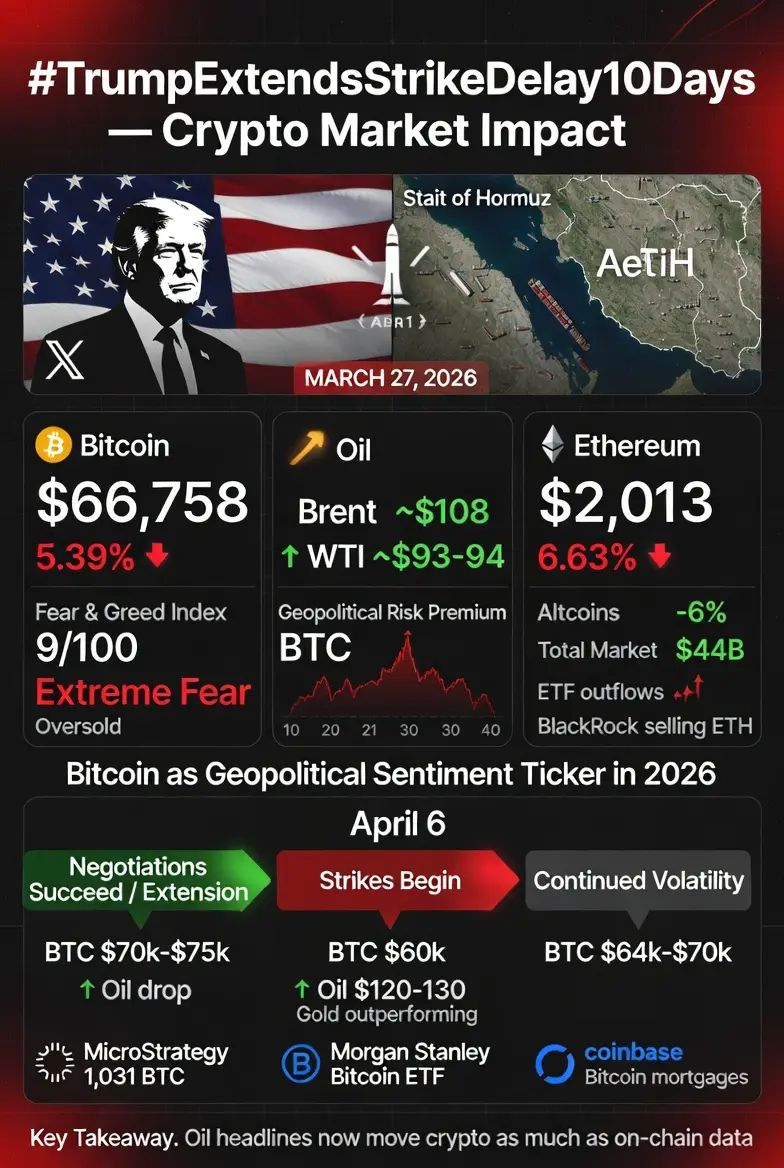
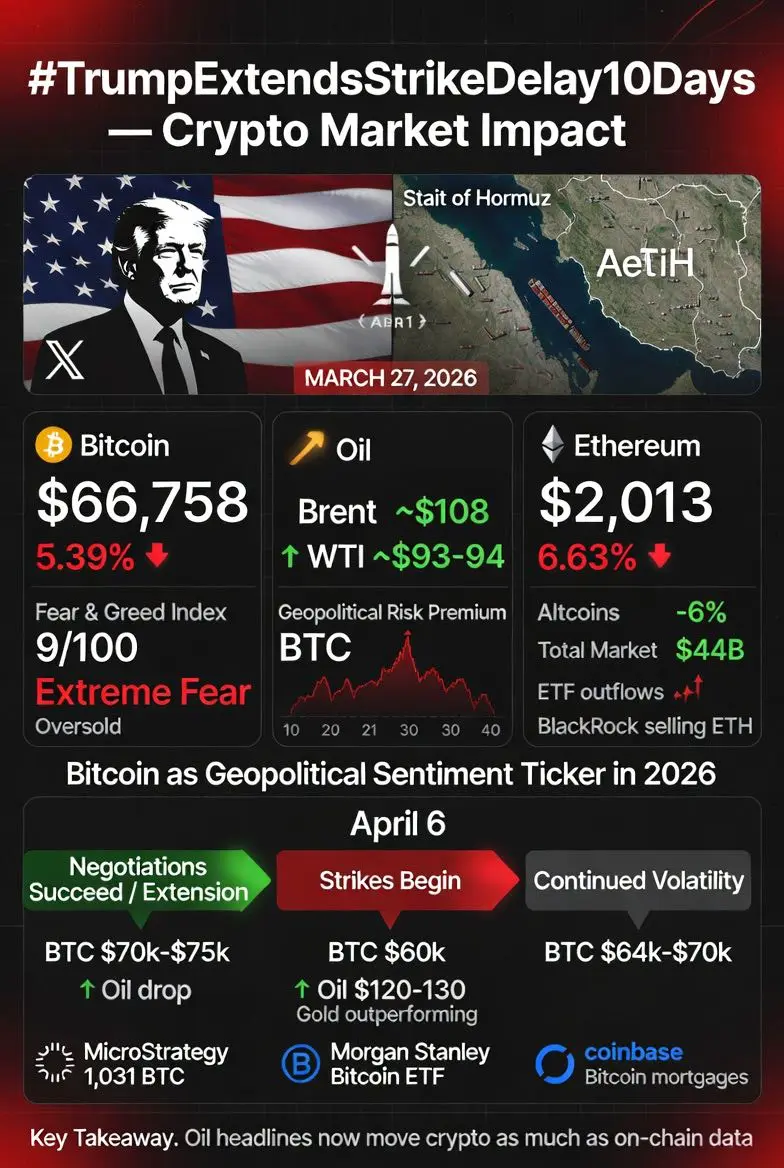
Then, on March 27, in a move that caught many off guard, Trump extended the pause for another ten days, effectively pushing the deadline to April 6. Notably, this announcement came just minutes after U.S. stock markets closed following one of the worst sessions of the year, a timing that many analysts interpreted as strategically calculated. He claimed negotiations were progressing “very well” and highlighted Iran’s symbolic gesture of allowing ten oil tankers to pass through the Strait. Tehran, however, publicly denied that any direct talks were ongoing, creating an information asymmetry that added complexity to market pricing. The hashtag
#TrumpExtendsStrikeDelay10Days trended across X as traders, analysts, and geopolitical commentators dissected the ramifications, particularly for oil and crypto markets that had become increasingly sensitive to every Middle East development.
Why the Strait of Hormuz Matters So Much
The Strait of Hormuz is arguably the single most geopolitically sensitive maritime passage on the planet. Roughly 20–21% of the world’s oil supply flows through this narrow corridor daily, equating to about 17 million barrels per day. Any blockage or disruption would ripple instantly across global energy markets. Historical data shows that even minor threats to the strait trigger sharp spikes in Brent and WTI futures, sometimes in the range of 20–40%. Gulf states such as Saudi Arabia, the UAE, Kuwait, and Iraq rely heavily on this passage for their oil exports, and disruptions would extend far beyond the region, affecting energy supply chains across Europe, Asia, and beyond. This is why a single Trump tweet referencing Iran can send shockwaves not only through stock markets but also through the crypto space, where risk appetite and liquidity respond to global macro events with increasing sensitivity.
The Initial Market Reaction (March 23 — First Delay)
The first announcement of the five-day pause triggered a classic “risk-on” reaction. Bitcoin surged from roughly $69,000 to over $71,000 within hours, a sharp 3% jump that reflected market relief. Oil prices fell as the immediate war premium evaporated, while U.S. equities experienced a notable rebound — Dow Jones futures spiked +1,000 points in premarket trading. Gold, traditionally considered a safe haven, gave back some gains as investors rotated back into risk assets. The broader crypto market mirrored this sentiment: Ethereum, XRP, and Solana all ticked higher, reflecting a renewed appetite for risk. This initial reaction illustrated a pattern that has become increasingly clear over 2026: crypto markets are no longer isolated from macro and geopolitical developments; instead, they move almost in lockstep with broader risk-on and risk-off flows.
The Second Extension (March 27 — 10 More Days)
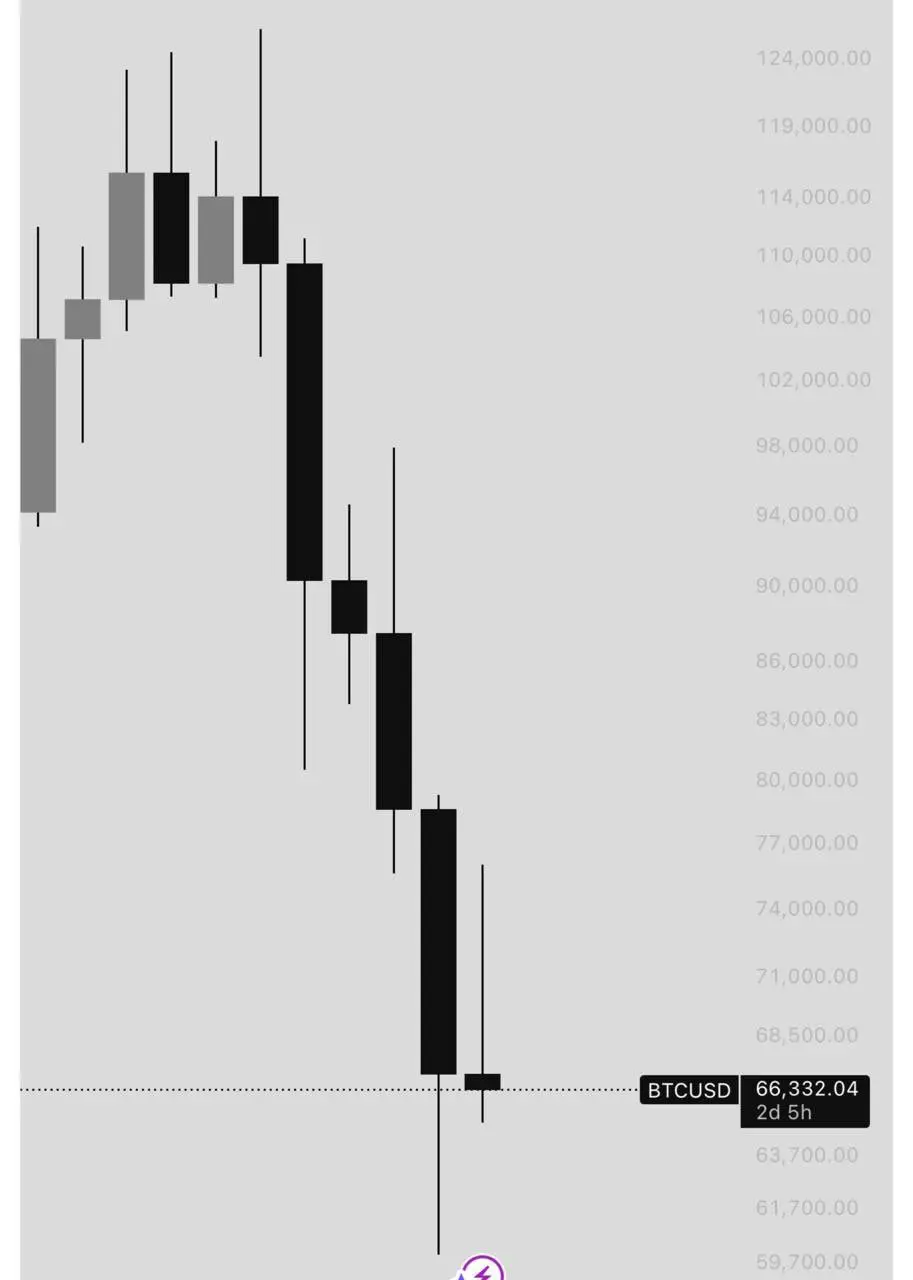
The second extension brought a nuanced market response. Unlike the initial bounce, Bitcoin did not rally significantly, instead hovering around $66,758. The S&P 500 had just posted a -1.7% decline, marking its worst single-day drop in months, while oil prices surged amid lingering fears of military escalation. European markets were expected to open only slightly higher, while Asia-Pacific equities remained under pressure, reflecting the continued uncertainty. Analysts noted a diminishing return in market reactions to repeated diplomatic extensions — the first delay triggered a strong relief rally, but the second was met with skepticism and caution. This pattern suggested that markets were beginning to price in both the possibility of further extensions and the structural risk of conflict, creating a whipsaw environment where short-term headline risk could trigger volatility but not sustained directional moves.
Crypto Market in Full Detail
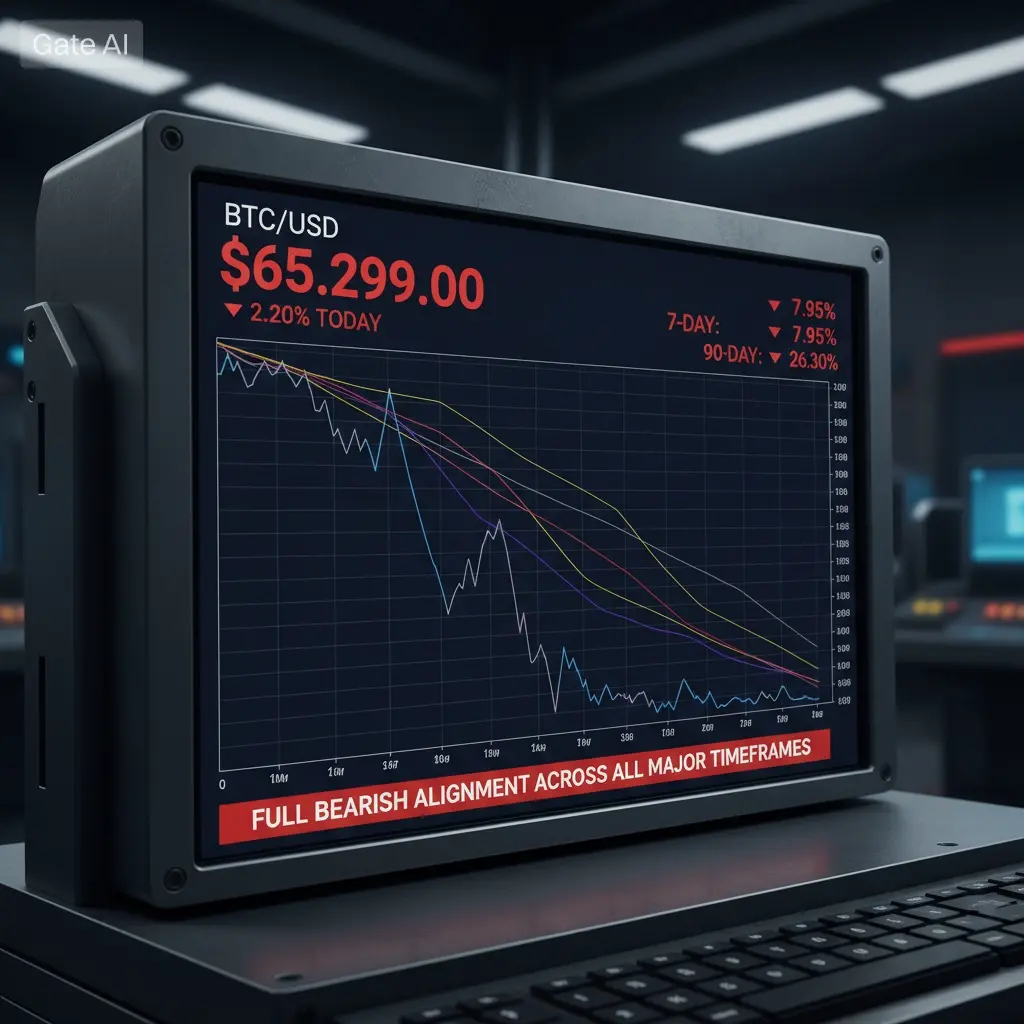
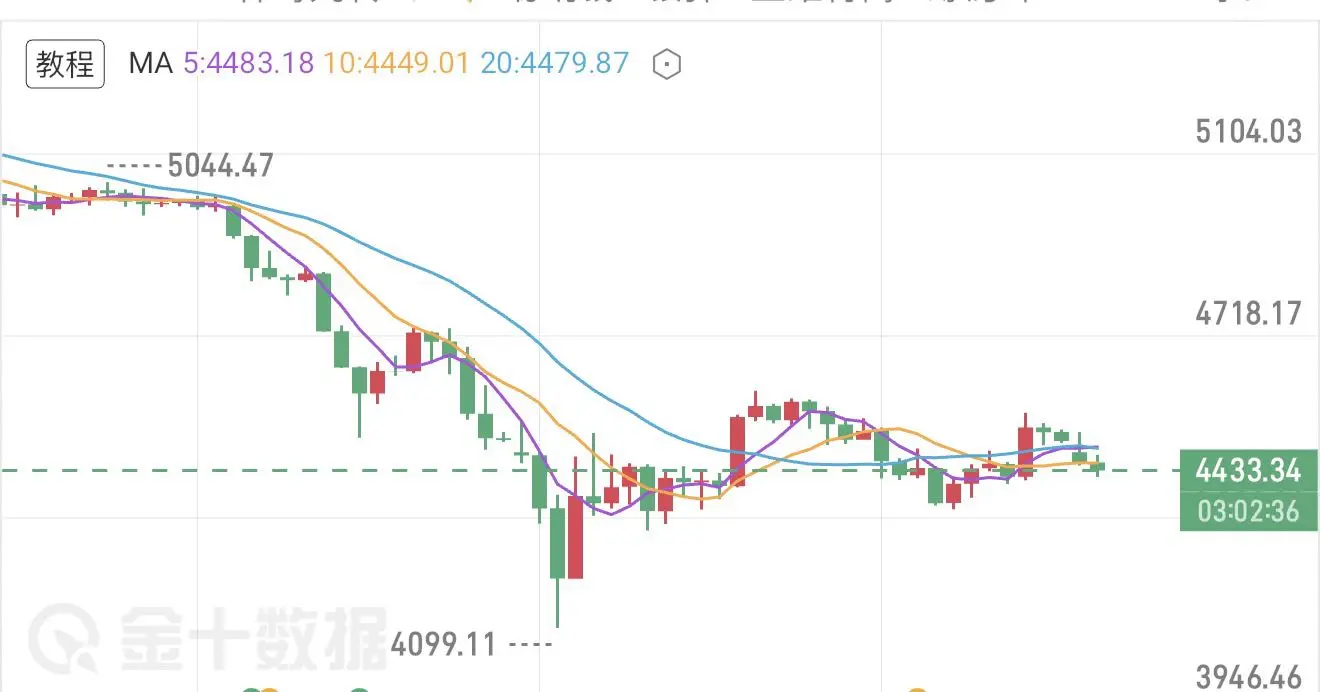
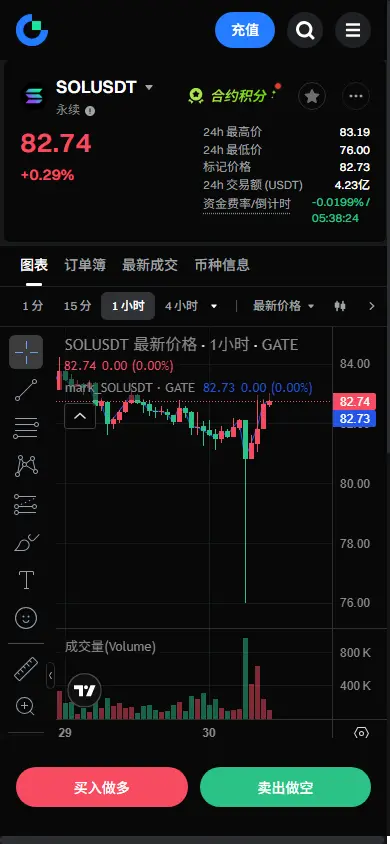
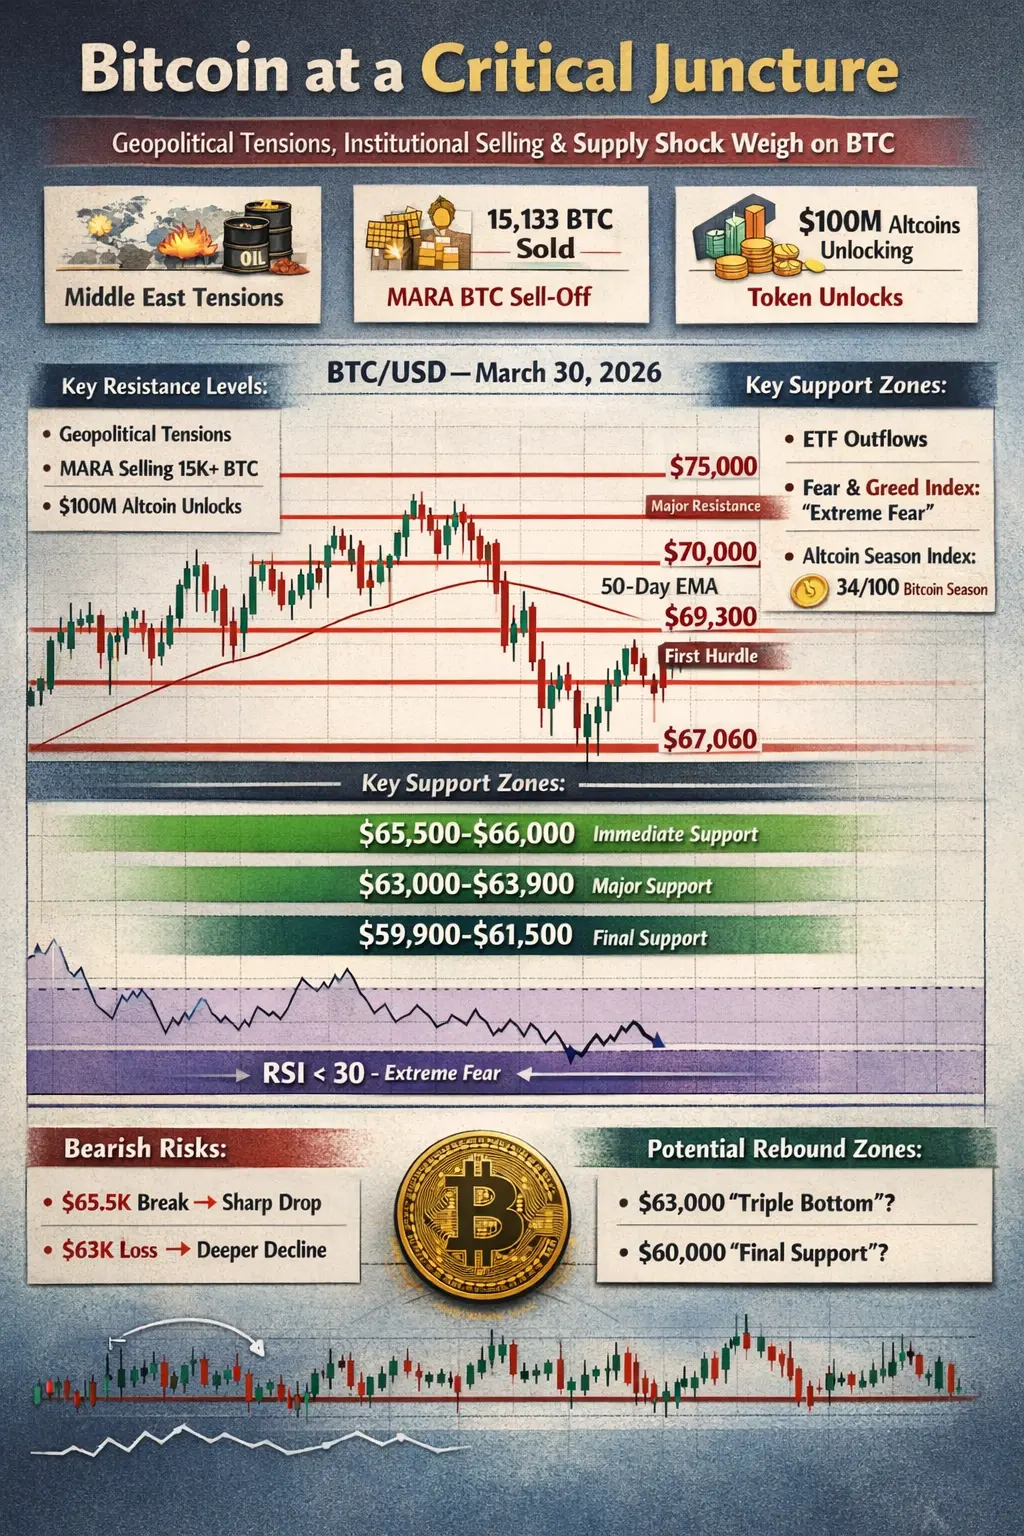
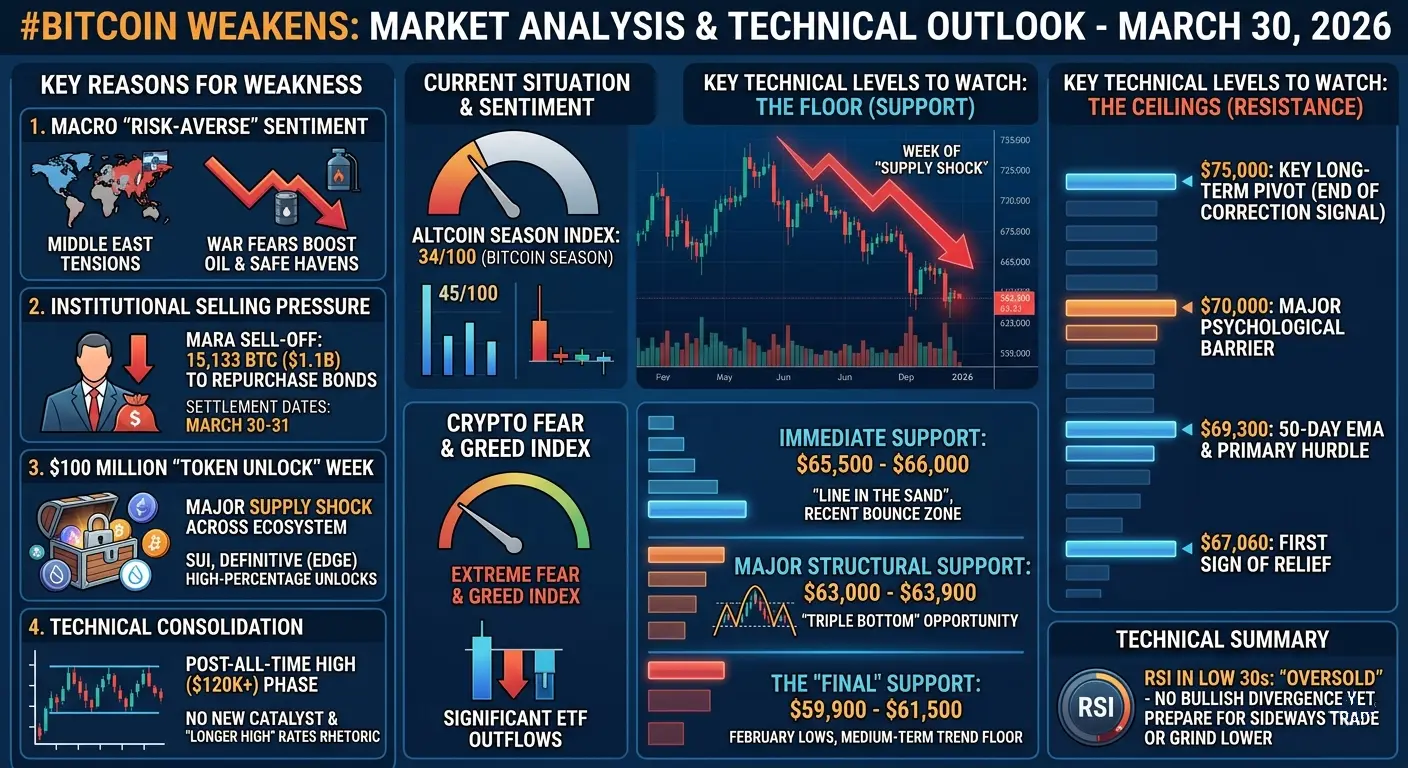
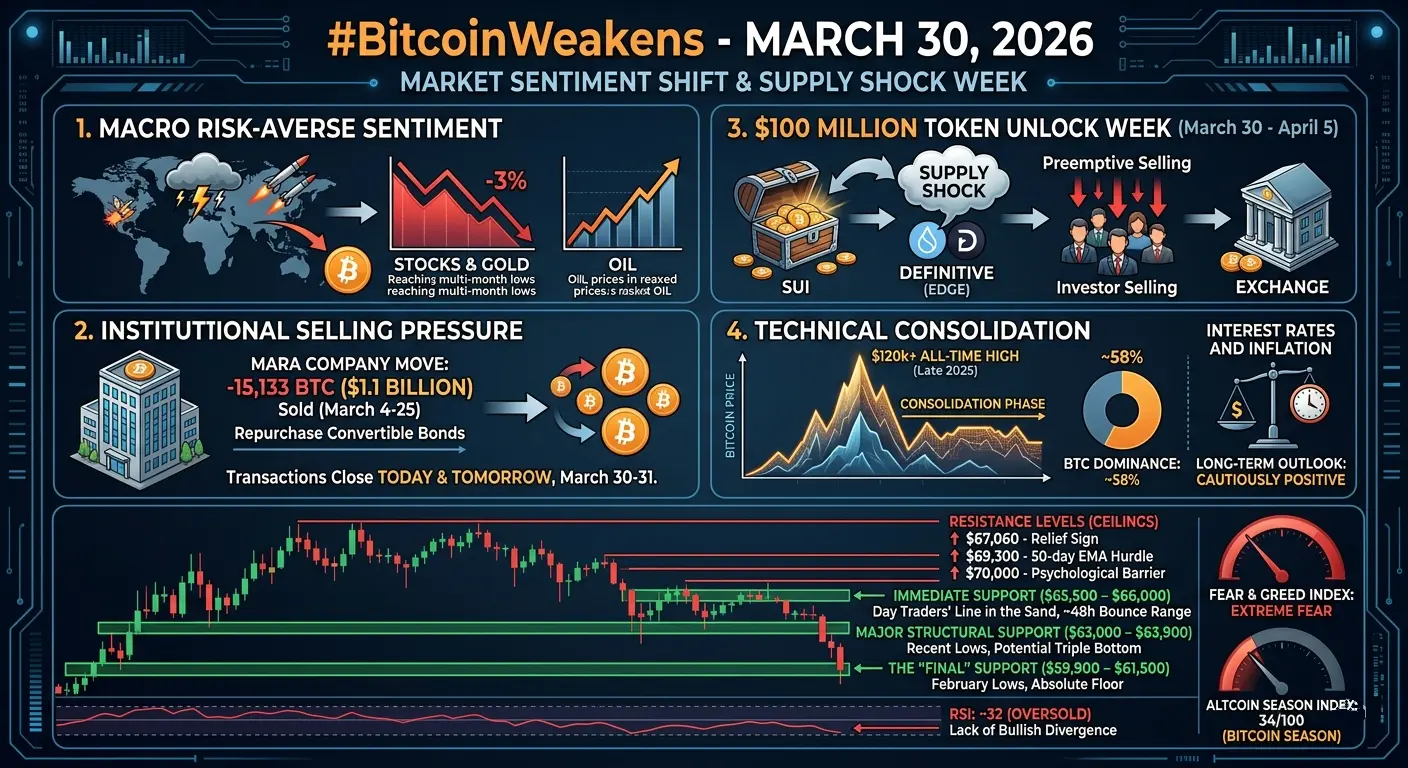
By March 30, 2026, Bitcoin was trading at $66,758, down 5.39% over the previous seven days and 23.83% over 90 days. Its daily chart showed a bearish alignment with the 7-day moving average below the 30-day and 120-day moving averages, signaling that short-term momentum was weak relative to the longer-term trend. However, technical indicators such as the Commodity Channel Index (CCI) and Williams %R suggested that BTC was in oversold territory, highlighting the potential for a technical bounce. The Fear & Greed Index at 9/100 reflected extreme fear, emphasizing the depth of market caution. Ethereum was trading at $2,013, down 6.63% over seven days and 32.25% over 90 days. ETH ETFs saw eight consecutive days of net outflows, with BlackRock alone selling over $140 million in ETH during the week. XRP and Solana each dropped over 6%, while altcoin trading volumes fell by roughly 80% from October 2025 peaks. Total crypto market capitalization declined by approximately $44 billion during this turbulent period. These metrics collectively illustrate a market operating under extreme stress, with sentiment heavily skewed toward caution and downside risk.
Oil & Energy: The Invisible Hand Moving Crypto
Oil continues to act as a hidden macro lever for crypto markets. Rising tensions in the Middle East push oil prices higher, generating inflationary fears that keep the Federal Reserve hawkish and dampen risk assets, including cryptocurrencies. Conversely, Trump’s extensions ease geopolitical pressure, leading to short-term drops in oil and providing a temporary window for crypto to recover. Brent crude traded near $108 per barrel, while WTI hovered around $93–94, levels that signal persistent inflationary pressure. Given the Fed’s focus on inflation, sustained oil prices above $100/barrel could undermine hopes of rate cuts, one of the key structural drivers behind crypto bull markets. Every diplomatic headline, therefore, is not just a geopolitical signal but also a potential market mover for BTC, ETH, and altcoins.
The "Market Revolt" Narrative (Why Trump Blinked)
Several analysts suggested that the timing of the extension — immediately after one of Wall Street’s worst sessions of the year — may have been a deliberate market intervention rather than a purely diplomatic gesture. Trump has a documented history of using social media to influence market psychology, and this latest move reinforced the notion of a “Trump Put” that extends to crypto markets. For traders, this implies that headline-driven volatility is potentially predictable and tradable. The pattern is becoming clear: Trump delays → BTC experiences a brief pop → sentiment fades → markets reassess risk. This emerging behavior signals that geopolitical headlines and crypto price movements are increasingly intertwined, creating both opportunity and risk for traders who actively monitor these events.
What Happens After April 6? Scenarios for Crypto
April 6, 2026, is the next inflection point for crypto markets. If negotiations succeed or the pause is extended, oil prices could fall sharply, risk-on conditions could return, and BTC might recover toward $70,000–$75,000. Altcoins would likely post stronger percentage gains, ETF inflows may reverse, and investor sentiment could improve significantly. If military strikes begin, oil could spike to $120–$130 per barrel, inflation fears would surge, and BTC could test $60,000 or lower, triggering liquidations across leveraged positions. Gold would likely outperform crypto as a safe haven. The most probable scenario is continued headline-driven volatility, keeping BTC in a $64,000–$70,000 range, with option premiums elevated and trading activity focused on short-term swings rather than sustained directional moves.
Institutional Moves During the Chaos
Institutional investors are clearly positioning strategically rather than fleeing during this period of heightened geopolitical risk. Strategy (formerly MicroStrategy) purchased 1,031 BTC for $76.6 million, averaging $74,326 per BTC, bringing total holdings to 762,099 BTC. BlackRock moved substantial BTC and ETH holdings to Coinbase Prime but faced ETF outflows, reflecting mixed client sentiment. Morgan Stanley announced plans to launch a spot Bitcoin ETF with a low 14bps management fee, potentially attracting significant institutional inflows. Coinbase partnered with Fannie Mae and Better Home & Finance to offer Bitcoin-backed mortgages, allowing BTC or USDC as collateral. These actions signal that institutions are actively building infrastructure and positioning for future growth rather than liquidating positions during periods of volatility.
The Bigger Picture: Bitcoin as a Geopolitical Sentiment Ticker
The structural takeaway from
#TrumpExtendsStrikeDelay10Days is clear: Bitcoin in 2026 functions as a geopolitical sentiment instrument. Positive diplomatic signals drive BTC up alongside equities, while conflict fears push it down, diverging from its traditional safe-haven narrative. BTC’s 90-day performance of -23.83% closely mirrors drawdowns in risk assets amid heightened geopolitical tensions, while gold has surged, underscoring the shift in BTC’s role. Traders must now treat Bitcoin as sensitive to geopolitical developments as much as they monitor on-chain metrics, emphasizing the need for proactive risk management and adaptive trading strategies.
Key Takeaways in One Place
Trump’s 10-day extension bought valuable time for diplomacy, markets, and crypto stability. Bitcoin trades at $66,758, ETH at $2,013, with extreme fear dominating market sentiment. Oil prices remain the primary macro signal, and institutional moves indicate ongoing infrastructure development. April 6 will determine whether crypto enters a risk-on recovery or faces heightened drawdowns. Traders should remain vigilant, prioritize oil and geopolitical news as leading indicators, and use this period to strategically position and manage risk.