


#BitcoinWeakens
Bitcoin Spot ETFs Record Massive Outflows: BlackRock's IBIT Bleeds $202 Million in a Single Day
March 27, 2025 — The U.S. Bitcoin spot ETF market recorded a total net outflow of $225 million in a single trading day, revealing that even the sector's dominant player, BlackRock, was not immune to the pressure.
IBIT Takes the Biggest Hit
BlackRock's iShares Bitcoin Trust (IBIT) led the losses with a $202 million net outflow — accounting for roughly 90% of the entire market's daily withdrawal. This signals a meaningful shake in institutional conviction, at least in the short term.
Since its January 2024 launch, IBIT had consistently dominated the ETF landscape with record inflows and swelling assets under management. A single-day outflow of this scale marks a notable inflection point.
The Bigger Picture: An $84.7 Billion Market Under Pressure
Current figures paint the following picture:
• Total net asset value: $84.772 billion
• Historical cumulative net inflow: $55.935 billion
• March 27 daily net outflow: $225 million
The cumulative inflow figure still standing above $55 billion suggests this is not a wholesale institutional exodus — rather, a short-term repositioning. That said, the asset value is facing headwinds not seen in recent months.
Where Does Bitcoin Stand Right Now?
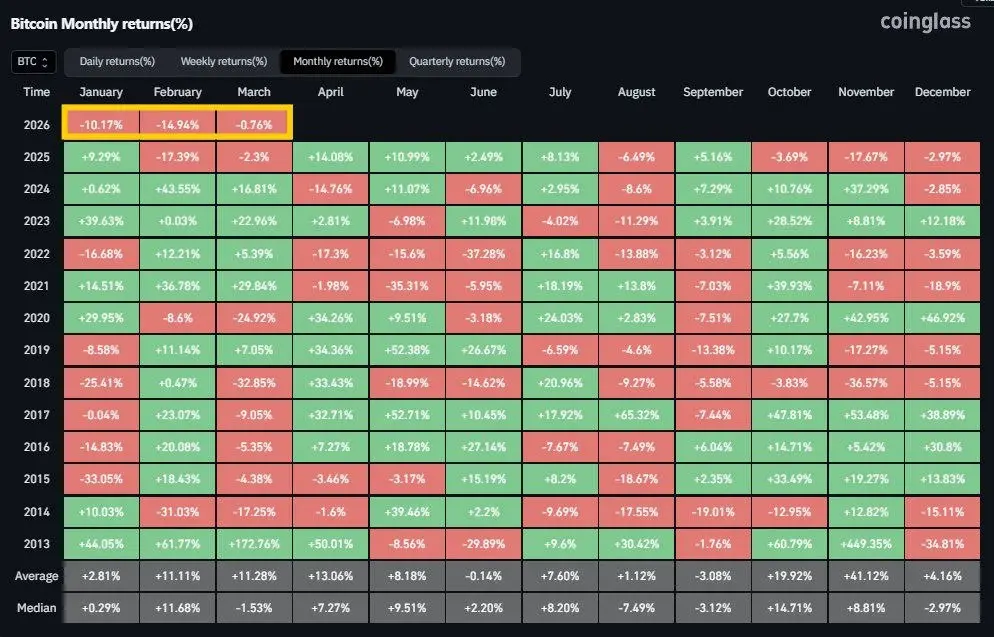
At the time of writing, BTC/USDT is trading at $66,635.
| Timeframe | Change |
|---|---|
| 24 hours | +0.28% |
| 7 days | -6.02% |
| 30 days | -0.51% |
| 90 days | -24.70% |
The 90-day decline confirms Bitcoin has been in a sustained correction from its January 2025 highs. ETF outflows are adding a fresh layer of selling pressure on top of that trend.
What Is Driving the Outflows?
Several factors appear to be converging:
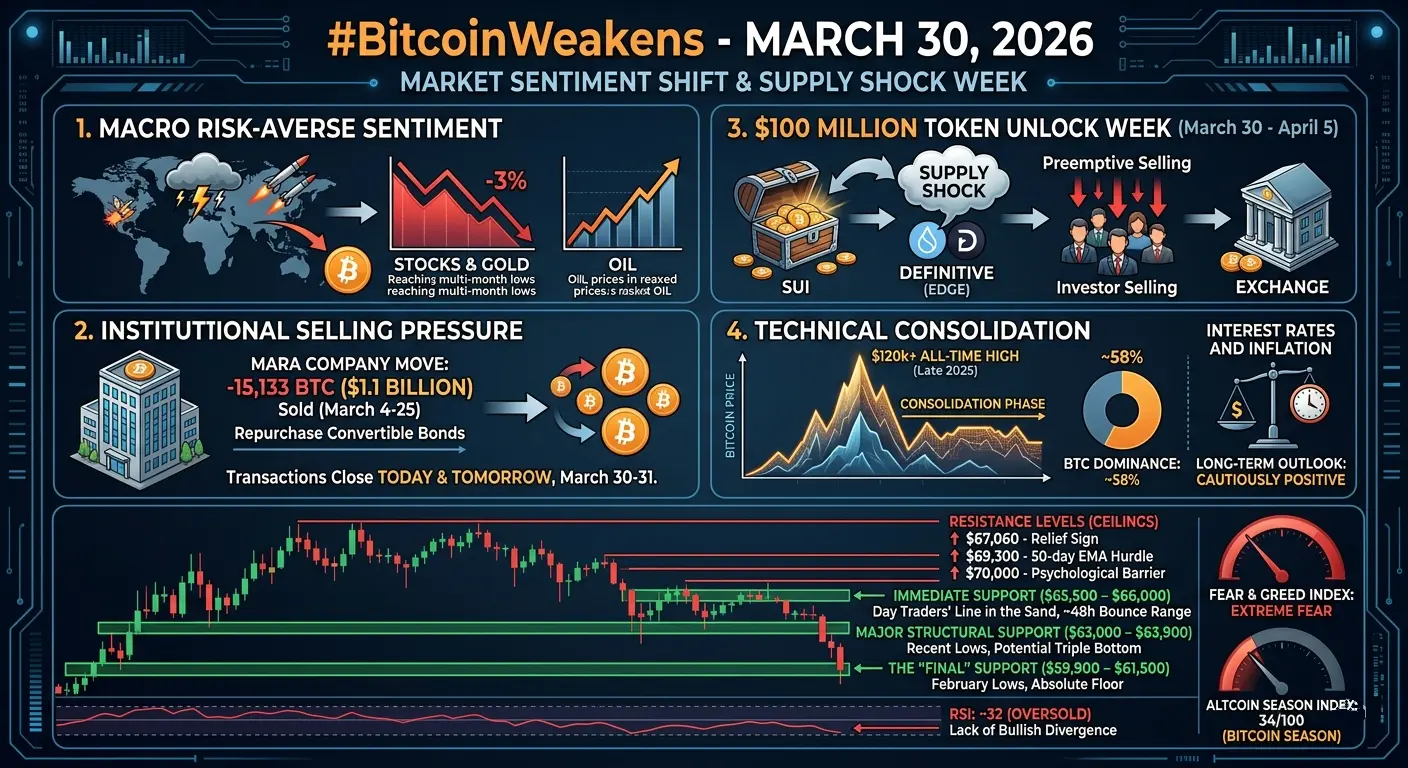
Macro uncertainty: Persistent ambiguity around Fed rate policy and rising U.S. Treasury yields continue to dampen risk appetite across all asset classes, including crypto.
Profit-taking: Institutional players appear to be unwinding positions entered near the Q1 highs, locking in gains before further downside materializes.
Short-term price weakness: The 7-day drop of -6% suggests spot market pressure is feeding directly into ETF redemption activity — a dynamic typical of institutional risk management cycles.
Context: Is This a Crisis?
Not necessarily. A $225 million outflow is significant in absolute terms, but it represents less than 0.3% of the total ETF asset base of $84.7 billion. The $55.935 billion in cumulative net inflows remains a powerful testament to structural institutional demand for Bitcoin as an asset class.
What makes this episode noteworthy is the source: IBIT, widely regarded as the most liquid and trusted Bitcoin ETF vehicle among institutions, led the outflows. When the "safe harbor" fund sees the largest single-day redemption, it warrants attention — even if the broader thesis remains intact.
Bottom Line
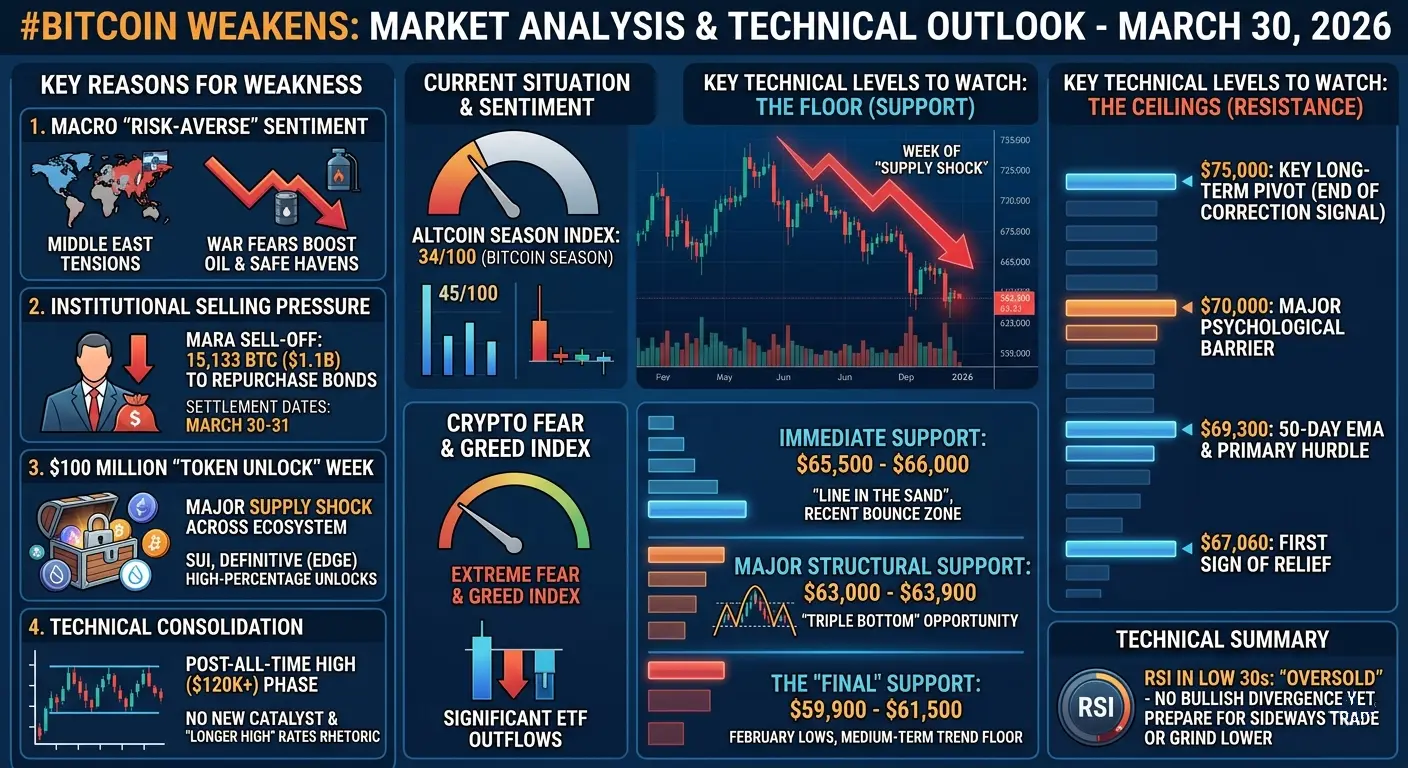
The March 27 ETF outflow is best read as a short-term repositioning event within a structurally bullish long-term trend. Institutional demand for Bitcoin has not disappeared — it is recalibrating. Whether this marks the beginning of a deeper correction or a brief consolidation before the next leg higher will depend heavily on upcoming macro data and Bitcoin's ability to hold key support levels around the $66,000 range.
Data sourced from publicly available ETF flow reports and real-time price data as of March 27–28, 2025.
#RangeTradingStrategy #FedRateHikeExpectationsResurface #CreatorLeaderboard #Web3SecurityGuide
Bitcoin Spot ETFs Record Massive Outflows: BlackRock's IBIT Bleeds $202 Million in a Single Day
March 27, 2025 — The U.S. Bitcoin spot ETF market recorded a total net outflow of $225 million in a single trading day, revealing that even the sector's dominant player, BlackRock, was not immune to the pressure.
IBIT Takes the Biggest Hit
BlackRock's iShares Bitcoin Trust (IBIT) led the losses with a $202 million net outflow — accounting for roughly 90% of the entire market's daily withdrawal. This signals a meaningful shake in institutional conviction, at least in the short term.
Since its January 2024 launch, IBIT had consistently dominated the ETF landscape with record inflows and swelling assets under management. A single-day outflow of this scale marks a notable inflection point.
The Bigger Picture: An $84.7 Billion Market Under Pressure
Current figures paint the following picture:
• Total net asset value: $84.772 billion
• Historical cumulative net inflow: $55.935 billion
• March 27 daily net outflow: $225 million
The cumulative inflow figure still standing above $55 billion suggests this is not a wholesale institutional exodus — rather, a short-term repositioning. That said, the asset value is facing headwinds not seen in recent months.
Where Does Bitcoin Stand Right Now?
At the time of writing, BTC/USDT is trading at $66,635.
| Timeframe | Change |
|---|---|
| 24 hours | +0.28% |
| 7 days | -6.02% |
| 30 days | -0.51% |
| 90 days | -24.70% |
The 90-day decline confirms Bitcoin has been in a sustained correction from its January 2025 highs. ETF outflows are adding a fresh layer of selling pressure on top of that trend.
What Is Driving the Outflows?
Several factors appear to be converging:
Macro uncertainty: Persistent ambiguity around Fed rate policy and rising U.S. Treasury yields continue to dampen risk appetite across all asset classes, including crypto.
Profit-taking: Institutional players appear to be unwinding positions entered near the Q1 highs, locking in gains before further downside materializes.
Short-term price weakness: The 7-day drop of -6% suggests spot market pressure is feeding directly into ETF redemption activity — a dynamic typical of institutional risk management cycles.
Context: Is This a Crisis?
Not necessarily. A $225 million outflow is significant in absolute terms, but it represents less than 0.3% of the total ETF asset base of $84.7 billion. The $55.935 billion in cumulative net inflows remains a powerful testament to structural institutional demand for Bitcoin as an asset class.
What makes this episode noteworthy is the source: IBIT, widely regarded as the most liquid and trusted Bitcoin ETF vehicle among institutions, led the outflows. When the "safe harbor" fund sees the largest single-day redemption, it warrants attention — even if the broader thesis remains intact.
Bottom Line
The March 27 ETF outflow is best read as a short-term repositioning event within a structurally bullish long-term trend. Institutional demand for Bitcoin has not disappeared — it is recalibrating. Whether this marks the beginning of a deeper correction or a brief consolidation before the next leg higher will depend heavily on upcoming macro data and Bitcoin's ability to hold key support levels around the $66,000 range.
Data sourced from publicly available ETF flow reports and real-time price data as of March 27–28, 2025.
#RangeTradingStrategy #FedRateHikeExpectationsResurface #CreatorLeaderboard #Web3SecurityGuide