Trade
Basic
Futures
Futures
Hundreds of contracts settled in USDT or BTC
TradFi
Gold
Trade global traditional assets with USDT in one place
Options
Hot
Trade European-style vanilla options
Unified Account
Maximize your capital efficiency
Demo Trading
Futures Kickoff
Get prepared for your futures trading
Futures Events
Participate in events to win generous rewards
Demo Trading
Use virtual funds to experience risk-free trading
Earn
Launch
CandyDrop
Collect candies to earn airdrops
Launchpool
Quick staking, earn potential new tokens
HODLer Airdrop
Hold GT and get massive airdrops for free
Launchpad
Be early to the next big token project
Alpha Points
Trade on-chain assets and enjoy airdrop rewards!
Futures Points
Earn futures points and claim airdrop rewards
Investment
Simple Earn
Earn interests with idle tokens
Auto-Invest
Auto-invest on a regular basis
Dual Investment
Buy low and sell high to take profits from price fluctuations
Soft Staking
Earn rewards with flexible staking
Crypto Loan
0 Fees
Pledge one crypto to borrow another
Lending Center
One-stop lending hub
VIP Wealth Hub
Customized wealth management empowers your assets growth
Private Wealth Management
Customized asset management to grow your digital assets
Quant Fund
Top asset management team helps you profit without hassle
Staking
Stake cryptos to earn in PoS products
Smart Leverage
New
No forced liquidation before maturity, worry-free leveraged gains
GUSD Minting
Use USDT/USDC to mint GUSD for treasury-level yields
More
AylaShinex
🚀🇭🇰 #GateHKEventsKickOff
Gate HK Events Kick-Off — A Major Step for Global Crypto Leadership
Gate officially launched its Hong Kong event series, marking the beginning of high-level conferences, keynote sessions, and community engagements designed to showcase innovation, ecosystem strength, and strategic leadership in the digital asset space.
This kickoff reflects Gate’s strong commitment to global expansion and Intelligent Web3 development.
🌟 Global Presence & Market Strength
Gate continues to reinforce its position as a top-tier exchange:
• Ranked #2 globally in spot trading — demonstrat

- Reward
- 4
- 9
- Repost
- Share
CryptoSelf:
LFG 🔥View More
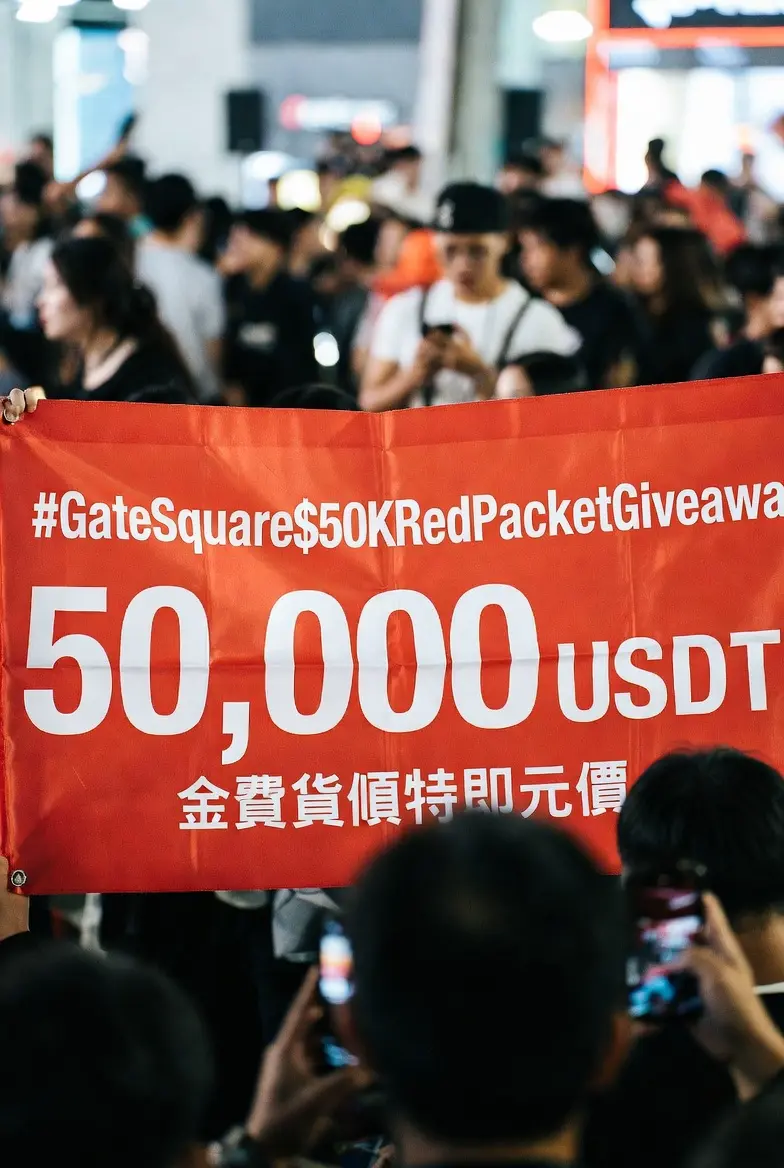
#GateSquare$50KRedPacketGiveaway
a few options for your GateSquare $50K RedPacket Giveaway post, ranging from hype-focused to informative. You can choose the one that best fits your style.
Option 1: The Hype & FOMO Style (Best for Telegram/Discord)
🚀 BIG NEWS: $50,000 RedPacket Giveaway is LIVE on GateSquare! 🚀
The moment you’ve been waiting for is here! 🎁 Gate.io is dropping a massive $50,000 RedPacket giveaway to celebrate the community.
Don't miss out on your share of the prize pool! This is the perfect time to learn, trade, and earn some free crypto.
👇 How to join the party:
1. Head o

- Reward
- 3
- 3
- Repost
- Share
Vortex_King :
:
To The Moon 🌕View More

马勒戈币
马勒戈币
Created By@LittlePonyGogo
Listing Progress
100.00%
MC:
$72.5K
More Tokens
🚨 Register. Claim a rate-up voucher. Earn yield. And yes… even real gold.
Gate Simple Earn just dropped limited-time rewards and this one is actually structured to pull attention.
Here’s what’s live right now:
🎫 2% rate-up voucher
Just for registering, you unlock a boost on your Simple Earn returns. That means higher yield compared to standard rates. No complicated requirements. Straight incentive.
🔥 100% APR for new users
For eligible new participants, there’s a promotional 100% APR offer. These types of boosts are usually limited in allocation and time, so timing matters.
🏆 Up to 30g gol

- Reward
- like
- Comment
- Repost
- Share
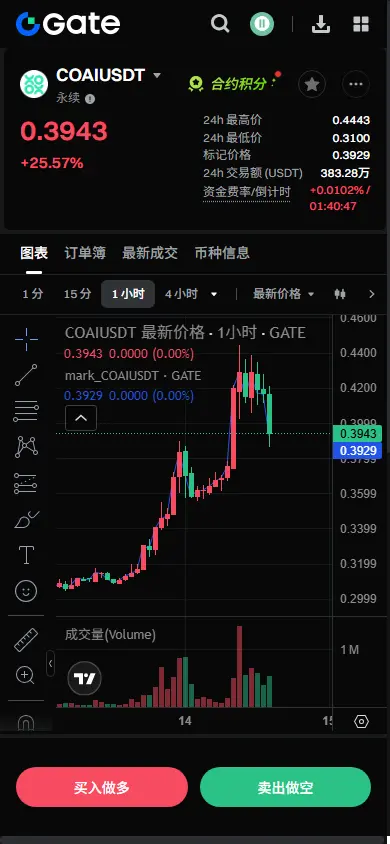
【$COAI Signal】Pullback to buy! 1H pullback confirmation, 4H trend unchanged, aiming for a second surge
$COAI The 1H timeframe is testing a critical support zone for a pullback confirmation, with the price falling from the high of 0.444 to around 0.394, just testing the 1H EMA50 moving average support. The 4H upward trend remains intact, with high-level consolidation after a large bullish candle, indicating a healthy pullback. Position holdings are stable, no large-scale exits observed, and signs of main force protecting the market are evident. This is an excellent short-term entry point.
🎯
View Original$COAI The 1H timeframe is testing a critical support zone for a pullback confirmation, with the price falling from the high of 0.444 to around 0.394, just testing the 1H EMA50 moving average support. The 4H upward trend remains intact, with high-level consolidation after a large bullish candle, indicating a healthy pullback. Position holdings are stable, no large-scale exits observed, and signs of main force protecting the market are evident. This is an excellent short-term entry point.
🎯
- Reward
- like
- Comment
- Repost
- Share
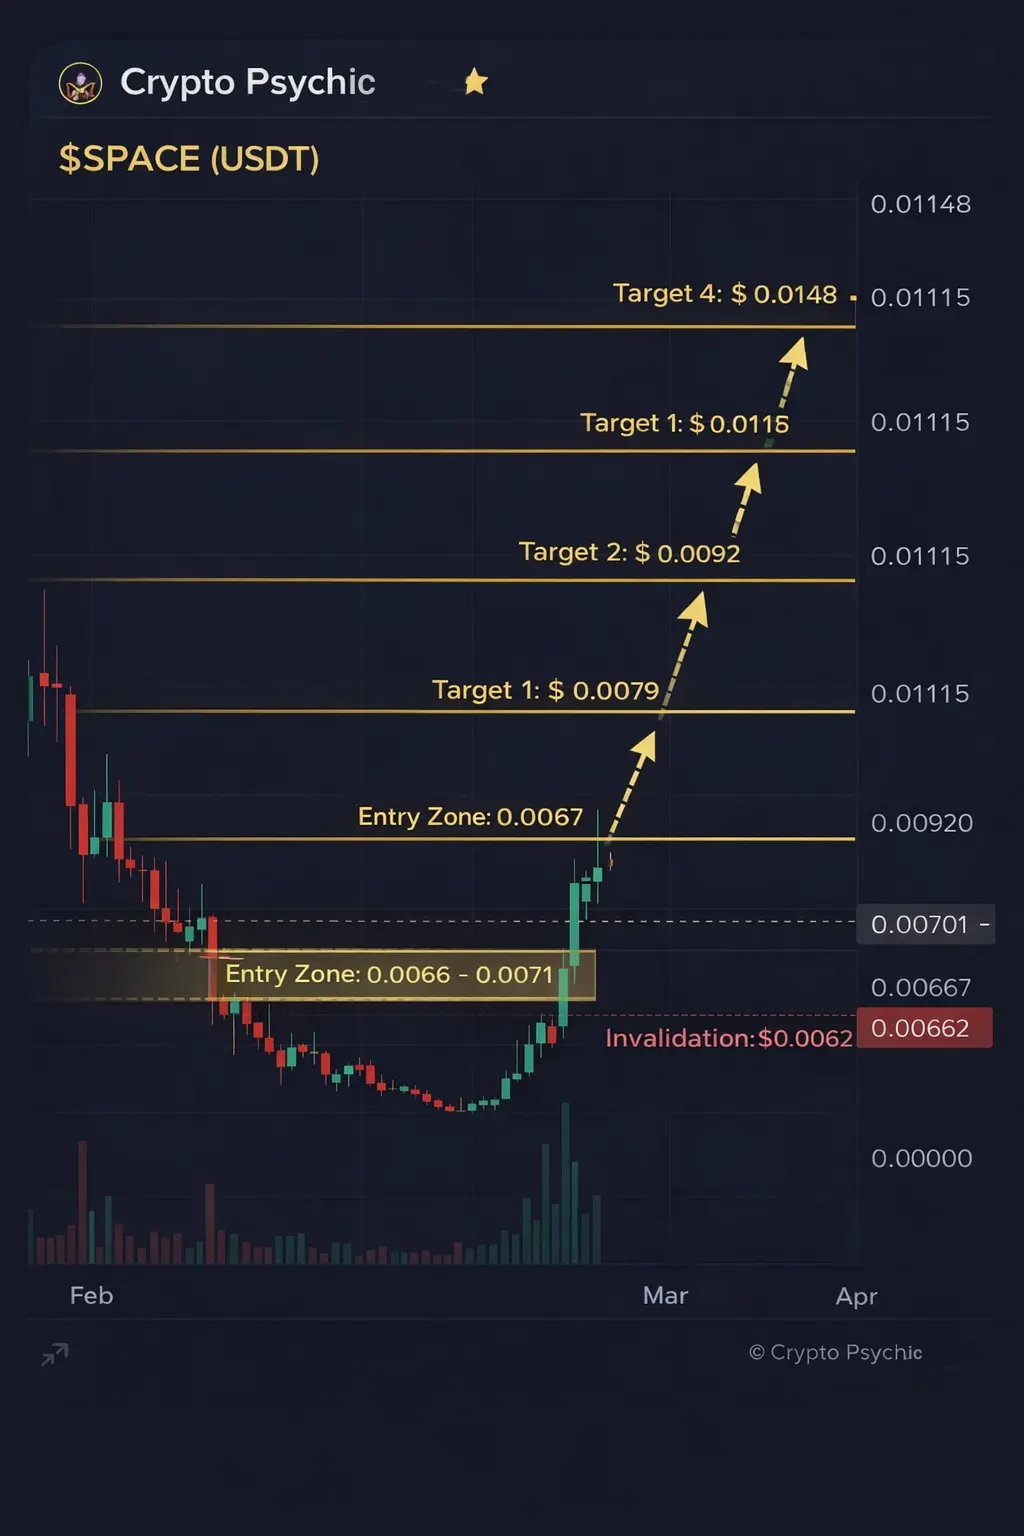
$SPACE (USDT)
Timeframe: 1D
Bias: LONG
Structure: Base expansion after prolonged downtrend compression
Entry:
0.0066 – 0.0071 (prefer shallow pullback toward breakout base)
Targets:
1️⃣ 0.0079
2️⃣ 0.0092
3️⃣ 0.0115
4️⃣ 0.0148 (extension if momentum builds)
Invalidation:
Daily close below 0.0062
Leverage: 2x–6x (daily structure trade)
Technical Context:
After a sustained distribution phase, price printed a clear volatility expansion candle from a tight compression range. This type of move on the daily often signals early phase reversal rather than a simple relief bounce.
Momentum shift is visi
- Reward
- like
- Comment
- Repost
- Share
Participate in horse racing betting, complete tasks to earn horse racing tickets, and enjoy a million red envelope rain daily, sharing a prize pool of 100,000 USDT at Gate 2026 Spring Festival Celebration. https://www.gate.com/competition/year-of-horse-2026?ref_type=165&utm_cmp=7EQB9Jba&ref=AVBEAAGM
View Original
- Reward
- like
- Comment
- Repost
- Share
Is this profit genuine, or is there a possibility that it has been faked?
View Original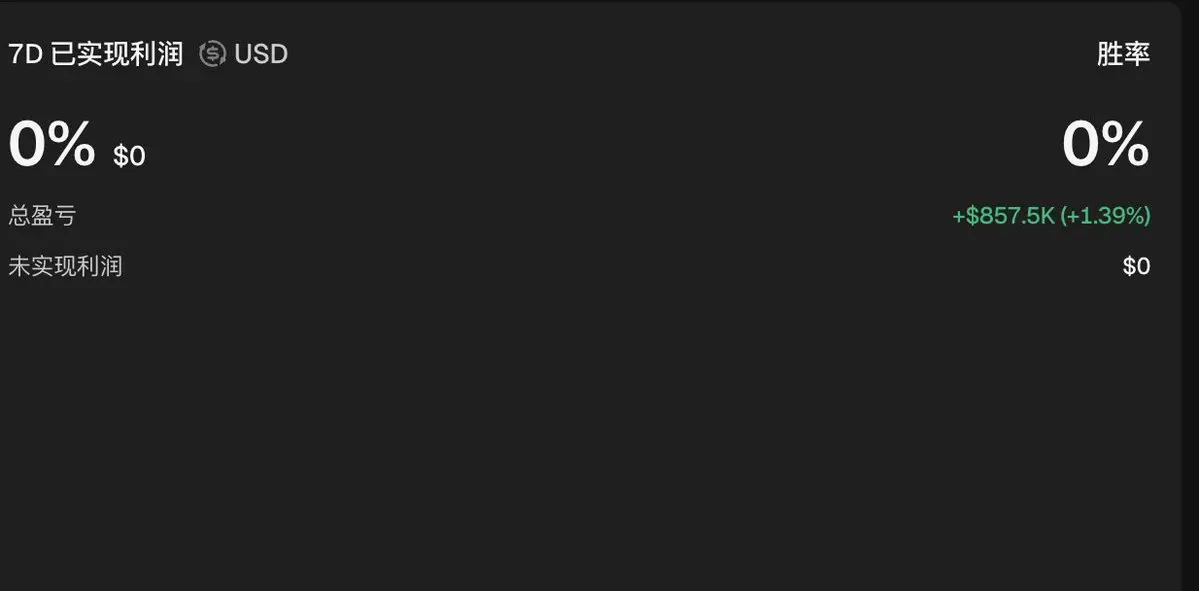
- Reward
- like
- Comment
- Repost
- Share
Just tried ID verification
It's only two steps
1. Set your VPN to the United States
2. Change your phone language to English
Then go to the verification section and you're done. Very simple
#IDVerification
View OriginalIt's only two steps
1. Set your VPN to the United States
2. Change your phone language to English
Then go to the verification section and you're done. Very simple
#IDVerification
- Reward
- like
- Comment
- Repost
- Share
The Russian Central Bank plans to study the feasibility of stablecoins with discussions to be submitted by 2026
0
- Reward
- like
- Comment
- Repost
- Share
Participate in horse racing betting, complete tasks to earn horse racing tickets, and enjoy a million red envelope rain daily, sharing a prize pool of 100,000 USDT at the Gate 2026 Spring Festival Celebration. https://www.gate.com/competition/year-of-horse-2026?ref_type=165&utm_cmp=7EQB9Jba&ref=VVNEB1Fe
View Original
- Reward
- like
- Comment
- Repost
- Share
SJ
升空火箭币
Created By@XiangmiLake
Listing Progress
0.00%
MC:
$0.1
More Tokens
Participate in horse racing betting, complete tasks to earn horse racing tickets, and enjoy a million red envelope rain daily, sharing a prize pool of 100,000 USDT at Gate 2026 Spring Festival Celebration. https://www.gate.com/competition/year-of-horse-2026?ref_type=165&utm_cmp=7EQB9Jba&ref=VlVAXQ8O
View Original
- Reward
- like
- Comment
- Repost
- Share
🔥 NAORISUSDT – $0.03553 (+53.01%)
Strong bullish expansion. Watch for continuation if volume sustains above breakout levels
$NAORIS $BTC $ETH #GateSquare$50KRedPacketGiveaway #CelebratingNewYearOnGateSquare #GateSpringFestivalHorseRacingEvent #BuyTheDipOrWaitNow? #WhiteHouseTalksStablecoinYields
Strong bullish expansion. Watch for continuation if volume sustains above breakout levels
$NAORIS $BTC $ETH #GateSquare$50KRedPacketGiveaway #CelebratingNewYearOnGateSquare #GateSpringFestivalHorseRacingEvent #BuyTheDipOrWaitNow? #WhiteHouseTalksStablecoinYields


[The user has shared his/her trading data. Go to the App to view more.]
MC:$3.44KHolders:311
7.23%
- Reward
- like
- Comment
- Repost
- Share
🔥 HUSDT – $0.22264 (+29.35%)
Momentum building gradually. Break above local resistance could trigger next surge.
$H $BTC $ETH #GateSquare$50KRedPacketGiveaway #GateSpringFestivalHorseRacingEvent #BuyTheDipOrWaitNow? #CelebratingNewYearOnGateSquare #GateHKEventsKickOff
Momentum building gradually. Break above local resistance could trigger next surge.
$H $BTC $ETH #GateSquare$50KRedPacketGiveaway #GateSpringFestivalHorseRacingEvent #BuyTheDipOrWaitNow? #CelebratingNewYearOnGateSquare #GateHKEventsKickOff


[The user has shared his/her trading data. Go to the App to view more.]
MC:$4.09KHolders:2
10.89%
- Reward
- like
- Comment
- Repost
- Share
Participate in horse racing betting, complete tasks to earn horse racing tickets, and enjoy a million red envelope rain daily, sharing a prize pool of 100,000 USDT at the Gate 2026 Spring Festival Celebration. https://www.gate.com/competition/year-of-horse-2026?ref_type=165&utm_cmp=7EQB9Jba&ref=VQRDVVXDVA
View Original
- Reward
- 1
- Comment
- Repost
- Share
Join the horse racing predictions, complete tasks to earn horse racing tickets, enjoy daily million Gift Coins giveaways, and share a 100,000 USDT prize pool—all at the Gate 2026 Spring Festival Celebration. https://www.gate.com/competition/year-of-horse-2026?ref_type=165&utm_cmp=7EQB9Jba&ref=A1cQUAxb

- Reward
- like
- Comment
- Repost
- Share
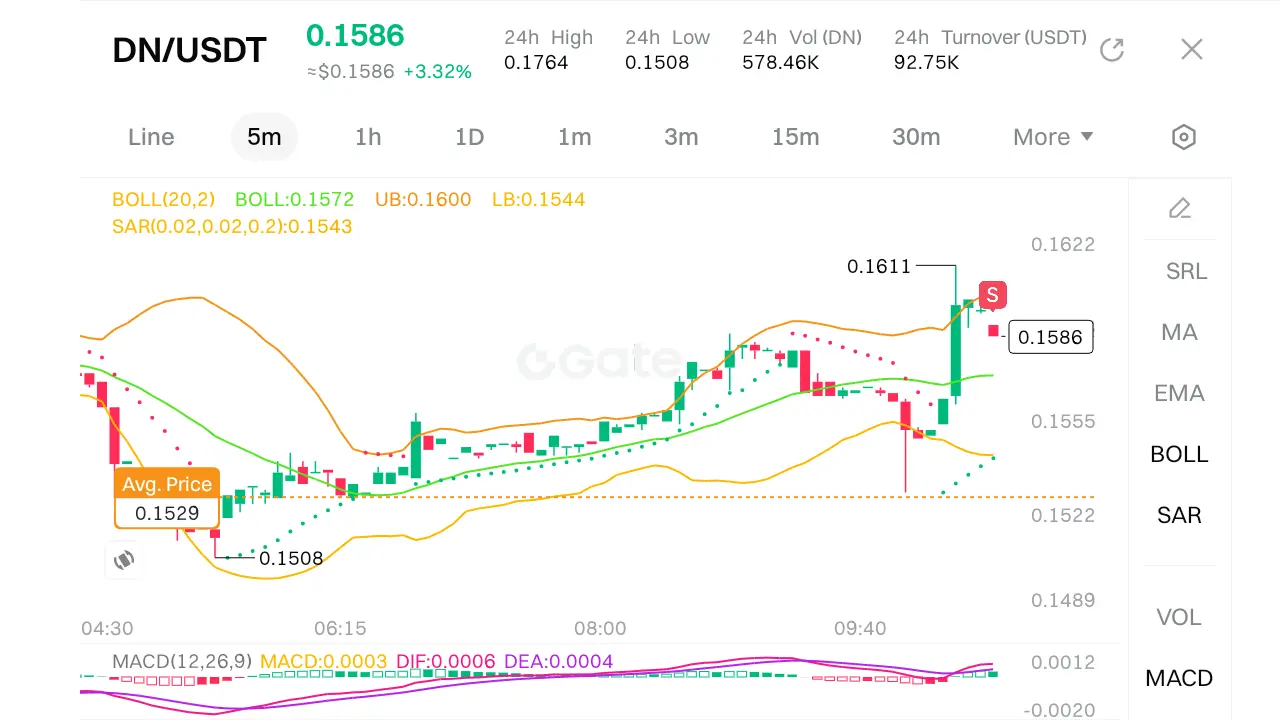
$DN #GateSquare$50KRedPacketGiveaway
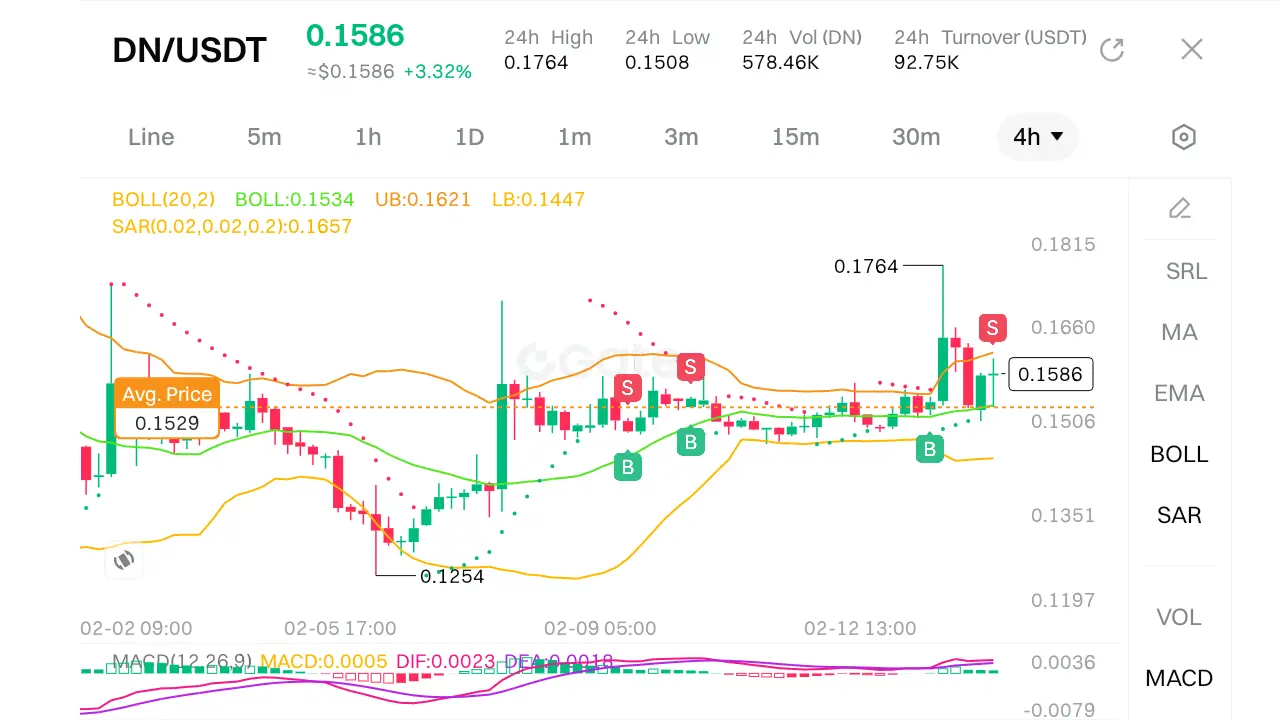
Trading strategy (4H Liquidity → 5 Min Sweep → FVG → Entry → 3RR), here’s a step-by-step analysis and potential trade setup for DN/USDT.
1. Identify 4H Liquidity
Liquidity on the 4-hour chart typically resides at recent swing highs/lows where stop orders cluster.
· From the 4 hour, notable levels include:
· 24h High: 0.1764 (potential sell-side liquidity)
· 24h Low: 0.1508 (potential buy-side liquidity)
· Other levels: 0.1660, 0.1586 (current), 0.1506, 0.1351, 0.1197 – these may represent prior highs/lows or order blocks.
· The chart also shows a SAR
DN4,59%
- Reward
- 1
- 1
- Repost
- Share
INVESTERCLUB:
To The Moon 🌕Long-term position, still holding! Fluctuating up and down
View Original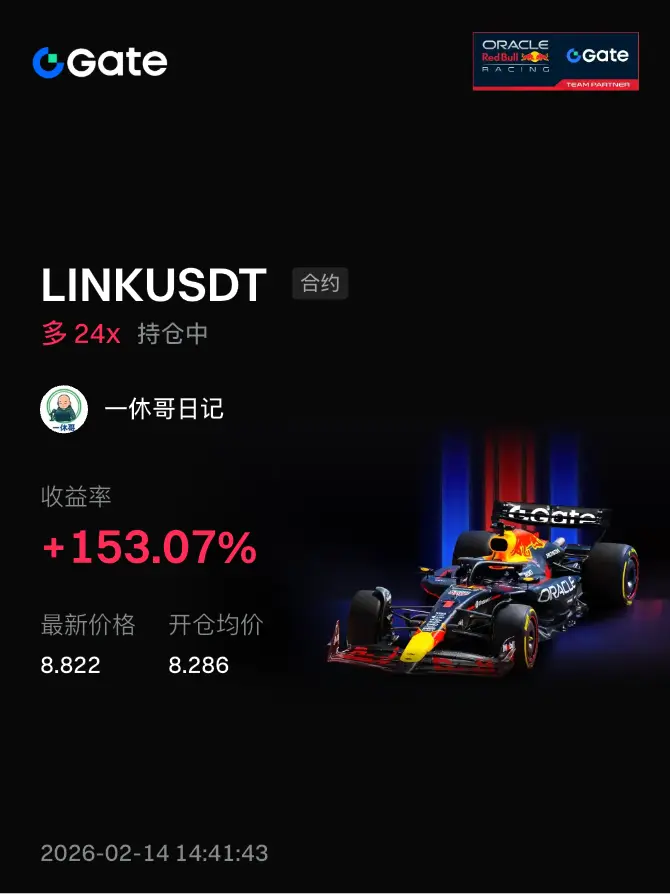
- Reward
- like
- Comment
- Repost
- Share
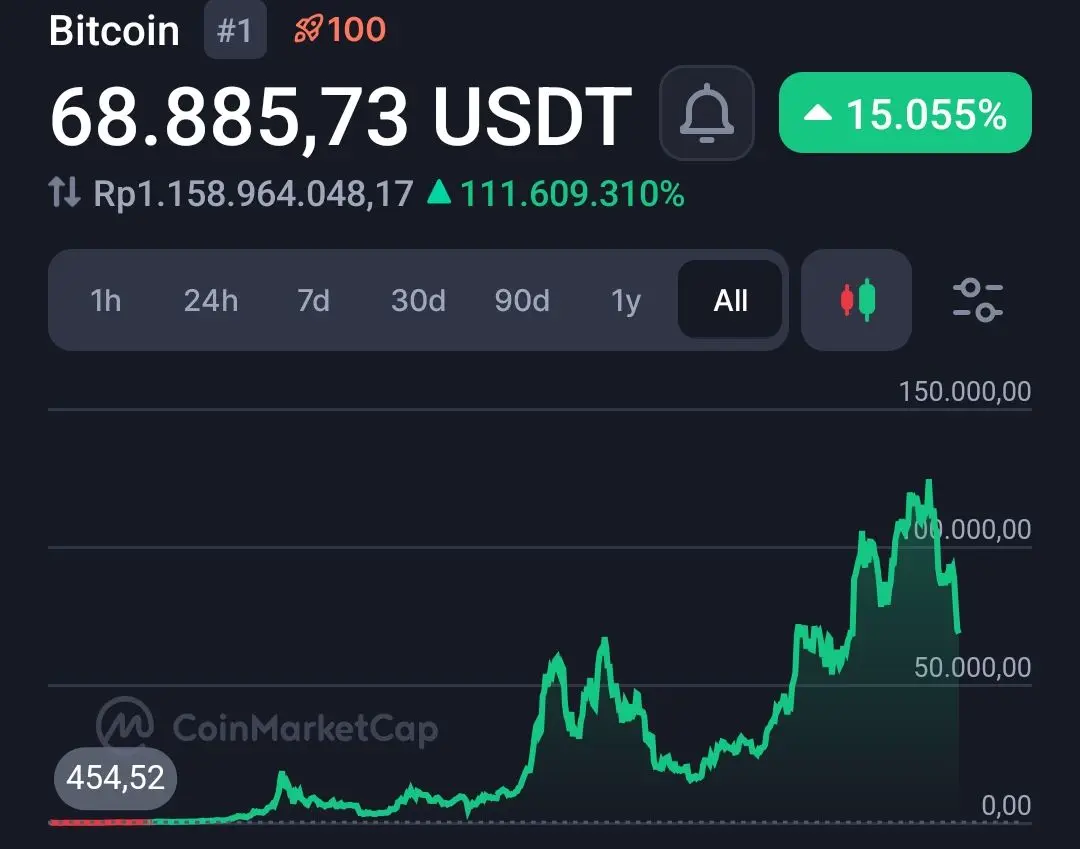
Crypto shakes. Smart money watches.
BTC holding near 69K as ETFs bleed and Coinbase prints a surprise loss. Fear stays high. Volumes thin.
Yet traders are buying the dip and whales are positioning, not panicking.
Do they know something we don't?
BTC holding near 69K as ETFs bleed and Coinbase prints a surprise loss. Fear stays high. Volumes thin.
Yet traders are buying the dip and whales are positioning, not panicking.
Do they know something we don't?
BTC4,24%
- Reward
- like
- Comment
- Repost
- Share
Load More
Join 40M users in our growing community
⚡️ Join 40M users in the crypto craze discussion
💬 Engage with your favorite top creators
👍 See what interests you
Trending Topics
View More65.78K Popularity
1.08K Popularity
1.25K Popularity
48.99K Popularity
274 Popularity
Hot Gate Fun
View More- MC:$0.1Holders:00.00%
- MC:$2.47KHolders:10.00%
- MC:$2.49KHolders:20.06%
- MC:$0.1Holders:10.00%
- MC:$0.1Holders:10.00%
News
View MoreSolana founder joins CFTC's core think tank, bringing a technical perspective to U.S. crypto policy
9 m
Alt5 Sigma transferred 75.8 million WLFI to the WLFI official address at midnight, approximately 8.02 million USD
9 m
Jupiter DAO plans to reduce the JUP issuance to nearly zero, with the 700 million airdrop possibly delayed
11 m
Dragonfly Partner: The listing team's issuance terms are better than last year, possibly due to the high demand for token projects
12 m
Santiment: "Classic Capitulation Signal" Appears in the Meme Coin Market
14 m
Pin